. 2022 Dec 1;71(12):2777-2792.
doi: 10.2337/db21-0573.

Exercise-Linked Skeletal Irisin Ameliorates Diabetes-Associated Osteoporosis by Inhibiting the Oxidative Damage-Dependent miR-150-FNDC5/Pyroptosis Axis

Affiliations

Exercise-Linked Skeletal Irisin Ameliorates Diabetes-Associated Osteoporosis by Inhibiting the Oxidative Damage-Dependent miR-150-FNDC5/Pyroptosis Axis

Jyotirmaya Behera et al. Diabetes. .

Abstract

Recent evidence suggests that physical exercise (EX) promotes skeletal development. However, the impact of EX on the progression of bone loss and deterioration of mechanical strength in mice with type 2 diabetic mellitus (T2DM) remains unexplored. In the current study, we investigated the effect of EX on bone mass and mechanical quality using a diabetic mouse model. The T2DM mouse model was established with a high-fat diet with two streptozotocin injections (50 mg/kg/body wt) in C57BL/6 female mice. The diabetic mice underwent treadmill exercises (5 days/week at 7-11 m/min for 60 min/day) for 8 weeks. The data showed that diabetes upregulated miR-150 expression through oxidative stress and suppressed FNDC5/Irisin by binding to its 3'-untranslated region. The decreased level of irisin further triggers the pyroptosis response in diabetic bone tissue. EX or N-acetyl cysteine or anti-miRNA-150 transfection in T2DM mice restored FNDC5/Irisin expression and bone formation. Furthermore, EX or recombinant irisin administration prevented T2DM-Induced hyperglycemia and improved glucose intolerance in diabetic mice. Furthermore, osteoblastic knockdown of Nlrp3 silencing (si-Nlrp3) or pyroptosis inhibitor (Ac-YVADCMK [AYC]) treatment restores bone mineralization in diabetic mice. Micro-computed tomography scans and mechanical testing revealed that trabecular bone microarchitecture and bone mechanical properties were improved after EX in diabetic mice. Irisin, either induced by skeleton or daily EX or directly administered, prevents bone loss by mitigating inflammasome-associated pyroptosis signaling in diabetic mice. This study demonstrates that EX-induced skeletal irisin ameliorates diabetes-associated glucose intolerance and bone loss and possibly provides a mechanism of its effects on metabolic osteoporosis.


Figures

Figure 1
Figure 1
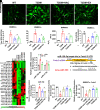
EX promotes FNDC5/Irisin expression in the skeleton of diabetic mice. A: Representative image of the structure of the myokine irisin released from the extracellular domain of the FNDC5 region of bone tissue. CTF, C-terminal fragment. B: mRNA transcript expression of Fndc5 in various tissues (vastus lateralis muscle, bone) and cells (BM, BMMSCs, and osteoclasts) from qPCR analysis. C: mRNA transcript expression of Fndc5 in slow-twitch soleus (primarily type I fibers), fast-twitch vastus lateralis (primarily type IIb fibers) muscles, and BMMSCs of the experimental mice. D and E: BMMSC expression of FNDC5 using immunofluorescence imaging (white arrow indicates membrane-bound FNDC5 expression). The bar represents the fluorescence intensity of Fndc5 expressed in BMMSCs. F and G: Protein Western blot analysis of FNDC5 in cultured BMMSCs. The bar graph illustrates the relative FNDC5 expression in BMMSCs. H: mRNA transcript expression of Fndc5 in femoral bone tissue. I: ELISA of serum irisin levels. J and K: Representative image of mice and their body weights. L: Glucose tolerance test in mice. M and N: Fasting glucose (M) and glucose levels in the fed state (N) in mice. O and P: Serum insulin and blood HbA1c (%) levels in mice. Experiments were repeated at least three times. Data are expressed as the mean ± SEM. n = 5 samples per group. *P < 0.05 compared with the WT control; #P < 0.05 compared with the T2DM group; @P < 0.05 compared with the T2DM group. The error bars represent the SEM.
Figure 2
Figure 2
Exercise or recombinant irisin administration suppresses miR-150 expression by inhibiting oxidative damage in diabetic mice. A and B: Total ROS was imaged in BMMSCs using confocal microscopy. C: Measurement of lipid peroxidation level in BMMSCs culture. D: H2O2 production was estimated in BMMSCs culture. E: Glutathione peroxidase (GPx) activity was measured in BMMSCs. F: Heat map showing differentially expressed miRNAs in femoral BMMSCs assessed by miRNA PCR array. G: qPCR validation of miR-150 and miR-31-5p in BMMSCs. H: Effect of NAC and anti–miR-150 inhibitor on miR-150 expression in cultured BMMSCs. I: In silico analysis of the miR-150 binding site in the Fndc5 3′-UTR. J: Luciferase activity was tested in BMMSCs. K: qPCR analysis of Fndc5 mRNA expression. Experiments were repeated at least three times. Data are expressed as the mean ± SEM. n = 5 samples per group. *P < 0.05 compared with the WT control; #P < 0.05 compared with the T2DM group. The error bars represent the SEM. CM-H2DCFDA (General Oxidative Stress Indicator) is a dye to detect the ROS in cultured cells. More information can be found in RESEARCH DESIGN AND METHODS, but is presented here in short form, DCFDA.
Figure 3
Figure 3
Exercise or pyroptosis inhibitor administration exacerbates the central pyroptosis response under diabetes conditions in vivo and in vitro. A: The expression of NLRP3, GSDMD, caspase-1, and caspase-3 was detected with Western blot analysis. B and C: The bar graph represents the quantification of A. D and E: Caspase 1 and caspase 3 activity was measured in BMMSC lysates. F and G: BMMSCs pyroptosis were tested with flow cytometry after staining with caspase 1–FITC and PI. The bar graph represents the quantification of F. H: ELISA of IL-1β and IL-18 in cultured BMMSCs. Experiments were repeated at least three times. Data are expressed as the mean ± SEM. n = 5 samples per group. *P < 0.05 compared with WT control; #P < 0.05 compared with the T2DM group. The error bars represent the SEM. NS, not significant.
Figure 4
Figure 4
Exercise or direct irisin administration restores osteogenesis in diabetic mice. A: BMMSC proliferation was assessed by MTT assay. B and C: ALP activity (B) and bone calcium nodule formation assay on day 21 by ARS in BMMSC culture (C). E and F: Western blot analysis of the osteogenic proteins RunX2 and OCN. G and H: ELISA of the bone formation marker, P1NP level, and osteocalcin was measured in BMMSCs. Experiments were repeated three times. Data are expressed as mean ± SEM. n = 5–6 mice per group. *P < 0.05 compared with WT control; #P < 0.05 compared with T2DM mice; @P < 0.05 compared with T2DM+EX mice. The error bars represent the SEM. A.U, arbitrary units; MTT, 3-(4, 5-dimethylthiazolyl-2)-2, 5-diphenyltetrazolium bromide; PNPP, p-nitrophenyl phosphate.
Figure 5
Figure 5
Exercise or neutralizing antibodies against pyroptosis attenuate osteoclastogenesis via a paracrine mechanism in vitro. A: Ex- perimental strategy for the in vitro induction of osteoclastogenesis following CM treatment derived from BMMSC culture. B and C: TRAP staining of mature osteoclasts at day 4. The bar graph represents the total number of TRAP1 osteoclasts. D: ELISA of TRAP-5b activity was measured in osteoclastic lysates. E and F: qPCR analysis of osteoclastic genes (Nfatc1, Ctsk, Rank, Oc-Stamp). G and I: Phase contrast microscopy of bone resorption and pit formation in vitro. Scale bar: 200 µm. The bar graphs depict the fluorescence intensity of the conditioned medium (H) and resorption pit formation area (I). Experiments were repeated three times. Data are expressed as the mean ± SEM. n = 5 mice per group. *P < 0.05 compared with WT control; #P < 0.05 compared with T2DM. The error bars represent the SEM.
Figure 6
Figure 6
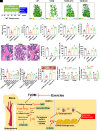
Exercise or miR-150 silencing restores bone mass in vivo. A: EX and caspase-1 inhibitor, AYC were administered independently to the experimental mice for 8 weeks. At the end of the treatment, the samples were harvested for endpoint experiments. B: Representative micro-CT images of distal femurs in the various experimental mice. C–G: The bone phenotype parameters BMD, BV/TV (%), Tb. N (1/mm), and Tb. Th (mm), and Tb. Sp was quantified. H and I: Hematoxylin-eosin staining of the trabecular bone volume of the femur. J and K: Femoral cortical bone mechanical quality (ultimate load (J) and stiffness (K) was tested with a 3-point bending test. L and M: Bone turnover markers (CTX (L) and P1NP (M)) were measured in the serum of experimental mice. N: ARS staining of BMMSC cultures was measured on day 21. O and P: qPCR analysis of osteogenic marker genes (Runx2, Bglap, Osx, and Col1a). Q: The proposed hypothesis of EX-induced skeletal irisin prevented T2DM-induced osteoporosis through the regulation of the miR-150-FNDC5/pyroptosis axis. OB, osteoblast. Experiments were repeated three times. Data are expressed as the mean ± SEM. n = 5 mice per group. *P < 0.05 compared with the WT control, #P < 0.05 compared with the T2DM group.

Comment in

References

    1. American Diabetes Association . Diagnosis and classification of diabetes mellitus. In Clinical Practice Recommendations. Diabetes Care 2013;36(Suppl. 1):S67–S74 - PMC - PubMed
    1. Sami W, Ansari T, Butt NS, Hamid MRA. Effect of diet on type 2 diabetes mellitus: a review. Int J Health Sci (Qassim) 2017;11:65–71 - PMC - PubMed
    1. Chen L, Magliano DJ, Zimmet PZ. The worldwide epidemiology of type 2 diabetes mellitus--present and future perspectives. Nat Rev Endocrinol 2011;8:228–236 - PubMed
    1. Forbes JM, Cooper ME. Mechanisms of diabetic complications. Physiol Rev 2013;93:137–188 - PubMed
    1. Deshpande AD, Harris-Hayes M, Schootman M. Epidemiology of diabetes and diabetes-related complications. Phys Ther 2008;88:1254–1264 - PMC - PubMed

Publication types

MeSH terms