. 2023 Jan;72(1):265-273.
doi: 10.1007/s00262-022-03244-y. Epub 2022 Jul 8.

High salt diet does not impact the development of acute myeloid leukemia in mice

Affiliations

High salt diet does not impact the development of acute myeloid leukemia in mice

Mathangi Janakiraman et al. Cancer Immunol Immunother. 2023 Jan.

Abstract

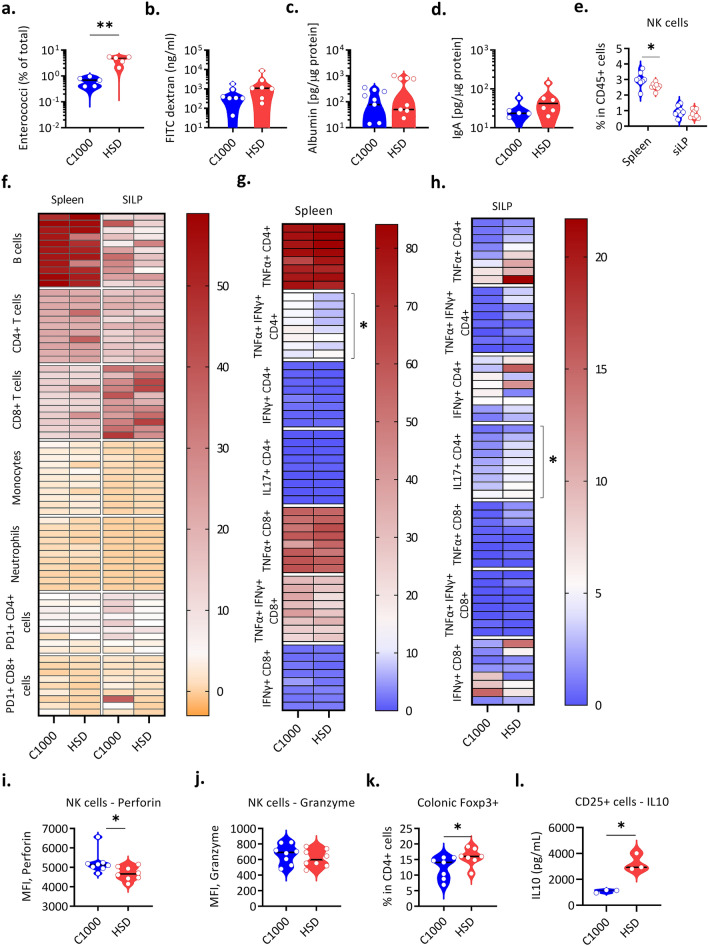
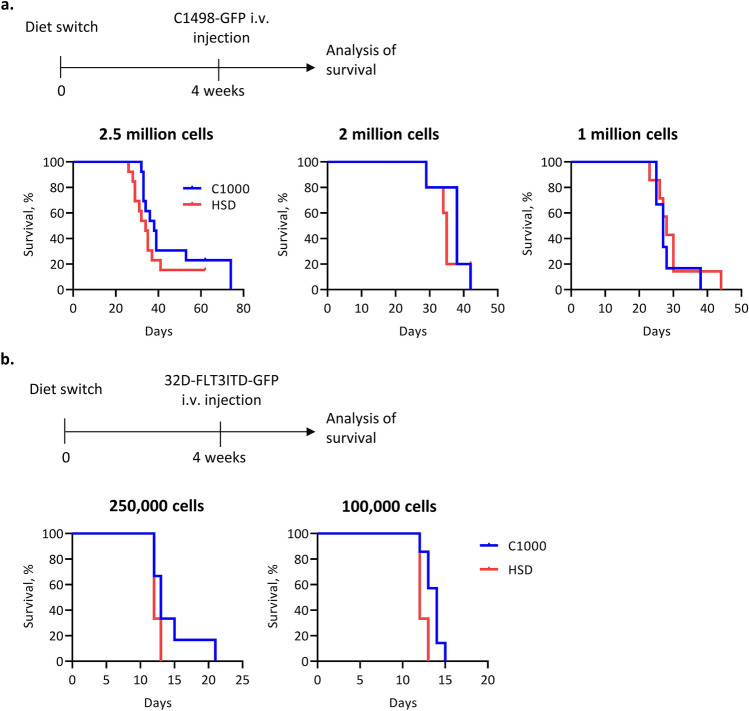
The gut microbiota has not only been implicated in the development of some cancers but has also been shown to modulate the efficacy of cancer therapeutics. Although the microbiota is an attractive target in cancer therapy, there is limited data available regarding the relevance of microbiota and dietary interventions in the various types of tumors. Recently, a high salt diet (HSD) has attracted attention in cancer development owing to its profound effects on modulating microbiota and immune responses. Here, we investigated the impact of HSD on microbiota, immune responses, and the development of acute myeloid leukemia using two syngeneic transplantation models. HSD significantly changes the microbiota composition, TH17 responses, and NK cells. However, we found no influence of HSD on tumor development. The kinetics and characteristics of tumor development were similar despite varying the number of injected tumor cells. Our data show that the effects of the microbiome and dietary interventions can be tumor-specific and may not apply to all types of cancers.

Keywords: Acute myeloid leukemia; High salt diet; Microbiota; Tumor immunology.


Conflict of interest statement

The authors declare no competing financial interests.

Figures

Fig. 1
Fig. 1
HSD-induced alterations in the intestine and immune cell populations. (al) WT C57BL/6 mice were weaned onto C1000 or HSD and fecal content, sera, and organs were collected 3–4 weeks after the diet switch. a 16 s rRNA qPCR analysis of fecal DNA with Enterococci specific primers represented as a percentage of total microbiota (C1000 n = 5, HSD n = 5). **P = 0.0079 (Mann Whitney’s U test). Each circle represents an individual mouse. b FITC-Dextran levels in the sera of C57BL/6 mice fed C1000 (n = 7) and HSD (n = 7). 3–4 weeks after the diet switch, mice were gavaged FITC-dextran and sera was collected after 4 h. Each circle represents an individual mouse. c Fecal albumin levels in WT C57BL/6 mice fed C1000 (n = 8) and HSD (n = 8), quantified by ELISA and normalized to total protein levels. Each circle represents an individual mouse. d Fecal IgA levels in C57BL/6 mice fed C1000 (n = 5) and HSD (n = 6), quantified by ELISA and normalized to total protein levels. Each circle represents an individual mouse. e The frequencies of NK cells (expressed as % of CD45+ cells), were obtained by flow cytometry analysis in the spleen and small intestine lamina propria (siLP) of C57BL/6 mice fed with C1000 (n = 8) and HSD (n = 8). *P = 0.0206 (Mann Whitney’s U test). Each circle represents an individual mouse. Data from 2 individual experiments are pooled. f Heatmap showing the frequencies (% of CD45+ cells) of various immune cell subsets obtained by flow cytometry analysis in the spleen and siLP of C57BL/6 mice fed with C1000 (n = 9–11) and HSD (n = 9–11). Data from 3 individual experiments are pooled. g Heatmap showing the frequencies (% of CD4+ or CD8+ T cells) of various cytokine-producing T cell subsets obtained by flow cytometry analysis in the spleen of C57BL/6 mice fed with C1000 (n = 8–9) and HSD (n = 8–9). *P = 0.0351 (Mann Whitney’s U test). Data from 2 individual experiments are pooled. h Heatmap showing the frequencies (% of CD4+ or CD8+ T cells) of various cytokine-producing T cell subsets obtained by flow cytometry analysis in the siLP of C57BL/6 mice fed with C1000 (n = 8–9) and HSD (n = 8–9). *P = 0.0315 (Mann Whitney’s U test). Data from 2 individual experiments are pooled. i The mean fluorescence intensity (MFI) of Perforins in splenic NK cells, obtained by flow cytometry analysis of C57BL/6 mice fed with C1000 (n = 8) and HSD (n = 8). *P = 0.0147 (Mann Whitney’s U test). Each circle represents an individual mouse. Data from 2 individual experiments are pooled. j The mean fluorescence intensity of Granzyme in splenic NK cells, obtained by flow cytometry analysis in C57BL/6 mice fed with C1000 (n = 8) and HSD (n = 8). Each circle represents an individual mouse. Data from 2 individual experiments are pooled. k The frequencies of Foxp3+ cells in the colonic lamina propria (% of CD4+ T cells) of WT C57BL/6 mice fed C1000 (n = 7) and HSD (n = 7), obtained by flow cytometry analysis. *P = 0.0291 (Mann Whitney’s U test). Each circle represents an individual mouse. Data from 2 individual experiments are pooled. l IL-10 levels in lymph node Treg cells isolated from C57BL/6 mice 3–4 weeks after diet switch and cultured in the presence of anti-CD3 and anti-CD28. CD4+ CD25+ cells were sorted from the lymph nodes of C1000 (n = 3) and HSD (n = 3) -fed mice. *P = 0.0270 (T-test with Welch’s correction). Each circle represents a pool of 2 mice. One representative experiment out of 2 experiments performed is shown. All data is represented as a distribution with the black line indicating the median
Fig. 2
Fig. 2
HSD does not alter AML progression. a Experimental plan (top) and survival plots (bottom) for AML progression in C57BL/6 mice fed C1000 or HSD. Mice were fed the respective diets for 4 weeks after which different numbers of C1498-GFP cells were injected i.v. n = 5–13 mice per group. b Experimental plan (top) and survival plots (bottom) for AML progression in WT C3H/HeJ mice fed C1000 or HSD. Mice were fed the respective diets for 4 weeks after which different numbers of 32D-FLT3ITD-GFP cells were injected i.v. n = 6–7 mice per group

References

    1. Döhner H, Weisdorf DJ, Bloomfield CD. Acute myeloid leukemia. N Engl J Med. 2015;373:1136–1152. doi: 10.1056/NEJMra1406184. - DOI - PubMed
    1. Tettamanti S, Pievani A, Biondi A, Dotti G, Serafini M. Catch me if you can: how AML and its niche escape immunotherapy. Leukemia. 2021;36:13–22. doi: 10.1038/s41375-021-01350-x. - DOI - PMC - PubMed
    1. Zitvogel L, Ayyoub M, Routy B, Kroemer G. Microbiome and anticancer immunosurveillance. Cell. 2016;165:276–287. doi: 10.1016/j.cell.2016.03.001. - DOI - PubMed
    1. Masetti R, Muratore E, Leardini D, Zama D, Turroni S, Brigidi P, Esposito S, Pession A. Gut microbiome in pediatric acute leukemia: from predisposition to cure. Blood Adv. 2021;5:4619–4629. doi: 10.1182/bloodadvances.2021005129. - DOI - PMC - PubMed
    1. Rashidi A, Ebadi M, Rehman TU, et al. Lasting shift in the gut microbiota in patients with acute myeloid leukemia. Blood Adv. 2022;6:3451. doi: 10.1182/bloodadvances.2021006783. - DOI - PMC - PubMed