. 2023 Mar 10;33(6):2857-2878.
doi: 10.1093/cercor/bhac246.

Strong and reliable synaptic communication between pyramidal neurons in adult human cerebral cortex

Affiliations

Strong and reliable synaptic communication between pyramidal neurons in adult human cerebral cortex

Sarah Hunt et al. Cereb Cortex. .

Abstract

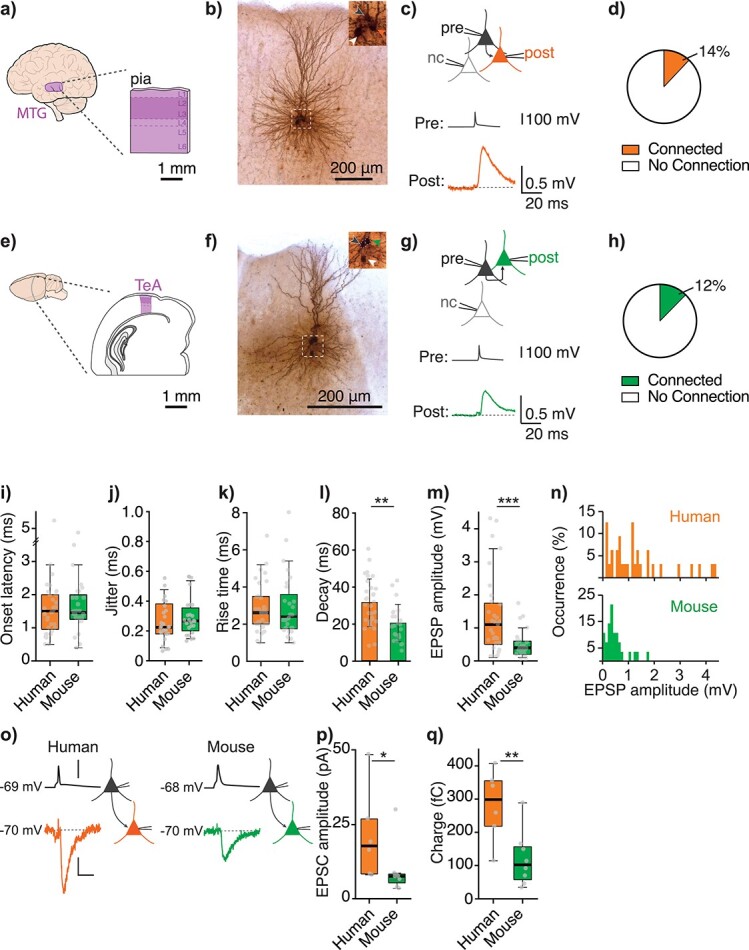
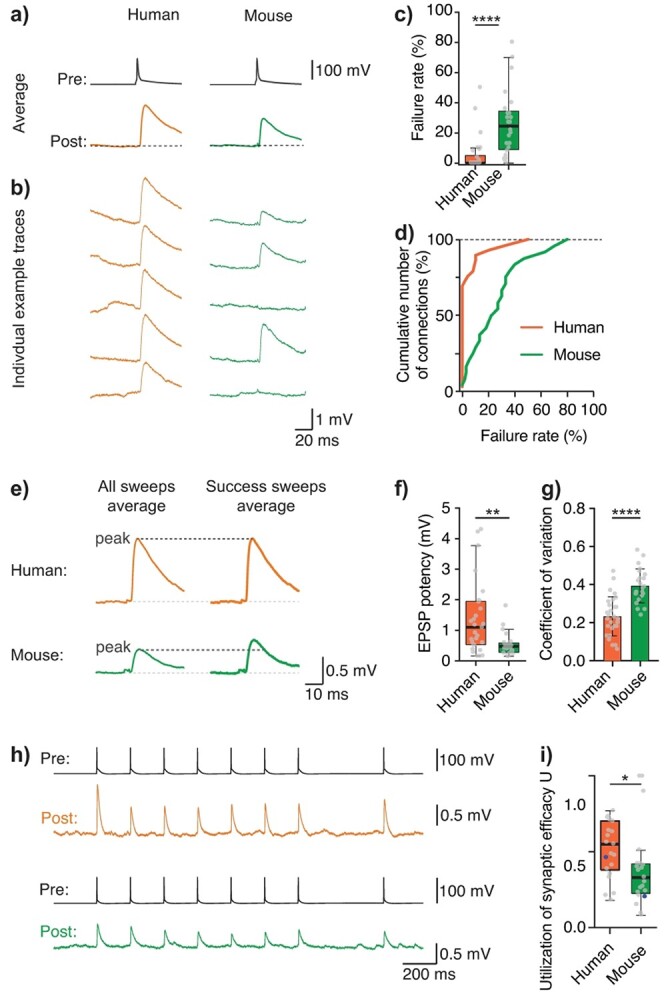
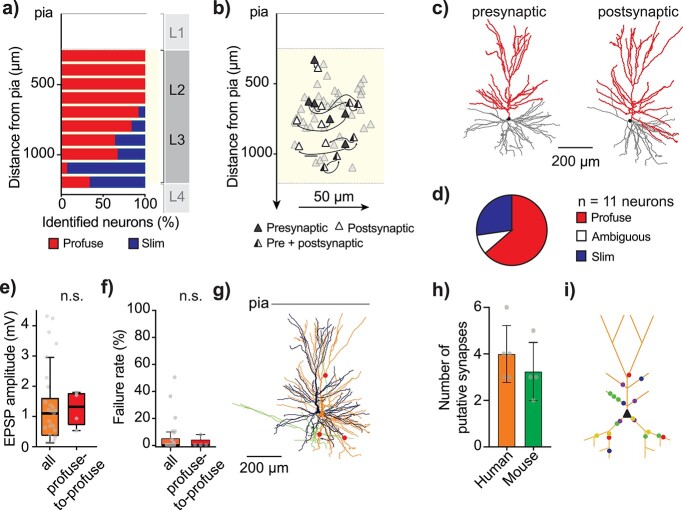
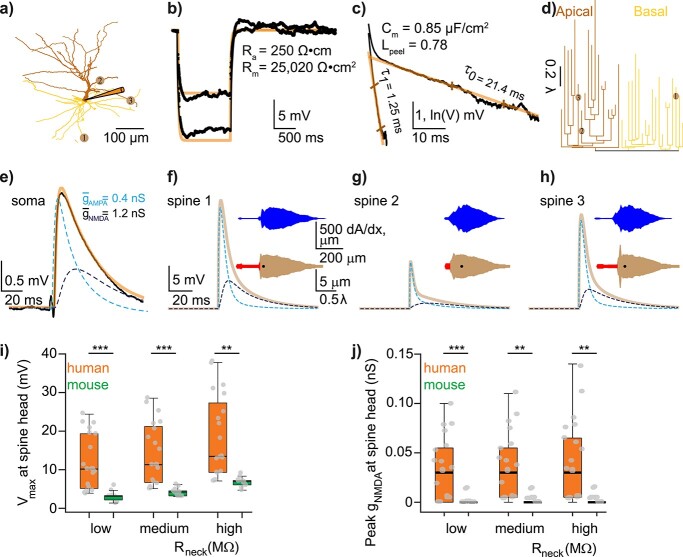
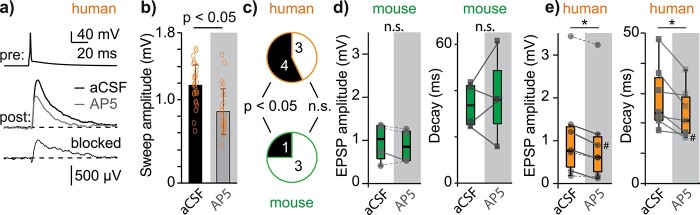
Synaptic transmission constitutes the primary mode of communication between neurons. It is extensively studied in rodent but not human neocortex. We characterized synaptic transmission between pyramidal neurons in layers 2 and 3 using neurosurgically resected human middle temporal gyrus (MTG, Brodmann area 21), which is part of the distributed language circuitry. We find that local connectivity is comparable with mouse layer 2/3 connections in the anatomical homologue (temporal association area), but synaptic connections in human are 3-fold stronger and more reliable (0% vs 25% failure rates, respectively). We developed a theoretical approach to quantify properties of spinous synapses showing that synaptic conductance and voltage change in human dendritic spines are 3-4-folds larger compared with mouse, leading to significant NMDA receptor activation in human unitary connections. This model prediction was validated experimentally by showing that NMDA receptor activation increases the amplitude and prolongs decay of unitary excitatory postsynaptic potentials in human but not in mouse connections. Since NMDA-dependent recurrent excitation facilitates persistent activity (supporting working memory), our data uncovers cortical microcircuit properties in human that may contribute to language processing in MTG.

Keywords: L2/L3; NMDA receptor; cortex; human brain; synaptic transmission.


Figures

Fig. 1
Fig. 1
Local pyramidal-to-pyramidal connections in human MTG are larger in amplitude compared with mouse temporal association area. a) Slice configuration of resected human MTG. b) Example image of recovered cluster of connected human pyramidal neurons. Inset shows a close up of somas with arrowheads indicating the pre- (black) and postsynaptic (orange) somas, as well as a third soma of an unconnected neuron (white). c) Top schematic image depicts the recording configuration of the same cluster of neurons as in b) (pre: presynaptic, post: postsynaptic, and nc: no connection). Below example traces are the averaged traces from this cluster showing the evoked action potential in the presynaptic neuron (black trace) and the resulting EPSP in the connected postsynaptic neuron (orange). d) Pie graph showing connection rate in human for 157 tested pairs of neurons (14%, 25 of 185 tested pairs were connected). Only connections where we also stored the corresponding number of “no connection” tested pairs during the experimental session were counted for this analysis. e–h) Show the same as above but in mouse temporal association area (TeA). Postsynaptic neurons are represented in green (f–h) and mouse connection rate shown in h) was 12% (n = 28 of 234 tested pairs of neurons, P = 0.7, Fisher’s exact test). i) Average onset latency (P = 0.6, Mann–Whitney test). j) Average onset latency jitter (P = 0.3, Mann–Whitney test), dotted line indicates cut-off jitter for monosynaptic EPSPs (Lalanne et al. 2016). k) Median rise time (P = 0.7, Mann–Whitney test). l) Mean decay time constant (P < 0.01, unpaired t-test). m) n median amplitude (P < 0.001, Mann–Whitney test) of EPSPs in human (orange) and mouse (green). o) Schematic images and example traces of human and mouse connections in voltage clamp with presynaptic neurons and their traces depicted in black and postsynaptic neurons and their traces in orange (human) or green (mouse). Membrane potential values at the left of each trace correspond to the resting membrane potential for presynaptic traces and the holding potential for postsynaptic traces. Scalebars 100 mV, 5pA, and 10 ms. p) Median amplitude of excitatory postsynaptic currents (EPSC, P = 0.03, Mann–Whitney test). q) Median response charge (P = 0.008, Mann–Whitney test). Boxplots in Fig. 1 (and Figs. 2–4 and Supplemental Figures) show median as central mark, the edges of the box the 25th and 75th percentiles, the whiskers extend to the most extreme data points, and the outliers are plotted individually.
Fig. 2
Fig. 2
Human local pyramidal-to-pyramidal connections are reliable. a) Example connections show average presynaptic AP and postsynaptic EPSP traces for human (orange) and mouse (green). b) Traces correspond to example individual traces from those same connections. c) Median failure rates (P < 0.0001, Mann–Whitney test). d) Cumulative distribution of failure rates for human and mouse. e) Example average traces for all traces, including failed events (left) and only counting success sweeps (right) show that EPSP amplitude of “success-only” traces (i.e. EPSP potency) was still larger in human. f) Median EPSP potency (P < 0.01, Mann–Whitney test). g) Mean c.v. was significantly larger in mouse connections (P < 0.0001, unpaired t-test). h) Example traces for human (top, presynaptic trace in black, postsynaptic trace in orange) and mouse (bottom, presynaptic trace in black, postsynaptic trace in green) of postsynaptic responses to a 5 Hz train and recovery pulse of presynaptic action potentials. i) Median utilization of synaptic efficacy, U (P < 0.05, Mann–Whitney test), blue datapoints correspond to the example connections shown in h).
Fig. 3
Fig. 3
Morphological and anatomical analysis of local connections in L2/L3 of human MTG. a) Distribution of identified single neurons throughout L2/L3 of human MTG [total of 87 identified single neurons of which 60 were already identified for a previous study (Deitcher et al. 2017) and 27 were newly identified here], with profuse-tufted neurons (n = 58 neurons) in red and slim-tufted neurons (n = 29 neurons) in blue. b) Distribution within L2/L3 of recorded clusters where soma-pia distances were recorded through microdrive coordinates. X-axis distance between neurons of the same cluster is true to scale but X-axis distance between clusters is not and has been randomly chosen for clarity. c) Example morphological reconstruction (soma and apical dendrites in red, basal dendrites in gray) of 2 connected neurons (left: presynaptic, right: postsynaptic neuron). d) Pie graph showing number of identified neurons per cell-type (8 profuse-tufted neurons and 2 “ambiguous” type neurons, forming 4 profuse-to-profuse and 2 ambiguous-to-profuse type connections). e) Median EPSP amplitude of identified profuse-to-profuse connections relative to the full population of this study (excluding the identified profuse-profuse connections). f) Median fail rate of identified profuse-to-profuse connections relative to the full population of this study (excluding the identified profuse-profuse connections). g) Reconstructed connected pair of neurons from Fig. 1 (presynaptic neuron in black with axon in green, postsynaptic neuron in orange and putative synapse locations in red). Images of putative synapses for this connection in Fig. S6. h) Human presynaptic neurons formed on average 4.0 ± 1.2 putative synapses (n = 5 connections) onto their postsynaptic neuron comparable with mouse average number of putative synapses: 3.2 ± 1.1, (n = 4 connections). i) Schematic postsynaptic neuron depicting locations of all putative synapses from 5 distinct connections in L2/L3 human MTG. Putative synapses were located in basal dendrites and proximal apical dendrites (total mean distance from soma: 147 ± 54 μm) and were at similar dendritic distances to mouse (mouse total mean dendritic distance to soma: 141 ± 26 μm).
Fig. 4
Fig. 4
Properties of human L2/3–L2/3 synapses extracted via matching detailed neuron model to experimental pair-recordings. a) Modeled human L2/L3 neuron with dendritic locations of 3 synaptic contacts (numbered circles) originating from a single presynaptic L2/L3 neuron. Apical and basal trees are marked in dark and light orange respectively, schematic electrode at soma is also shown. b) Somatic voltage response (black traces) for the neuron shown in a) to 2 steady hyperpolarizing current inputs (here, −62 and −108 pA) and the corresponding model fit (brown traces) with respective model values for Ra and Rm. c) “Peeling” of somatic voltage transient in response to a brief (2 ms) hyperpolarizing step current (not shown) in the neuron shown in a). τ0, extracted from this peeling, together with Rm as in b), are used to calculate Cm, whereas Lpeel value is computed from τ1 and τ0 (see Methods). d) Electrotonic dendrograms of the neuron shown in a, with locations of the three synaptic contacts. e) Experimental somatic EPSP (black trace) in response to a presynaptic spike with model fit superimposed (light brown). Synapses were activated on modeled dendritic spines (see Supplemental Fig. S9 and Methods). AMPA- and NMDA- components of the modeled EPSP are also shown (dashed lines) with their respective maximal conductances value (at each synaptic contact). The NMDA-component is calculated by subtracting the AMPA component of the EPSP from the AMPA- plus NMDA-based EPSP. f–g) Computed EPSPs and respective AMPA- and NMDA-components at the spine head membrane located at the three synaptic sites shown in a). The upper (blue) and lower (red/brown) insets show, respectively, the spatial distribution of the neuron’s membrane area a) as a function of the physical distance, x, from the spine and the “equivalent cable” as seen from the spine perspective (spine is located at left end of these insets, soma location is marked by the black dot, see Methods). Observing the “equivalent cable” insets, the electrotonic decoupling of spine #1 and #3 from the impedance load due to the respective red cable (at the left of inset) results in relatively large EPSPs at these spines, whereas the large impedance load that is adjacent to spine #2 results in a relatively small EPSP at this spine. i) Computed EPSP peak at the spine head membrane for human (orange) and mouse (green) connections for different spine-neck resistances (Rneck). Low: Rneck human: 68.8 MΩ, Rneck mouse: 37.2 MΩ (these values were computed with spine dimensions as in Supplemental Table S2 and Ra = 250 Ω cm), medium: 200 MΩ for both human and mouse and high: 500 MΩ, for human and mouse respectively. Note that EPSP peak at the spine head membrane remains significantly larger in human also for a Rneck of 200 MΩ and 500 MΩ. j) as in i), now showing the NMDA peak conductance for each individual spine head for different Rneck cases. Low: Rneck human: 68.8 MΩ, Rneck mouse: 37.2 MΩ. Medium: 200 MΩ and high: 500 MΩ, respectively.
Fig. 5
Fig. 5
NMDA receptor activation contributes to unitary EPSPs in human but not in mouse connections. a) Example average traces for a pyramidal-to-pyramidal connection in L2/L3 human MTG. Pre: presynaptic neuron; post: postsynaptic neuron. Control EPSP in black (aCSF), EPSP after application of NMDA receptor blocker AP5 (50 μM) in gray. The depolarization blocked by AP5 is labeled “blocked” and generated by subtracting the AP5 EPSP from the aCSF EPSP. b) Single sweep amplitude during aCSF (black) and AP5 (gray) conditions for the example connection from I1 (P < 0.05, Mann–Whitney test). c) In human, 4 out of 7 connections showed a significant reduction of EPSP amplitude upon AP5 application and in mouse, 1 out of 4 connections, respectively. d) Effect of AP5 on EPSP amplitude (left) and decay (right) in mouse. e) Effect of AP5 on EPSP amplitude (left, n = 7, P < 0.05, Wilcoxon, signed-rank test) and EPSP decay (right, n = 7, P < 0.05, Wilcoxon, signed-rank test) for human unitary connections. # Denotes example from Fig. 5a and b. Note that AP5 has inconsistent effect on mouse EPSP amplitude and decay (n = 4) but consistently reduces EPSP amplitude and decay kinetics for individual human unitary connections (n = 7).

References

    1. Adler CM, Goldberg TE, Malhotra AK, Pickar D, Breier A. Effects of ketamine on thought disorder, working memory, and semantic memory in healthy volunteers. Biol Psychiatry. 1998:43:811–816. - PubMed
    1. Assaf Y, Bouznach A, Zomet O, Marom A, Yovel Y. Conservation of brain connectivity and wiring across the mammalian class. Nat Neurosci. 2020:23:805–808. - PubMed
    1. Bakken TE, Jorstad NL, Hu Q, Lake BB, Tian W, Kalmbach BE, Lein ES. Comparative cellular analysis of motor cortex in human, marmoset and mouse. Nature. 2021:598:111–119. - PMC - PubMed
    1. Barros-Zulaica N, Rahmon J, Chindemi G, Perin R, Markram H, Muller E, Ramaswamy S. Estimating the readily-releasable vesicle Pool size at synaptic connections in the neocortex. Front Synaptic Neurosci. 2019:11. - PMC - PubMed
    1. Barth AL, Poulet JF. Experimental evidence for sparse firing in the neocortex. Trends Neurosci. 2012:35:345–355. - PubMed

Publication types

Substances