. 2022 Jul 8;17(7):e0268351.
doi: 10.1371/journal.pone.0268351. eCollection 2022.

Horizontal connectivity in V1: Prediction of coherence in contour and motion integration

Affiliations

Horizontal connectivity in V1: Prediction of coherence in contour and motion integration

Benoit Le Bec et al. PLoS One. .

Abstract

This study demonstrates the functional importance of the Surround context relayed laterally in V1 by the horizontal connectivity, in controlling the latency and the gain of the cortical response to the feedforward visual drive. We report here four main findings: 1) a centripetal apparent motion sequence results in a shortening of the spiking latency of V1 cells, when the orientation of the local inducer and the global motion axis are both co-aligned with the RF orientation preference; 2) this contextual effects grows with visual flow speed, peaking at 150-250°/s when it matches the propagation speed of horizontal connectivity (0.15-0.25 mm/ms); 3) For this speed range, the axial sensitivity of V1 cells is tilted by 90° to become co-aligned with the orientation preference axis; 4) the strength of modulation by the surround context correlates with the spatiotemporal coherence of the apparent motion flow. Our results suggest an internally-generated binding process, linking local (orientation /position) and global (motion/direction) features as early as V1. This long-range diffusion process constitutes a plausible substrate in V1 of the human psychophysical bias in speed estimation for collinear motion. Since it is demonstrated in the anesthetized cat, this novel form of contextual control of the cortical gain and phase is a built-in property in V1, whose expression does not require behavioral attention and top-down control from higher cortical areas. We propose that horizontal connectivity participates in the propagation of an internal "prediction" wave, shaped by visual experience, which links contour co-alignment and global axial motion at an apparent speed in the range of saccade-like eye movements.


Conflict of interest statement

The authors have declared that no competing interests exist.

Figures

Fig 1
Fig 1. Working hypothesis and visual stimulation protocols.
(A): Working Hypothesis: the AM sequence is designed so as to synchronize the synaptic activation time of horizontal volleys, evoked by the sequential presentation of 2 to 5 Gabor patches (GP) in the Surround, with the feedforward activation of the RF Center (shaded rectangle in the D0 position). The Surround GPs, regularly spaced from “Far” (D5) to “Near” (D1) periphery along the apparent motion path (horizontal axis), are flashed in succession at high contrast. The test reference GP, terminating the AM sequence, is flashed at low/medium contrast in the RF center (D0). Each orange arrow represents the lateral propagation of the presynaptic volley elicited by each distal GP. Other synaptic recruitment paths potentially also contribute also to Surround-Center modulation, in particular cascades of proximal neighbor-to-neighbor links (grey arrows). (B) “Cardinal” Protocol: the two columns illustrate the exploration of the two cardinal axes (horizontal for the RF orientation preference; vertical for the RF width axis) with 2 or 3-stroke AM sequences of ISO-oriented stimuli (“collinear”, first row; “parallel”, second row) or CROSS-oriented stimuli (two bottom rows, same motion paths but the local inducer orientation is now orthogonal to the RF orientation preference). (C): “Radial” Protocol: the two columns illustrate the various AM flow patterns (individual rows), either funnelled along a given motion axis (SECTOR, left), radially contracting (CP: centripetal) or expanding (CF:centrifugal), or across the full Surround (FULL, right). In the SECTOR condition, two opposite motion axes are symmetrically explored, aligned either with the RF orientation preference (horizontal axis (± 30°) in rows 1, 2 and 4) or with its width axis (vertical axis (± 30°), row 3). In the FULL condition, all directional motion axes (discretized by 30° steps) are stimulated concurrently and intersect the RF center (horizontal grey icon). From top to bottom, each row illustrates one specific configuration of AM flow: 1) centripetal collinear flow (CP-ISO) from Surround to Center (red, 1st row); 2) centrifugal collinear flow (CF-ISO) from Center to Surround (green, 2nd row), 3) centripetal cross-oriented flow (CP-CROSS) across the RF width axis (gold, 3rd row); 4) randomized collinear pattern (RND-ISO) where each successive GP location has been randomized in space and time (blue, bottom row). Note that in all the conditions other than CF-ISO, the last GP of the sequence is flashed with the optimal orientation in the RF center (D0). See Text for details.
Fig 2
Fig 2. A synaptic view of visual V1 receptive fields.
(A): Latency basin of synaptic responses relative to the RF Center: Top left, spatial maps of the ON- and OFF- Depolarizing Fields latencies using sparse noise (SN) mapping. Heat scale: color code for latency values (from 0 (black) to 200 ms (yellow)). Bottom left, 1D-mapping of ON- and OFF- PSP responses in the same cell, evoked by long bars (7.1° x 0.7°) flashed at the optimal orientation and positioned at different eccentricities (ordinates, ranging from -4° (bottom) to +6° (top)) across the RF width axis. Thick boxes (along the left ordinate axis) designate the positions which are in overlap with the SRF mapping using SN (above, top left). Red (ON) and blue (OFF) linear regressions illustrate the 1D-latency basin profiles of Surround-Only subthreshold responses. The linear fits of latency versus eccentricity give apparent horizontal speeds of propagation estimates of 0.18–0.38 mm/ms for ON- (red, left) and OFF- (blue, right) responses. (B) Dependency on spatial summation (adapted from [26]): From top to bottom, phase-reversal (2 Hz) responses to disk (1) and annular gratings (2 & 3), for increasing inner border eccentricities from the RF center (5.6° in (2) and 10.3° in (3)). Note the decay in response strength and the increase of onset latency in Surround-Only responses (2 & 3) with eccentricity (reaching 32 ms for the “Far” Surround annulus). (C) Apparent Speed of Horizontal Propagation (ASHP) distribution: Stacked data histograms from [26] using long bars (1D-mapping, blue) or sparse noise (green), and from this study (Gabor patch maping, light green). Note that, independently of the probe stimulus, most AHSP values inferred from Surround latency basin slopes range between 0.05 and 0.60 mm/ms.
Fig 3
Fig 3. Spatio-temporal and axial selectivity of “Surround-Only” responses to centripetal AM flow.
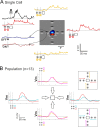
(A) Single Cell example: Central inset cartoon: ON and OFF discharge fields, respectively in red and blue. White contour delineates the subthreshold receptive field (SRF). For comparison, respective positions of the Gabor inducer stimuli flashed in the surround are overlaid on the RF map. Two-stroke “Surround-Only” AM responses: comparison of “collinear” (red) and “parallel” (gold) responses evoked respectively along the orientation preference axis and across the width axis of the RF, with the Center-only response (black waveform). Bottom left corner, Vm subthreshold responses for sparse noise (ON (dark red) and OFF (dark blue) waveforms). (B) Dependency of Surround-Only responses on the orientation of the inducer: Right, top and bottom panels illustrate the Gabor inducer features and the color codes for the motion axis explored respectively in the ISO-and CROSS-configurations. The color code conventions are: ISO-RF: red for “collinear” along the orientation preference axis; gold for “parallel” across the RF width axis; CROSS-RF: cyan for “parallel” across the orientation preference axis; magenta for “collinear” along the RF width axis. See Text for details.
Fig 4
Fig 4. Example of contextual modulation of the Center-response by centripetal and centrifugal AM (“cardinal” protocol).
Example of Center-Surround AM responses, compared to the Center-Only condition. The comparison, in the same cell, between centripetal (CP: top panel) and centrifugal (CF: bottom panel) motion flows illustrates the importance of the Surround-then-Center timing in the associative effect. For each configuration, a polar representation of PSTWs (top) and PSTHs (bottom) is shown for the four AM axes. In each central inset, the relative positions of the GP inducers are indicated in relation with the receptive field (rectangle, horizontal for the preferred orientation. The contextual responses are overlaid on the Center-Only stimulation (black). Note that the contextual latency shortening and the spike discharge rate increase of the Center response are observed only in the collinear Centripetal condition (top, red). Color code conventions for AM flow (arrow): CP-ISO-RF: red for centripetal “collinear” along the orientation preference axis; CP-CROSS-RF: gold for centripetal “parallel” across the RF width axis; CF-ISO-RF: green for centrifugal “collinear” along the RF main axis, CF-CROSS-RF: brown for centrifugal “parallel” across the RF width axis. See Text for details.
Fig 5
Fig 5. Differential recruitment of “Near” vs “Far” Surround between the “cardinal” vs. “radial” protocols.
(A): “cardinal” protocol (left panel), and (B): “radial” protocol (right panel). Top row, receptive field maps. Same convention as in Fig 3A. Only the Surround GPs on the RF main (horizontal) and width (vertical) axis (common to both protocols) are represented within the same viewing field (20°x20°). Note the encroachment of the most proximal GPs in the “cardinal” protocol over the SRF (white contour), whereas no spatial overlap is seen in the “radial” protocol. Bottom rows, the CP-ISO (red) and CP-CROSS (gold waveforms) are overlaid for the “Surround-Only” (dotted) and the “Surround-then-Center” (continuous trace) conditions and compared to the “Center-Only” test condition (black). Insets show respectively an expanded version of the PSPs onset on a 30 ms time window (dotted grey rectangle). For each protocol, arrows indicate the change in PSP slope due to the feedforward synaptic drive triggered by the Center test stimulus in the D0 location. Note that the CP-ISO and CP-CROSS (gold) response latencies are the same for the “cardinal” protocol, suggestive of a common non-specific input. In contrast, the phase advance is seen only for the CP-ISO configuration in the “radial” protocol. See Text for details.
Fig 6
Fig 6. “Filling-in” responses evoked by Surround-Only AM (“radial” protocol).
The analysis here is restricted to cells where Surround-Only CP-ISO stimulation evoked a significant response (n = 12, see Text for criteria). Trace color code: black for Center-only, red for Surround-then-Center, dashed red for Surround-Only, dotted green for Surround Linear Predictor (SLP). The left middle horizontal insets respectively show the chronograms of the stroke-by-stroke stimulation sequences for Center-Only (1 stroke, filled black box, upper line), Surround-Then-Center (6 strokes, filled red, middle line) and Surround-Only (5 strokes, filled pale red, bottom line) protocols. Empty boxes indicate omitted stimuli. The time onset of each GP stroke is labeled by a thin dotted vertical line. In this figure and the following ones, the blue dot and vertical dotted blue bar on the y-axis indicate the “threshold” amplitude change of the Center-Only control curve from rest, above which statistical significance of the response is reached (p<0.01) for each individual cell. Their abscissa serves as a reference for the temporal realignment of the different contextual responses. Left: Single cell example. Top left: The confidence intervals (permutation test; 104 repetitions, p<0.01) for Center-Only and Surround-then-Center compared to Blank are represented respectively by gray and pale red envelopes. The complete CP-ISO AM sequence (D5 to D0) evokes a significant facilitation of the Center-Only Vm response. Bottom Left: The red and black curves represent the response averages across trials (shaded area: ± SEM). When omitting the D0 stroke, the recruitment by the CP-ISO AM flow, although limited to the silent surround (D5 to D1), still induces a significant depolarizing activation (Surround-Only: dashed red). The temporal profile of the lateral wave of activity matches the "predicted" invasion of the RF Center (black), had it been stimulated. The build-up of the Surround response during AM departs significantly from the sum of the static responses evoked by each distal GP stroke in isolation (Surround linear predictor (SLP): dashed green, confidence interval of a significant difference between SLP (predicted) and Surround-Only (observed) waveform, p<0.05). Right, top panel: Average response profiles for Surround-then-Center, Center-Only and Surround-Only conditions (n = 12). Right, bottom panel: the CP-ISO Surround-Only response (mean: dotted red ± SEM: shaded area) is compared (with a different ordinate scale than in the top right panel) with the “expectation” (dashed black trace) obtained by subtracting the Center-Only (black trace, top right) from the complete CP-ISO AM response (red trace, Top right).
Fig 7
Fig 7. Statistical significance of contextual response changes.
Color code, same as in Fig 1C, schematized by icons in the middle column. SECTOR configuration: red for CP-ISO, green for CF-ISO, gold for CP-CROSS; dark blue for RND; FULL configuration: pale blue for RND-ISO. (A): Top left panel, ranked amplitude distributions (n = 37) of changes in latency (ms, left column) and in response integral value (normalized ratio, right column) of subthreshold responses (Vm), for each SECTOR AM condition of interest (first three rows). The fourth row corresponds to the FULL-RND condition (see Text for justification). Ordinates: latency shortening and integral response increase are plotted upward. Abscissa: cell rank (1 to 37) ordered independently for each AM condition. Filled bars represent “significant” individual cases (one-sided permutation test, 104 repetitions, p< 0.05). Ordinates: left column, latency change (“Δ Latency”) measured at half-height of the Center-Only peak response; right column, change in the integral value of “significant” depolarizing responses (± 3σ from mean Vrest), integrated to the point of return to baseline of the Center-only test control. The integral value change (“Δ Response“) is expressed as a normalized ratio relative to the Center-Only test response. (B): Bottom left panel, each of the three histograms represents the proportions of significant cases for each AM flow condition. Left, "Δ latency" criteria. Right: “Δ Response”criteria. Center inset (BOTH): all cases showing either a significant latency advance, or response integral increase, or both. (C): Right panel: Bihistogram of the Δ(response_integral) in ordinate vs. Δ(latency_change) in abscissa, averaged across conditions. Numbers and SEM correspond to values calculated across the whole population (upper plot) or restricted to the pool of “significant” cells (lower plot). Note that the global separability between CP-ISO and all other test conditions increases when restricting the pooling to the “significant” cells.
Fig 8
Fig 8. Contextual gain control induced by centripetal-ISO AM flow (“radial” protocol).
Top row, subthreshold response (Vm); Bottom row, firing rate response (spikes/s). The first three columns, from the left illustrate the boosting effect produced by a CP-ISO AM sequence (red curve, Surround-then-Center) when compared to the response to the test GP inducer flashed in the RF Center (black curve, Center-Only). The local orientation of the GP inducers in the Surround and the global AM axis are co-aligned with the RF orientation preference. The last (right) column focuses on contextual dependency of the effect. From left to right, first column: Single cell example, where the vertical dotted gray lines indicate the respective timing of each peripheral stoke stimulation at successive eccentricities (from D5 to D1), whereas the continuous vertical gray line indicates the onset of the “Center-Only” test stimulation (D0). The blue dot and corresponding dotted line give the latency of the first point in time where the Center-Only response departs significantly from the resting state (p < 0.01). Second column from the left, population averages for the CP-ISO (red) and the Center-Only (black) conditions. Averaging is done in two steps, first across trials for each cell for the same context condition, then across cells after realigning individual mean waveforms around a common onset latency, that of their Centre-Only response (“0” mark of the “Relative Time” abscissa, blue points in left panels). Response amplitudes are normalized relatively to the peak of the “Center-Only” response. The third column illustrates the population average profile of individual cells showing either significant positive latency advance, response integral increase, or both, compared to the center-only test control (permutation test, 104 repetitions, p<0.05). The difference in rising phases and onset latencies between the CP-ISO (red) and Center-Only (black) responses are shown on an expanded time basis. The mean ± SEM value envelopes are respectively illustrated by a continuous curve and a shaded area. Right column, the statistical significance analysis is extended to cells which showed significant “Surround-only” responses (subthreshold: n = 20; spiking: n = 10). Color code, same as in Fig 1: For the SECTOR configuration, red for CP-ISO, green for CF-ISO, gold for CP-CROSS. For the FULL configuration, blue for CP-RND-ISO. The contextual averages show that CP-ISO (red) is the only condition where a change in onset latency is observed, both at the Vm (top) and spiking levels.
Fig 9
Fig 9. Mechanistic analysis of the “Filling-in” contribution to contextual gain control.
Left, contextual gain control analysis, restricted to the population of cells (n = 12) showing significant “filling-in” responses. Mean responses, averaged for each AM flow pattern (CP-ISO (red), CF-ISO (light green), CP-CROSS (gold) and RND-ISO (blue)) are represented at the Vm (top panel) and spiking levels (bottom) with their (shaded) S.E.M. envelopes. Same color code as in Fig 1C. The selective latency advance and amplification of the subthreshold response induced specifically by the CP-ISO condition (top, n = 12) translate at the spiking level in cells displaying spiking activity (bottom, n = 7). Right, comparison of the contextual time course of Surround- Only responses with the predicted contribution of the Surround, according to an additive model. Top, observed traces (n = 12); Bottom, linear predictors of the Surround-Only responses obtained by subtracting the “Center- Only” trace from the “Surround-Then-Center” response. The predicted profiles were calculated independently for each contextual condition (same color code). The averaging process was extended to all cells showing a significant contextual change in latency and/or response integral (n = 15, see Text for detailed criteria). The expected occurrence of the response evoked by the omitted Center stimulus is indicated by a grey shaded temporal window. The time abscissa of the peak of the “Center-Only” stimulus response is indicated by a thin vertical bar.
Fig 10
Fig 10. Causal impact of the temporal phase between feedforward and horizontal input on the spiking latency change (“cardinal” protocol).
Left panel: Pooled data from the “radial” (red), and “cardinal” (orange) dynamic AM protocols (this study). Note that most apparent speed of horizontal propagation (ASHP) values, extracted from intracellular latency basin slopes with relative eccentricity, range between 0.05 and 0.60 mm/ms (with a peak between 0.10 and 0.30 mm/ms). Mirror histogram (pointing downwards): pooled data using flashed long bars (1D-mapping, blue), sparse noise mapping (green) from [26), or Gabor patches (light green). Right panel: For each individual cell recorded in the “cardinal” protocol, the latencies of Center-Only and Surround-Only Vm responses are measured and subtracted, defining the temporal phase between the “horizontal” and “feedforward (FF)” inputs. The scatter plot shows the relationship between the input phase and the resulting change in spiking latency of the recorded cell produced by the AM modulation (ordinate axis). Symbols for the centripetal conditions: “x” in gold color (CP-CROSS-parallel) and “+” symbol in red color (CP-ISO-coaligned). Symbols for the centrifugal conditions: “*” brown star (CF-CROSS-parallel) and green diamond (CF-CROSS-coaligned). In grey, bilinear fits. See Text for details. Note a significant reduction in spiking latency when the horizontal input is integrated post-synaptically ahead of the feedforward drive by 5–25 ms (phase advance, rightwards). The scatter plot data are projected on the x-axis (top row) or on the y-axis (right column) as Gaussian kernel density estimators (KDE). The color of each KDE distribution follows the convention of the “cardinal” visual stimulation protocol (Fig 1B).
Fig 11
Fig 11. Dependency of the contextual effect on the speed of the AM flow.
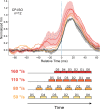
Bottom, the chronograms depict the 4 inter-stroke interval conditions used in each cell to probe the temporal dependency of the interaction between the horizontal and the feedforward synaptic waves (color code reddens with speed value). The exact value of the “optimal” reference speed (100%) is defined on a cell-by-cell basis. Mean speed values, averaged across cells (n = 12), are given left of each chronogram. Top, population averages for the CP-ISO SECTOR condition. All individual responses are realigned with the Center-Only response onset. The color-coded overlaid waveforms, averaged across cells, allow the comparison of the time-course of the response for the optimal speed value (red) and its S.E.M. envelope (shaded red) with that observed for various proportional reductions of the AM flow speed (from top to bottom: 70% (dark orange), 50% (orange) and 30% (light orange)). The contextual response modulation amplitude decreases proportionally to the AM speed reduction from its optimal value.

References

    1. Wertheimer M. Experimentelle Studien über das Sehen von Bewegung. In Zeitchrift für Psychologie und Physiologie der Sinnesorgane, Leipzig. 1912;61:161–265.
    1. Koffka K. Principles of Gestalt psychology. New York: Harcourt; 1935. 720 p.
    1. Groen IIA, Silson EH, Baker CI. Contributions of low- and high-level properties to neural processing of visual scene sin the human brain. Philos Trans R Soc Lond B Biol Sci. 2017;372(1714). - PMC - PubMed
    1. Field DJ, Hayes A, Hess RF. Contour integration by the human visual system: evidence for a local “association field”. Vision Research. 1993;33(2):173–93. doi: 10.1016/0042-6989(93)90156-q - DOI - PubMed
    1. Hess R, Field D. Integration of contours: New insights. Trends in Cognitive Sciences. 1999;3(12):480–6. doi: 10.1016/s1364-6613(99)01410-2 - DOI - PubMed

Publication types