. 2022 Sep 16;82(18):3307-3320.
doi: 10.1158/0008-5472.CAN-21-3899.

PIM2 Expression Induced by Proinflammatory Macrophages Suppresses Immunotherapy Efficacy in Hepatocellular Carcinoma

Affiliations

PIM2 Expression Induced by Proinflammatory Macrophages Suppresses Immunotherapy Efficacy in Hepatocellular Carcinoma

Jun-Cheng Wang et al. Cancer Res. .

Abstract

Cancer immunotherapy restores or enhances the effector function of T cells in the tumor microenvironment, but the efficacy of immunotherapy has been hindered by therapeutic resistance. Here, we identify the proto-oncogene serine/threonine protein kinase PIM2 as a novel negative feedback regulator of IFNγ-elicited tumor inflammation, thus endowing cancer cells with aggressive features. Mechanistically, IL1β derived from IFNγ-polarized tumor macrophages triggered PIM2 expression in cancer cells via the p38 MAPK/Erk and NF-κB signaling pathways. PIM2+ cancer cells generated by proinflammatory macrophages acquired the capability to survive, metastasize, and resist T-cell cytotoxicity and immunotherapy. A therapeutic strategy combining immune checkpoint blockade (ICB) with IL1β blockade or PIM2 kinase inhibition in vivo effectively and successfully elicited tumor regression. These results provide insight into the regulatory and functional features of PIM2+ tumors and suggest that strategies to influence the functional activities of inflammatory cells or PIM2 kinase may improve the efficacy of immunotherapy.

Significance: Cross-talk between T cells and macrophages regulates cancer cell PIM2 expression to promote cancer aggressiveness, revealing translational approaches to improve response to ICB in hepatocellular carcinoma.


Figures

None
Graphical abstract
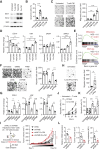
Figure 1. PIM2 heterogeneity reflects the activated immune response of T cells and macrophages in human HCC. A, Gene expression of PIM kinases in nontumor (N, n = 50) and tumor (T, n = 373) tissues from patients with HCC in the TCGA dataset. B, Analysis of PIM2 mRNA expression in 12 pairs of fresh HCC tissues. C, Confocal microscopy analysis of PIM2+ (green) and CD45+ cells (red) in HCC tissue. The proportion of PIM2+ cancer cells was analyzed in the representative region of low and high CD45 expression in each sample (n = 10). Scale bar, 50 μm. D, Volcano plots of the fold change in gene expression in the PIM2high group compared with the PIM2low group based on the TCGA dataset. Patients were divided into 2 groups according to the median value. E, Top 10 biological processes (GO terms) strongly correlated with high PIM2 expression in HCC samples. F, Correlations between PIM2 and CD8A, CD4, CD68, CD15, CD57, and CD138 in the TCGA database. P and R values were calculated on the basis of the analysis of Pearson's correlation. G, IHC analysis of CD3+ and CD68+ cells in serial sections of HCC tissue samples from patients with low (n = 94) and high (n = 47) PIM2 expression. Scale bar, 50 μm. H, GSEA of the inflammatory response signatures and IFNγ response signatures in PIM2high HCC samples versus PIM2low counterparts from the TCGA dataset. Data represent mean ± SEM. *, P < 0.05; **, P < 0.01; and ***, P < 0.001. Unpaired t test with Mann–Whitney U (A, F) or Student t test (B, C).
Figure 1.
PIM2 heterogeneity reflects the activated immune response of T cells and macrophages in human HCC. A, Gene expression of PIM kinases in nontumor (N; n = 50) and tumor (T; n = 373) tissues from patients with HCC in the TCGA dataset. B, Analysis of PIM2 mRNA expression in 12 pairs of fresh HCC tissues. C, Confocal microscopy analysis of PIM2+ (green) and CD45+ cells (red) in HCC tissue. The proportion of PIM2+ cancer cells was analyzed in the representative region of low and high CD45 expression in each sample (n = 10). Scale bar, 50 μm. D, Volcano plots of the fold change in gene expression in the PIM2high group compared with the PIM2low group based on the TCGA dataset. Patients were divided into two groups according to the median value. E, Top 10 biological processes (GO terms) strongly correlated with high PIM2 expression in HCC samples. F, Correlations between PIM2 and CD8A, CD4, CD68, CD15, CD57, and CD138 in the TCGA database. P and R values were calculated on the basis of the analysis of Pearson correlation. G, IHC analysis of CD3+ and CD68+ cells in serial sections of HCC tissue samples from patients with low (n = 94) and high (n = 47) PIM2 expression. Scale bar, 50 μm. H, GSEA of the inflammatory response signatures and IFNγ response signatures in PIM2high HCC samples versus PIM2low counterparts from the TCGA dataset. Data represent mean ± SEM. *, P < 0.05; **, P < 0.01; ***, P < 0.001. Unpaired t test with Mann–Whitney U (A and F) or Student t test (B and C).
Figure 2. IL1β derived from the interaction between T cells and TAM contributes to tumor cell PIM2 expression. A, Mice bearing Hepa1–6 hepatoma were injected with isotype control, anti-CD3, or anti-CSF1R (all 10 mg/kg) Abs every 3 days as indicated. The effects of anti-CSF1R and anti-CD3 on tumor cell PIM2 expression were determined in mouse tumor tissues. Scale bar, 100 μm. B, Huh7 cells were left untreated or were treated with CM from HCC-infiltrating leukocytes (TIL-CM) or macrophages and T cells together (Co-CM) isolated from HCC tumors. PIM2 expression was determined by real-time PCR at the indicated times (n = 3). C, Multiplexed immunofluorescence staining analysis of PIM2+ cells (green), CD3+ cells (red), and CD68+ cells (white) in HCC tissue. The quantity of PIM2+ cancer cells was analyzed (n = 48). Scale bar, 50 μm. (D and E) Huh7 cells were left untreated or were treated with CM from the indicated immune cells isolated from HCC tumors. PIM2 expression was determined by real-time PCR (D) or immunoblotting (E) at 6 hours or 12 hours, respectively (n = 4). F, ELISA analysis of different cytokines in the TSNs and Co-CM (n = 4). G, Relative PIM2 expression in Huh7 cells after exposure to Co-CM or Co-CM–pretreated with blocking Ab for 6 hours (n = 4). (H and I) PIM2 expression in Huh7 cells was determined by real-time PCR (H) or immunoblotting (I) at 6 hours or 12 hours, respectively after treatment with cytokines as indicated (n = 4). J, ELISA analysis of different cytokines in the CM of different immune components (n = 3). Data represent mean ± SEM. *, P < 0.05; **, P < 0.01; ***, P < 0.001; and ****, P < 0.0001. One-way ANOVA with Bonferroni's correction (B, D, G, H, J), two-way ANOVA with Bonferroni's correction (C), or Student t test (F).
Figure 2.
IL1β derived from the interaction between T cells and TAM contributes to tumor cell PIM2 expression. A, Mice bearing Hepa1–6 hepatoma were injected with isotype control, anti-CD3, or anti-CSF1R (all 10 mg/kg) Abs every 3 days as indicated. The effects of anti-CSF1R and anti-CD3 on tumor cell PIM2 expression were determined in mouse tumor tissues. Scale bar, 100 μm. B, Huh7 cells were left untreated or were treated with CM from HCC-infiltrating leukocytes (TIL-CM) or macrophages and T cells together (Co-CM) isolated from HCC tumors. CM was withdrawn at 6 hours and PIM2 expression was determined by real-time PCR at the indicated times (n = 3). C, Multiplexed immunofluorescence staining analysis of PIM2+ cells (green), CD3+ cells (red), and CD68+ cells (white) in HCC tissue. The quantity of PIM2+ cancer cells was analyzed (n = 48). Scale bar, 50 μm. D and E, Huh7 cells were left untreated or were treated with CM from the indicated immune cells isolated from HCC tumors. PIM2 expression was determined by real-time PCR (D) or immunoblotting (E) at 6 hours or 12 hours, respectively (n = 4). F, ELISA analysis of different cytokines in the TSNs and Co-CM (n = 4). G, Relative PIM2 expression in Huh7 cells after exposure to Co-CM or Co-CM pretreated with blocking Ab for 6 hours (n = 4). H and I, PIM2 expression in Huh7 cells was determined by real-time PCR (H) or immunoblotting (I) at 6 hours or 12 hours, respectively, after treatment with cytokines as indicated (n = 4). J, ELISA analysis of different cytokines in the CM of different immune components (n = 3). Data represent mean ± SEM. *, P < 0.05; **, P < 0.01; ***, P < 0.001; ****, P < 0.0001. One-way ANOVA with Bonferroni correction (B, D, G, H, and J), two-way ANOVA with Bonferroni correction (C), or Student t test (F).
Figure 3. Activated T-cell–derived IFNγ enhances IL1β production by TAM to promote tumor cell PIM2 expression. A and B, Macrophages were treated with 30% TSN or IFNγ (5 ng/mL) for 24 hours. The activation status of macrophages and secretion of cytokines in the CM were determined by flow cytometry (A) and ELISA (B), respectively (n = 5). C, ELISA analysis of IL1β production in the TAM and CD3+ T cells coculture system in the presence of an IFNγ blocking Ab (n = 4). (D–H) Mice bearing Hepa1–6 hepatomas in the liver capsule for 8 days were treated with isotype control, αIL1β, or αIFNγ (all 10 mg/kg) as described (n = 5). The activation status of macrophages (E) and the expression levels of IL1β, IL6, and PIM2 in tumor tissues were determined (E, G, and H). Scale bar, 100 μmol/L. Data represent mean ± SEM. *, P < 0.05; **, P < 0.01; ***, P < 0.001; and ****, P < 0.0001. Two-way ANOVA with Bonferroni's correction (A and B), two-way ANOVA with Bonferroni's correction (C) or Student t test (E, H).
Figure 3.
Activated T-cell–derived IFNγ enhances IL1β production by TAM to promote tumor cell PIM2 expression. A and B, Macrophages were treated with 30% TSN or IFNγ (5 ng/mL) for 24 hours. The activation status of macrophages and secretion of cytokines in the CM were determined by flow cytometry (A) and ELISA (B), respectively (n = 5). C, ELISA analysis of IL1β production in the TAM and CD3+ T cells coculture system in the presence of an IFNγ blocking Ab (n = 4). DH, Mice bearing Hepa1–6 hepatomas in the liver capsule for 8 days were treated with isotype control, αIL1β, or αIFNγ (all 10 mg/kg) as described (n = 5). The activation status of macrophages (E) and the expression levels of IL1β, IL6, and PIM2 in tumor tissues were determined (E, G, and H). Scale bar, 100 μm. Data represent mean ± SEM. *, P < 0.05; **, P < 0.01; ***, P < 0.001; ****, P < 0.0001. Two-way ANOVA with Bonferroni correction (A and B), two-way ANOVA with Bonferroni correction (C) or Student t test (E and H).
Figure 4. Activation of the MAPK and NF-κB pathways is required for cancer cell PIM2 expression. A, Analysis of signaling pathways activated in Huh7 cells treated with Co-CM at the indicated hours by the Human Phospho-Kinase Array Kit (left), and the fold changes in differentially expressed signaling pathways are summarized (right). The Human Phospho-Kinase Array is divided into two parts, and we merge them in the figure and separate them with vertical dividing lines. B, Kinetic effects of Co-CM on the activation of selected signaling pathways activation by immunoblotting in Huh7 and Hep3B cells. C, Effects of signaling pathway inhibitors on cancer cell PIM2 expression induced by Co-CM. The level of PIM2 expression was determined by real-time PCR and immunoblotting after 6 and 12 hours, respectively (n = 4). D, GSEA of the MAPK family signaling signature and the NF-κB signaling signature in PIM2high HCC samples versus PIM2low counterparts from the TCGA dataset. (E–G) Tumor cells were transfected with p65 and c-Jun siRNAs for 48 hours (n = 3). The efficacy was determined by real-time PCR and immunoblotting (E). These cells were sequentially transfected with reporter plasmids expressing the PIM2 promoter, and luciferase activity was measured in Huh7 and Hep3B cells after treatment with 30% Co-CM for 12 hours (F). PIM2 expression in transfected tumor cells after treated with 30% Co-CM (G, n = 3). Data represent mean ± SEM. *, P < 0.05; **, P < 0.01; ***, P < 0.001; and ****, P < 0.0001. One-way ANOVA with Bonferroni's correction (C, F, G) or Student t test (E).
Figure 4.
Activation of the MAPK and NF-κB pathways is required for cancer cell PIM2 expression. A, Analysis of signaling pathways activated in Huh7 cells treated with Co-CM at the indicated hours by the Human Phospho-Kinase Array Kit (left), and the fold changes in differentially expressed signaling pathways are summarized (right). The Human Phospho-Kinase Array is divided into two parts, and we merged them in the figure and separated them with vertical dividing lines. B, Kinetic effects of Co-CM on the activation of selected signaling pathways activation by immunoblotting in Huh7 and Hep3B cells. C, Effects of signaling pathway inhibitors on cancer cell PIM2 expression induced by Co-CM. The level of PIM2 expression was determined by real-time PCR and immunoblotting after 6 and 12 hours, respectively (n = 4). D, GSEA of the MAPK family signaling signature and the NF-κB signaling signature in PIM2high HCC samples versus PIM2low counterparts from the TCGA dataset. E–G, Tumor cells were transfected with p65 and c-Jun siRNAs for 48 hours (n = 3). The efficacy was determined by real-time PCR and immunoblotting (E). These cells were sequentially transfected with reporter plasmids expressing the PIM2 promoter, and luciferase activity was measured in Huh7 and Hep3B cells after treatment with 30% Co-CM for 12 hours (F). PIM2 expression in transfected tumor cells after treatment with 30% Co-CM (G; n = 3). Data represent mean ± SEM. *, P < 0.05; **, P < 0.01; ***, P < 0.001; ****, P < 0.0001. One-way ANOVA with Bonferroni correction (C, F, and G) or Student t test (E).
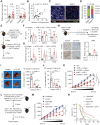
Figure 5. Tumor inflammation-elicited PIM2 expression displays an oncogenic function in hepatoma. A–D, Huh7 cells were incubated with T cell-CM, TAM-CM, or Co-CM for 24 hours. The proteins of survival-related genes (A) and apoptosis (B) in serum-starved tumor cells (n = 7), the migration of cells (C, n = 7), and the expression of EMT markers in cells (D, n = 4) were determined. Scale bar, 100 μm. E, GSEA of the metastasis and EMT-like signatures in PIM2high HCC samples versus PIM2low counterparts from the TCGA dataset. (F and G) Huh7 cells were pretreated with Co-CM for 12 hours, and then the effects of PIM2 inhibitor or knockdown of PIM2 expression with psi-LVRU6GP retroviral vector (shPIM2) on tumor cell migration (F, n = 6) and EMT marker expression (G, n = 4) were determined. Scale bar, 100 μm. H, Huh7 cells were left untreated or treated with a cocktail of cytokines, and the migration of cells was determined (n = 6). Scale bar, 100 μm. I, shNC and shPIM2 Huh7 cells were pretreated with or without Co-CM for 12 hours and then inoculated into dorsal tissues of NOD/SCID mice. Tumor sizes over the indicated time were analyzed (n = 7). (J and K) PIM2+ Huh7 cells were generated by incubating with Co-CM for 12 hours. Apoptosis of cells after exposure to activated T cells was determined at the indicated times (n = 4), and the effect of PIM2 inhibitor or knockdown of PIM2 expression with psi-LVRU6GP retroviral vector (shPIM2) on tumor cell apoptosis was analyzed at 24 hours (n = 7). L, Mice bearing Hepa1–6 hepatomas in the liver capsule for 8 days were treated with isotype control or αCSF1R Abs as described (Supplementary Fig. S5A). PIM2 expression in tumor tissues, tumor volume, and lung metastasis were analyzed (n = 5). Data represent mean ± SEM. *, P < 0.05; **, P < 0.01; ***, P < 0.001; and ****, P < 0.0001. One-way ANOVA with Bonferroni's correction (B–D, F, G, K), Student t test (H, L), or two-way ANOVA with Bonferroni's correction (I and J).
Figure 5.
Tumor inflammation-elicited PIM2 expression displays an oncogenic function in hepatoma. AD, Huh7 cells were incubated with T cell-CM, TAM-CM, or Co-CM for 24 hours. The proteins of survival-related genes (A) and apoptosis (B) in serum-starved tumor cells (n = 7), the migration of cells (C; n = 7), and the expression of EMT markers in cells (D; n = 4) were determined. Scale bar, 100 μm. E, GSEA of the metastasis and EMT-like signatures in PIM2high HCC samples versus PIM2low counterparts from the TCGA dataset.F and G, Huh7 cells were pretreated with Co-CM for 12 hours, and then the effects of PIM2 inhibitor or knockdown of PIM2 expression with psi-LVRU6GP retroviral vector (shPIM2) on tumor cell migration (F; n = 6) and EMT marker expression (G; n = 4) were determined. Scale bar, 100 μm. H, Huh7 cells were left untreated or treated with a cocktail of cytokines, and the migration of cells was determined (n = 6). Scale bar, 100 μm. I, shNC and shPIM2 Huh7 cells were pretreated with or without Co-CM for 12 hours and then inoculated into dorsal tissues of NOD/SCID mice. Tumor sizes over the indicated time were analyzed (n = 7). J and K, PIM2+ Huh7 cells were generated by incubating with Co-CM for 12 hours. Apoptosis of cells after exposure to activated T cells was determined at the indicated times (n = 4), and the effect of PIM2 inhibitor or knockdown of PIM2 expression with psi-LVRU6GP retroviral vector (shPIM2) on tumor cell apoptosis was analyzed at 24 hours (n = 7). L, Mice bearing Hepa1–6 hepatomas in the liver capsule for 8 days were treated with isotype control or αCSF1R Abs as described (Supplementary Fig. S5A). PIM2 expression in tumor tissues, tumor volume, and lung metastasis were analyzed (n = 5). Data represent mean ± SEM. *, P < 0.05; **, P < 0.01; ***, P < 0.001; ****, P < 0.0001. One-way ANOVA with Bonferroni correction (B–D, F, G, and K), Student t test (H and L), or two-way ANOVA with Bonferroni correction (I and J).
Figure 6. Suppressing IL1β-elicited PIM2 signaling augments the immunotherapeutic efficacy of a PD-1 Ab. A–D, A total of 39 patients with locally advanced, potentially resectable HCC who underwent curative resection after ICB therapy (n = 25) or control therapy (n = 14) were enrolled. mRNA levels of IL1β and PIM2 in tumor tissues (A), correlations between the mRNA levels of IL1β and PIM2 in the ICB group (B), multiplexed immunofluorescence staining analysis of PIM2+ cells (White), CD68+ cells (red), and IL1β+ cells (green) in HCC tissue from the ICB group (C, n = 6), and the responder rate of 25 patients with HCC who received neoadjuvant anti–PD-1 therapy (D) were analyzed. Stratification as PIM2low or PIM2high was performed using the median expression. PD, progressive disease; SD, stable disease; PR, partial response; CR, complete response. Scale bar, 50 μm. (E–H) Mice bearing Hepa1–6 hepatomas in the liver capsule for 8 days were treated with isotype control, αPD-1, αIFNγ, or αIL1β (all 10 mg/kg) Abs as described (n = 5). The activation status of macrophages (F) and the expression levels of IL1β, IL6, and PIM2 in tumor tissues were determined (G and H). Scale bar, 100 μm. Tumor volume in liver (I) and metastatic nodules in the lung (J) were quantified (n = 5). Scale bar, 1 cm. K, Mice bearing shNC or shPIM2 Hepa1–6 hepatomas in dorsal tissue for 10 days were treated with isotype control or αPD-1 (all 5 mg/kg) Abs as described. Tumor sizes over the indicated time were analyzed (n = 6). (L–N) C57BL/6 mice bearing Hepa1–6 hepatoma were treated with isotype control or αPD-1 (10 mg/kg) Abs and AZD1208 (25 mg/kg) as described. Tumor sizes of the subcutaneous hepatomas over the indicated time (M, n = 6) and survival of mice bearing orthotopic hepatomas (N, n = 14) were analyzed. Data represent mean ± SEM. *, P < 0.05; **, P < 0.01; ***, P < 0.001; and ****, P < 0.0001. Student t test (A), χ2 test (D), one-way ANOVA with Bonferroni's correction (F and G), two-way ANOVA with Bonferroni's correction (H–K, M), or log-rank test (N).
Figure 6.
Suppressing IL1β-elicited PIM2 signaling augments the immunotherapeutic efficacy of a PD-1 Ab. AD, A total of 39 patients with locally advanced, potentially resectable HCC who underwent curative resection after ICB therapy (n = 25) or control therapy (n = 14) were enrolled. mRNA levels of IL1β and PIM2 in tumor tissues (A), correlations between the mRNA levels of IL1β and PIM2 in the ICB group (B), multiplexed immunofluorescence staining analysis of PIM2+ cells (white), CD68+ cells (red), and IL1β+ cells (green) in HCC tissue from the ICB group (C; n = 6), and the responder rate of 25 patients with HCC who received neoadjuvant anti–PD-1 therapy (D) were analyzed. Stratification as PIM2low or PIM2high was performed using the median expression. CR, complete response; PD, progressive disease; PR, partial response; SD, stable disease. Scale bar, 50 μm. EH, Mice bearing Hepa1–6 hepatomas in the liver capsule for 8 days were treated with isotype control, αPD-1, αIFNγ, or αIL1β (all 10 mg/kg) Abs as described (n = 5). The activation status of macrophages (F) and the expression levels of IL1β, IL6, and PIM2 in tumor tissues were determined (G and H). Scale bar, 100 μm. I and J, Tumor volume in liver (I) and metastatic nodules in the lung (J) were quantified (n = 5). Scale bar, 1 cm. K, Mice bearing shNC or shPIM2 Hepa1–6 hepatomas in dorsal tissue for 10 days were treated with isotype control or αPD-1 (all 5 mg/kg) Abs as described. Tumor sizes over the indicated time were analyzed (n = 6). LN, C57BL/6 mice bearing Hepa1–6 hepatoma were treated with isotype control or αPD-1 (10 mg/kg) Abs and AZD1208 (25 mg/kg) as described. Tumor sizes of the subcutaneous hepatomas over the indicated time (M; n = 6) and survival of mice bearing orthotopic hepatomas (N; n = 14) were analyzed. Data represent mean ± SEM. *, P < 0.05; **, P < 0.01; ***, P < 0.001; ****, P < 0.0001. Student t test (A), χ2 test (D), one-way ANOVA with Bonferroni correction (F and G), two-way ANOVA with Bonferroni correction (HK and M), or log-rank test (N).

References

    1. Hanahan D, Weinberg RA. Hallmarks of cancer: the next generation. Cell 2011;144:646–74. - PubMed
    1. Maman S, Witz IP. A history of exploring cancer in context. Nat Rev Cancer 2018;18:359–76. - PubMed
    1. Hou J, Zhang H, Sun B, Karin M. The immunobiology of hepatocellular carcinoma in humans and mice: basic concepts and therapeutic implications. J Hepatol 2020;72:167–82. - PubMed
    1. Craig AJ, von Felden J, Garcia-Lezana T, Sarcognato S, Villanueva A. Tumor evolution in hepatocellular carcinoma. Nat Rev Gastroenterol Hepatol 2020;17:139–52. - PubMed
    1. Kuang DM, Zhao Q, Wu Y, Peng C, Wang J, Xu Z, et al. . Peritumoral neutrophils link inflammatory response to disease progression by fostering angiogenesis in hepatocellular carcinoma. J Hepatol 2011;54:948–55. - PubMed

Publication types