. 2022 Jul 8;17(7):e0270930.
doi: 10.1371/journal.pone.0270930. eCollection 2022.

Assessing the vulnerability of marine life to climate change in the Pacific Islands region

Affiliations

Assessing the vulnerability of marine life to climate change in the Pacific Islands region

Jonatha Giddens et al. PLoS One. .

Abstract

Our changing climate poses growing challenges for effective management of marine life, ocean ecosystems, and human communities. Which species are most vulnerable to climate change, and where should management focus efforts to reduce these risks? To address these questions, the National Oceanic and Atmospheric Administration (NOAA) Fisheries Climate Science Strategy called for vulnerability assessments in each of NOAA's ocean regions. The Pacific Islands Vulnerability Assessment (PIVA) project assessed the susceptibility of 83 marine species to the impacts of climate change projected to 2055. In a standard Rapid Vulnerability Assessment framework, this project applied expert knowledge, literature review, and climate projection models to synthesize the best available science towards answering these questions. Here we: (1) provide a relative climate vulnerability ranking across species; (2) identify key attributes and factors that drive vulnerability; and (3) identify critical data gaps in understanding climate change impacts to marine life. The invertebrate group was ranked most vulnerable and pelagic and coastal groups not associated with coral reefs were ranked least vulnerable. Sea surface temperature, ocean acidification, and oxygen concentration were the main exposure drivers of vulnerability. Early Life History Survival and Settlement Requirements was the most data deficient of the sensitivity attributes considered in the assessment. The sensitivity of many coral reef fishes ranged between Low and Moderate, which is likely underestimated given that reef species depend on a biogenic habitat that is extremely threatened by climate change. The standard assessment methodology originally developed in the Northeast US, did not capture the additional complexity of the Pacific region, such as the diversity, varied horizontal and vertical distributions, extent of coral reef habitats, the degree of dependence on vulnerable habitat, and wide range of taxa, including data-poor species. Within these limitations, this project identified research needs to sustain marine life in a changing climate.


Conflict of interest statement

The authors have declared that no competing interests exist.

Figures

Fig 1
Fig 1. Map of the Pacific region, and areas included in PIVA.
Green shading denotes extent of the Exclusive Economic Zone around each location. Stippled area denotes the Pacific spatial domain of environmental variables considered when sub-setting for specific taxa ranges.
Fig 2
Fig 2. Exposure scores for 12 variables as related to change over time and historical variability.
Exposure scores for 12 variables plotted on y-axis, change over time plotted on x-axis, and historical variability (coefficient of variation, CV) proportional to the size of symbol. All 83 taxa considered in PIVA are shown in each panel. Symbols are plotted in descending order of variability to minimize symbol overlayment.
Fig 3
Fig 3. Surface oxygen exposure summaries for Bigeye Tuna over the Pacific region.
The percentage of habitat experiencing different levels of change are depicted in the upper left histogram (Low = green, Moderate = yellow, High = orange, and Very High = red). The absolute value of changes in positive and negative change are combined in the upper right histogram panel, with the star on the x-axis representing the average exposure score. The bottom panel is the geographic visualization of perturbations to the habitat relative to the baseline reference level (color shaded values of standardized anomaly).
Fig 4
Fig 4. Surface oxygen exposure scores for Bigeye Tuna in the Commonwealth of the Northern Mariana Islands (CNMI) and Guam located in the Mariana Archipelago.
Colors and histograms interpreted as in Fig 3.
Fig 5
Fig 5. Surface oxygen exposure scores for Bigeye Tuna in the Hawaiian Archipelago.
Colors and histograms interpreted as in Fig 3.
Fig 6
Fig 6. Surface oxygen exposure scores for Bigeye Tuna in the American Samoa Archipelago.
Colors and histograms interpreted as in Fig 3.
Fig 7
Fig 7. Surface oxygen exposure scores for Bigeye Tuna in the U.S. Pacific Remote Island Areas (PRIAs).
Colors and histograms interpreted as in Fig 3.
Fig 8
Fig 8. Chlorophyll exposure scores for Bigeye Tuna over the Pacific region, showing an example of bidirectional exposure scoring.
Colors and histograms interpreted as in Fig 3.
Fig 9
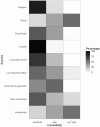
Fig 9. Summary of vulnerability scores across functional groups.
Vulnerability scores were standardized to represent the percentage of species within the group that fell in a particular category (from Moderate to Very High).
Fig 10
Fig 10. Vulnerability scores of pelagic fishes.
Overall climate vulnerability, as determined by point estimates, is denoted by box background color: Moderate (yellow), and High (orange). Certainty in vulnerability score is denoted by parenthetical number following the species name, indicating bootstrapped scores (0–100% certainty).
Fig 11
Fig 11. Vulnerability scores of sharks.
Overall climate vulnerability, as determined by point estimates, is denoted by box background color: Moderate (yellow), High (orange), and Very High (red). Certainty in vulnerability score is denoted by parenthetical number following the species name, indicating bootstrapped scores (0–100% certainty).
Fig 12
Fig 12. Vulnerability scores of deep-slope species.
Overall climate vulnerability, as determined by point estimates, is denoted by box background color: Moderate (yellow), and High (orange). Certainty in vulnerability score is denoted by parenthetical number following the species name, indicating bootstrapped scores (0–100% certainty).
Fig 13
Fig 13. Vulnerability scores of coastal species.
Overall climate vulnerability, as determined by point estimates, is denoted by box background color: Moderate (yellow). Certainty in vulnerability score is denoted by parenthetical number following the species name, indicating bootstrapped scores (0–100% certainty).
Fig 14
Fig 14. Vulnerability scores of Jack, Emperor, Grouper, and Snapper species.
Overall climate vulnerability, as determined by point estimates, is denoted by box background color: Moderate (yellow), and High (orange). Certainty in vulnerability score is denoted by parenthetical number following the species name, indicating bootstrapped scores (0–100% certainty).
Fig 15
Fig 15. Vulnerability scores for parrotfish.
Overall climate vulnerability, as determined by point estimates, is denoted by box background color: Moderate (yellow) and High (orange). Certainty in vulnerability score is denoted by parenthetical number following the species name, indicating bootstrapped scores (0–100% certainty).
Fig 16
Fig 16. Vulnerability scores of coral reef surgeonfishes.
Overall climate vulnerability, as determined by point estimates, is denoted by box background color: Moderate (yellow), and High (orange). Certainty in vulnerability score is denoted by parenthetical number following the species name, indicating bootstrapped scores (0–100% certainty).
Fig 17
Fig 17. Vulnerability scores for ‘other’ coral reef fish species.
Overall climate vulnerability, as determined by point estimates, is denoted by box background color: Moderate (yellow), High (orange), and Very High (red). Certainty in vulnerability score is denoted by parenthetical number following the species name, indicating bootstrapped scores (0–100% certainty).
Fig 18
Fig 18. Vulnerability scores for invertebrate species.
Overall climate vulnerability, as determined by point estimates, is denoted by box background color: Moderate (yellow), High (orange), and Very High (red). Certainty in vulnerability score is denoted by parenthetical number following the species name, indicating bootstrapped scores (0–100% certainty).

References

    1. Pinsky ML, Worm B, Fogarty MJ, Sarmiento JL, Levin SA. Marine taxa track local climate velocities. Science. 2013;341: 1239–1242. doi: 10.1126/science.1239352 - DOI - PubMed
    1. Pinsky ML, Byler D. Fishing, fast growth and climate variability increase the risk of collapse. Proc Biol Sci. 2015;282: 20151053. doi: 10.1098/rspb.2015.1053 - DOI - PMC - PubMed
    1. Kleisner KM, Fogarty MJ, McGee S, Barnett A, Fratantoni P, Greene J, et al.. The effects of sub-regional climate velocity on the distribution and spatial extent of marine species assemblages. PLoS One. 2016;11: e0149220. doi: 10.1371/journal.pone.0149220 - DOI - PMC - PubMed
    1. Intergovernmental Panel on Climate Change. Global Warming of 1.5°C: An IPCC Special Report on the Impacts of Global Warming of 1.5°C Above Pre-industrial Levels and Related Global Greenhouse Gas Emission Pathways, in the Context of Strengthening the Global Response to the Threat of Climate Change, Sustainable Development, and Efforts to Eradicate Poverty. Intergovernmental Panel on Climate Change; 2018.
    1. Morley JW, Selden RL, Latour RJ, Frölicher TL, Seagraves RJ, Pinsky ML. Projecting shifts in thermal habitat for 686 species on the North American continental shelf. PLoS One. 2018;13: e0196127. doi: 10.1371/journal.pone.0196127 - DOI - PMC - PubMed