. 2022 Jul;12(7):e958.
doi: 10.1002/ctm2.958.

Monocyte biomarkers define sargramostim treatment outcomes for Parkinson's disease

Affiliations

Monocyte biomarkers define sargramostim treatment outcomes for Parkinson's disease

Mai M Abdelmoaty et al. Clin Transl Med. 2022 Jul.

Abstract

Background: Dysregulation of innate and adaptive immunity heralds both the development and progression of Parkinson's disease (PD). Deficits in innate immunity in PD are defined by impairments in monocyte activation, function, and pro-inflammatory secretory factors. Each influences disease pathobiology.

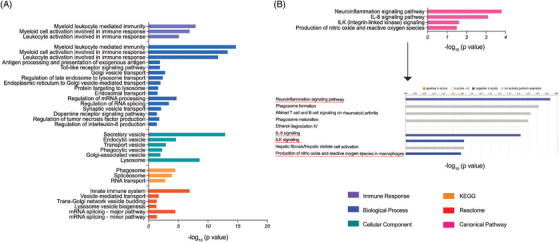
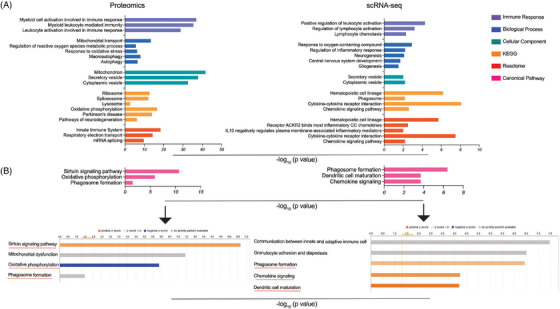
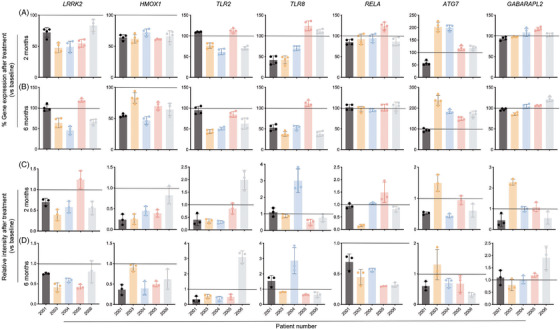
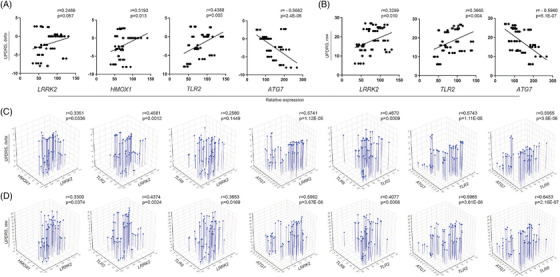
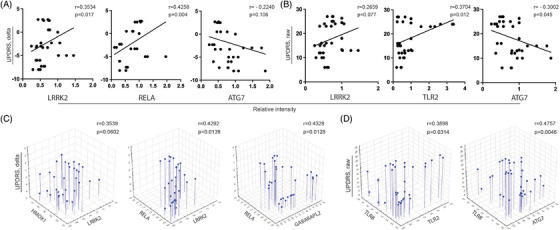
Methods and results: To define monocyte biomarkers associated with immune transformative therapy for PD, changes in gene and protein expression were evaluated before and during treatment with recombinant human granulocyte-macrophage colony-stimulating factor (GM-CSF, sargramostim, Leukine® ). Monocytes were recovered after leukapheresis and isolation by centrifugal elutriation, before and 2 and 6 months after initiation of treatment. Transcriptome and proteome biomarkers were scored against clinical motor functions. Pathway enrichments from single cell-RNA sequencing and proteomic analyses from sargramostim-treated PD patients demonstrate a neuroprotective signature, including, but not limited to, antioxidant, anti-inflammatory, and autophagy genes and proteins (LRRK2, HMOX1, TLR2, TLR8, RELA, ATG7, and GABARAPL2).

Conclusions: This monocyte profile provides an "early" and unique biomarker strategy to track clinical immune-based interventions, but requiring validation in larger case studies.

Keywords: GM-CSF; Parkinson's disease; biomarkers; monocytes; proteomics; scRNA-seq.


Conflict of interest statement

The authors declare that there is no conflict of interest that could be perceived as prejudicing the impartiality of the research reported.

Figures

FIGURE 1
FIGURE 1
Pathway enrichment of differentially expressed proteins in monocytes of PD patients at 2 months after sargramostim treatment. (A) Gene ontology (GO)‐term functional enrichment by five categories (immune response, biological process, cellular component, KEGG, and Reactome) performed using Cytoscape in conjunction with the plug‐in ClueGO. (B) Canonical pathway enrichment analysis performed using IPA (Qiagen). Black arrow points to the state of canonical pathways illustrated in Figure 1B; orange colour (activation), blue colour (inhibition), and grey colour (no activity pattern)
FIGURE 2
FIGURE 2
Pathway enrichment of differentially expressed proteins/genes in monocytes at 6 months after sargramostim treatment. (A) GO‐term functional enrichment by five categories (immune response, biological process, cellular component, KEGG, and Reactome) was performed using Cytoscape in conjunction with the plug‐in ClueGO. (B) Canonical pathway enrichment analysis was performed using IPA (Qiagen). Black arrows point to the state of canonical pathways illustrated in Figure (B); orange colour (activation), blue colour (inhibition), and grey colour (no activity pattern)
FIGURE 3
FIGURE 3
Gene and protein expression of potential biomarkers in monocytes at 2 and 6 months after sargramostim treatment. The ddPCR assay was performed to determine the gene expression of LRRK2, HMOX1, TLR2, TLR8, RELA, ATG7, and GABARAPL2 at 2 (A) and 6 (B) months after starting the sargramostim treatment compared to baseline. Gene expression was normalized to HPRT1, and the ddPCR assay was performed four times (n = 4 technical replicates). Western blot analysis was performed to determine the protein expression of β‐actin, LRRK2, HMOX1, TLR2, TLR8, RELA, ATG7, and GABARAPL2 at 2 (C) and 6 (D) months after starting the sargramostim treatment compared to baseline. Protein expression was normalized to β‐actin and densitometric quantification is shown. Western blot analysis was done thrice (n = 3 technical replicates). Data represent mean ± SD. Horizontal line in each image represents baseline expression; values above the line indicate upregulation, while values below the line indicate downregulation
FIGURE 4
FIGURE 4
Prediction of UPDRS III score by gene expression of potential biomarkers. (A) Correlation between genetic expression of LRRK2, HMOX1, TLR2, and ATG7 and change in UPDRS III score. (B) Correlation between genetic expression of LRRK2, TLR2, and ATG7 and raw UPDRS III score. (C) Multiple linear regression analysis of effect of genetic expression of LRRK2, HMOX1, TLR2, TLR8, and ATG7 on change in UPDRS III score. (D) Multiple linear regression analysis of effect of genetic expression of LRRK2, HMOX1, TLR2, TLR8, and ATG7 on raw UPDRS III score. (A,B) r = Pearson product‐moment correlation coefficient. (C,D) r = regression coefficient. p ≤ 0.05 was considered significant
FIGURE 5
FIGURE 5
Prediction of UPDRS III score by protein expression of potential biomarkers. (A) Correlation between protein expression of LRRK2, RELA, and ATG7 and change in UPDRS III score. (B) Correlation between protein expression of LRRK2, TLR2, and ATG7 and raw UPDRS III score. (C) Multiple linear regression analysis of effect of protein expression of LRRK2, HMOX1, RELA, and GABARAPL2 on change in UPDRS III score. (D) Multiple linear regression analysis of effect of protein expression of TLR2, TLR8, and ATG7 on raw UPDRS III score. (A,B) r = Pearson product‐moment correlation coefficient. (C,D) r = regression coefficient. p ≤ 0.05 was considered significant

References

    1. Jain S. Multi‐organ autonomic dysfunction in Parkinson disease. Parkinsonism Relat Disord. 2011;17(2):77‐83. - PMC - PubMed
    1. Houser MC, Tansey MG. The gut‐brain axis: is intestinal inflammation a silent driver of Parkinson's disease pathogenesis? NPJ Parkinsons Dis. 2017. ; 3:3. - PMC - PubMed
    1. Nissen SK, Shrivastava K, Schulte C, et al. Alterations in blood monocyte functions in Parkinson's disease. Mov Disord 2019;34(11):1711‐1721. - PubMed
    1. Brochard V, Combadiere B, Prigent A, et al. Infiltration of CD4+ lymphocytes into the brain contributes to neurodegeneration in a mouse model of Parkinson disease. J Clin Invest. 2009;119(1):182‐192. - PMC - PubMed
    1. Rocha EM, De Miranda B, Sanders LH. Alpha‐synuclein: pathology, mitochondrial dysfunction and neuroinflammation in Parkinson's disease. Neurobiol Dis. 2018;109(Pt B):249‐257. - PubMed

MeSH terms