. 2022 Aug:82:104118.
doi: 10.1016/j.ebiom.2022.104118. Epub 2022 Jul 5.

A classification and regression tree analysis identifies subgroups of childhood type 1 diabetes

Affiliations

A classification and regression tree analysis identifies subgroups of childhood type 1 diabetes

Peter Achenbach et al. EBioMedicine. 2022 Aug.

Abstract

Background: Diabetes in childhood and adolescence includes autoimmune and non-autoimmune forms with heterogeneity in clinical and biochemical presentations. An unresolved question is whether there are subtypes, endotypes, or theratypes within these forms of diabetes.

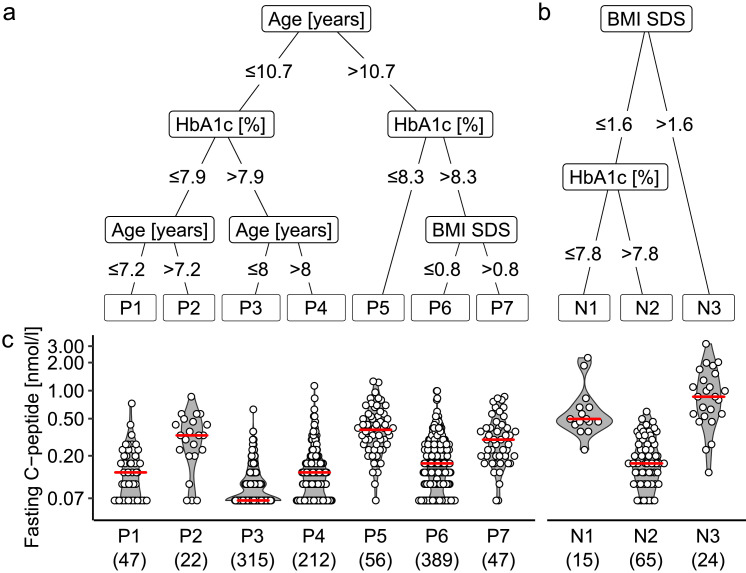
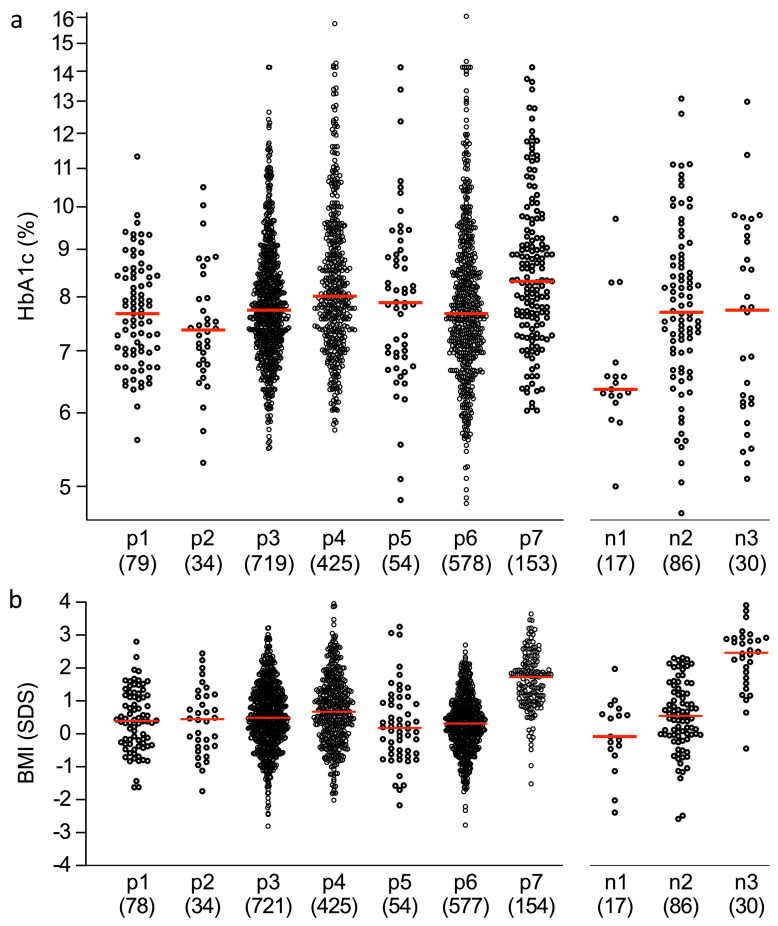
Methods: The multivariable classification and regression tree (CART) analysis method was used to identify subgroups of diabetes with differing residual C-peptide levels in patients with newly diagnosed diabetes before 20 years of age (n=1192). The robustness of the model was assessed in a confirmation and prognosis cohort (n=2722).

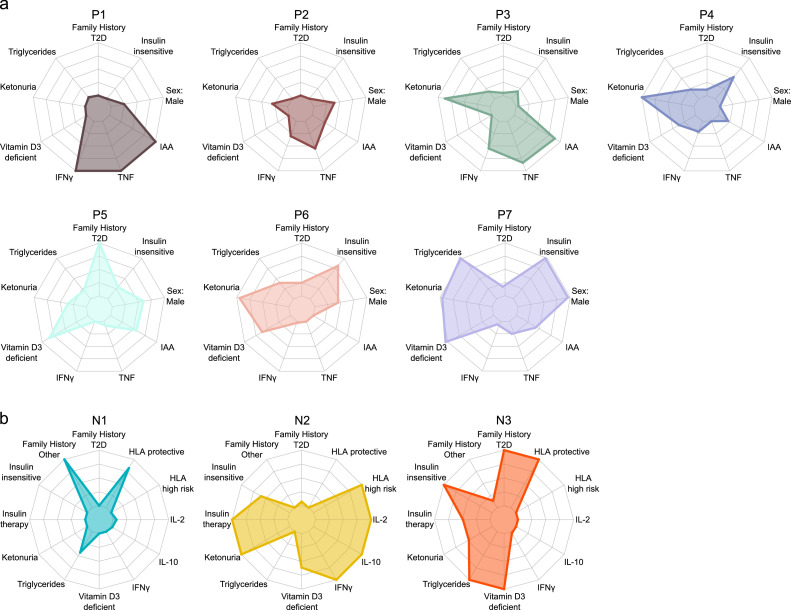
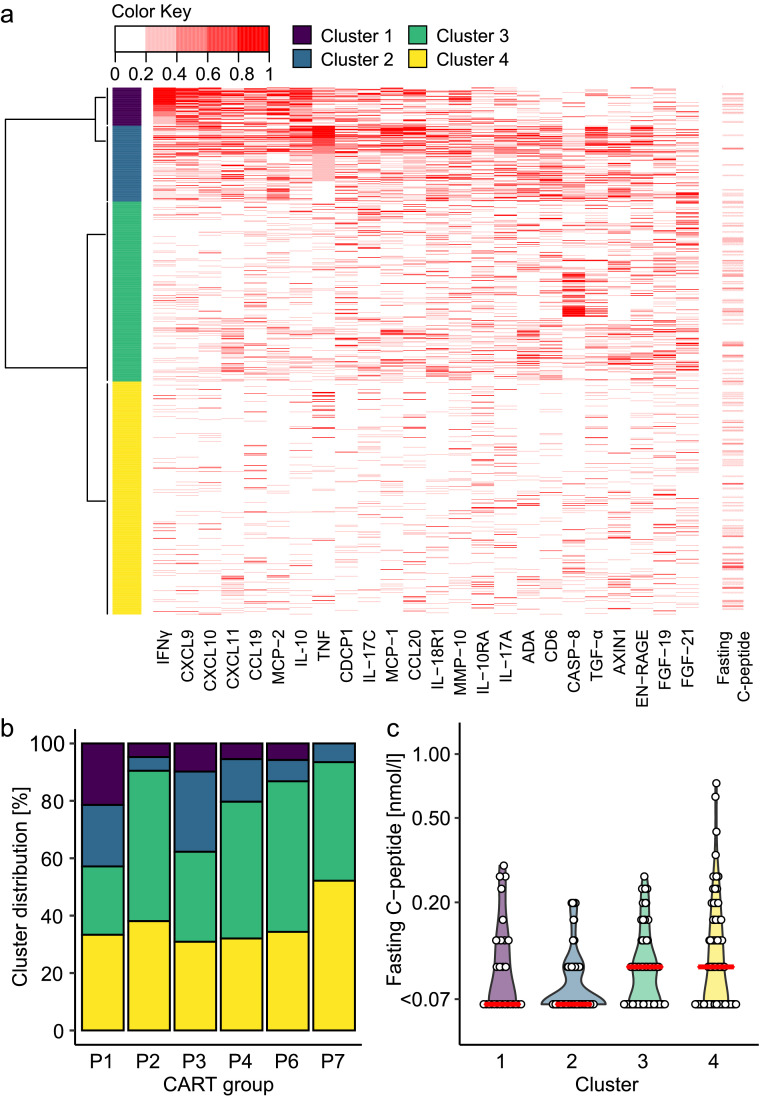
Findings: The analysis selected age, haemoglobin A1c (HbA1c), and body mass index (BMI) as split parameters that classified patients into seven islet autoantibody-positive and three autoantibody-negative groups. There were substantial differences in genetics, inflammatory markers, diabetes family history, lipids, 25-OH-Vitamin D3, insulin treatment, insulin sensitivity and insulin autoimmunity among the groups, and the method stratified patients with potentially different pathogeneses and prognoses. Interferon-ɣ and/or tumour necrosis factor inflammatory signatures were enriched in the youngest islet autoantibody-positive groups and in patients with the lowest C-peptide values, while higher BMI and type 2 diabetes characteristics were found in older patients. The prognostic relevance was demonstrated by persistent differences in HbA1c at 7 years median follow-up.

Interpretation: This multivariable analysis revealed subgroups of young patients with diabetes that have potential pathogenetic and therapeutic relevance.

Funding: The work was supported by funds from the German Federal Ministry of Education and Research (01KX1818; FKZ 01GI0805; DZD e.V.), the Innovative Medicine Initiative 2 Joint Undertaking INNODIA (grant agreement No. 115797), the German Robert Koch Institute, and the German Diabetes Association.

Keywords: C-peptide; CART analysis; Childhood autoimmune disease; Diabetes endotypes; Diabetes in childhood; Inflammation; Islet autoantibody; Obesity; Type 1 diabetes genetic susceptibility.


Conflict of interest statement

Declaration of interests The authors have declared that no competing interests exist.

Figures

Figure 1
Figure 1
Multivariable CART model for classifying DiMelli participants with new-onset diabetes into subgroups. The model was applied to 1088 islet autoantibody-positive patients (a) and 104 islet autoantibody-negative patients (b) separately, using fasting C-peptide concentrations (c) as the outcome marker. Sex, age at diagnosis, days since diagnosis, HbA1c, BMI SDS, first-degree family history of type 1 diabetes, and first-degree family history of any other form of diabetes were included as possible predictor variables in the model. Of these variables, the CART model selected age, HbA1c, and BMI for the autoantibody-positive patients, and BMI and HbA1c for the autoantibody-negative patients. P values were ≤0.001 [CART] for each of the splits selected by the models. The red line displays the median. The numbers of patients are shown in parentheses. BMI, body mass index; HbA1c, haemoglobin A1c; SDS, standard deviation score.
Figure 2
Figure 2
Features of the CART-defined subgroups derived from DiMelli participants included in the main analysis. The radar plots show the CART groups for 1088 islet autoantibody-positive patients (a) and 104 islet autoantibody-negative patients (b) at diagnosis. The indicated variables were highly significant between the groups, as shown in Tables 1 and 2. The radar plots convert the differences observed between the groups to the full scale of the plot for each variable. HLA, human leukocyte antigen; IFNɣ, interferon-ɣ; IL, interleukin; T2D, type 2 diabetes; TNF, tumour necrosis factor.
Figure 3
Figure 3
Inflammatory markers (OLINK inflammation panel) at diagnosis of diabetes in 805 islet autoantibody-positive patients in DiMelli. (a) The data were used to generate heatmaps and identify four clusters of patients. The most informative proteins in these clusters are indicated in the heatmap. Fasting C-peptide is shown on the right. (b) Frequency distribution of the four clusters within the CART-defined patient groups. (c) Fasting C-peptide concentrations in the group P1 and P3 patients stratified by inflammatory cluster. ADA, adenosine deaminase; CASP-8, caspase-8; FGF, fibroblast growth factor; IFNɣ, interferon-ɣ; IL, interleukin; MCP, monocyte chemoattractant protein; MMP, matrix metalloproteinase; TGF, transforming growth factor; TNF, tumour necrosis factor.
Figure 4
Figure 4
HbA1c (a) and BMI (b) at a median follow-up of 7.0 years after the diagnosis of diabetes in the second cohort. The patients were classified according to their islet autoantibody status and the CART group from the parameters recorded at disease onset (islet autoantibody-positive groups: p1–p7; islet autoantibody-negative groups: n1, n2, and n3). HbA1c (a) and BMI expressed as the age- and sex-adjusted SDS (b) at follow-up are shown in each of the subgroups. The red line displays the median. The numbers of patients are shown in parentheses.

References

    1. Patterson CC, Karuranga S, Salpea P, et al. Worldwide estimates of incidence, prevalence and mortality of type 1 diabetes in children and adolescents: results from the International Diabetes Federation Diabetes Atlas, 9th edition. Diabetes Res Clin Pract. 2019;157 - PubMed
    1. DiMeglio LA, Evans-Molina C, Oram RA. Type 1 diabetes. Lancet North Am Ed. 2018;391(10138):2449–2462. - PMC - PubMed
    1. American Diabetes Association. 2 Classification and diagnosis of diabetes: standards of medical care in diabetes—2020. Diabetes Care. 2020;43(suppl 1):S14–S31. - PubMed
    1. Dabelea D, Mayer-Davis EJ, Andrews JS, et al. Clinical evolution of beta cell function in youth with diabetes: the SEARCH for Diabetes in Youth study. Diabetologia. 2012;55(12):3359–3368. - PMC - PubMed
    1. Patel KA, Oram RA, Flanagan SE, et al. Type 1 diabetes genetic risk score: a novel tool to discriminate monogenic and type 1 diabetes. Diabetes. 2016;65(7):2094–2099. - PMC - PubMed