. 2022 Aug:54:102380.
doi: 10.1016/j.redox.2022.102380. Epub 2022 Jul 2.

Protein palmitoylation-mediated palmitic acid sensing causes blood-testis barrier damage via inducing ER stress

Affiliations

Protein palmitoylation-mediated palmitic acid sensing causes blood-testis barrier damage via inducing ER stress

Xie Ge et al. Redox Biol. 2022 Aug.

Abstract

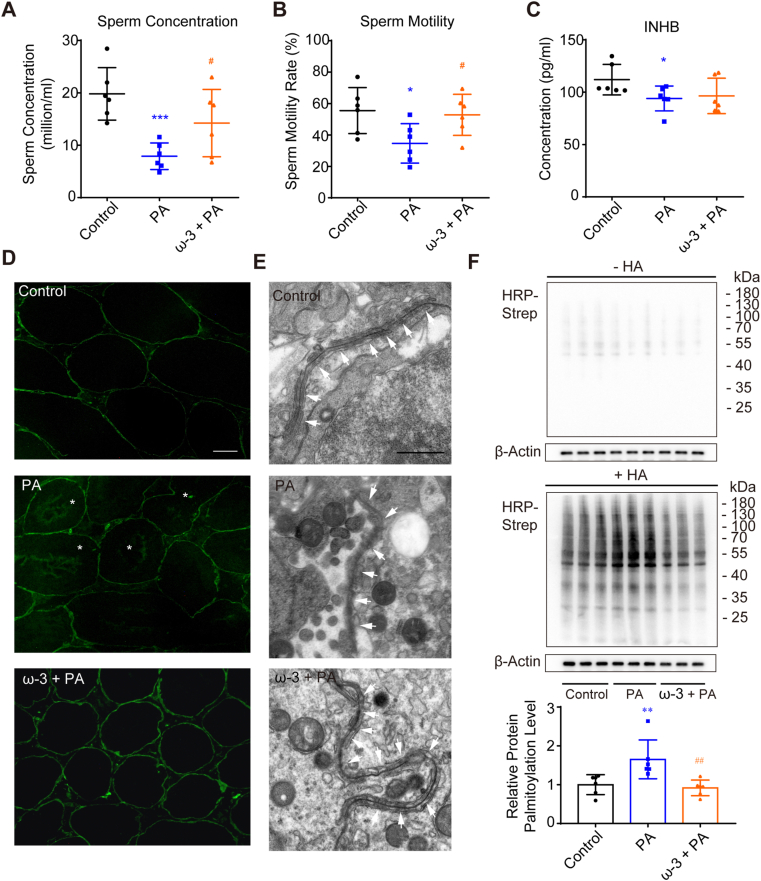
Blood-testis barrier (BTB) damage promotes spermatogenesis dysfunction, which is a critical cause of male infertility. Dyslipidemia has been correlated with male infertility, but the major hazardous lipid and the underlying mechanism remains unclear. In this study, we firstly discovered an elevation of palmitic acid (PA) and a decrease of inhibin B in patients with severe dyszoospermia, which leaded us to explore the effects of PA on Sertoli cells. We observed a damage of BTB by PA. PA penetration to endoplasmic reticulum (ER) and its damage to ER structures were exhibited by microimaging and dynamic observation, and consequent ER stress was proved to mediate PA-induced Sertoli cell barrier disruption. Remarkably, we demonstrated a critical role of aberrant protein palmitoylation in PA-induced Sertoli cell barrier dysfunction. An ER protein, Calnexin, was screened out and was demonstrated to participate in this process, and suppression of its palmitoylation showed an ameliorating effect. We also found that ω-3 poly-unsaturated fatty acids down-regulated Calnexin palmitoylation, and alleviated BTB dysfunction. Our results indicate that dysregulated palmitoylation induced by PA plays a pivotal role in BTB disruption and subsequent spermatogenesis dysfunction, suggesting that protein palmitoylation might be therapeutically targetable in male infertility.

Keywords: Blood-testis barrier; Endoplasmic reticulum stress; Palmitic acid; Palmitoylation; Sertoli cell; Tight junction.


Conflict of interest statement

The authors declare that they have no known competing financial interests or personal relationships that could have appeared to influence the work reported in this paper.

Figures

Image 1
Graphical abstract
Fig. 1
Fig. 1
Serum PA levels are significantly higher in patients with NOA or EO. (A–C) MLCFA (A), SFA (B), and USFA (C) levels in serums from patients were quantified using GC-MS. (D) The ratios between SFA and USFA levels in serums from patients were calculated. (E, F) SFA components (E) and PA levels (F) in serums from patients were quantified using GC-MS. (G) INHB levels in serums from patients were determined using chemiluminescence. Control, healthy controls (n = 25); NOA/EO, patients with NOA (n = 22) or EO (n = 3). Data are presented as mean ± SD. n. s., no significant difference vs. Control group. *P < 0.05, **P < 0.01, and ***P < 0.001 vs. Control group.
Fig. 2
Fig. 2
PA disrupts spermatogenesis, while 2-BP shows a rescuing effect. Mice were injected intraperitoneally (i.p.) with BSA (Control group) or PA-BSA (PA group) (n = 7 per group) once daily for 30 days, with or without gavage of 2-BP every two days. (A, B) Sperm concentrations (A) and sperm motilities (i.e. percentage of mobile sperms) (B) were assessed using a haemocytometer. (C) Concentrations of INHB in serums were analyzed by ELISA. Data are presented as mean ± SD. *P < 0.05 and **P < 0.01 vs. Control group. #P < 0.05 vs. PA group. (D) Assessment of BTB integrity in vivo using FITC-I permeability assays. Asterisks (*) indicate leaked FITC-I in the lumen of seminiferous tubules. Scale bars: 100 μm. (E) The ultrastructure of tight junctions was observed using transmission electron microscopy. White arrows indicate the tight junctions. Scale bars: 1 μm.
Fig. 3
Fig. 3
PA damages cell barrier and induces ER stress in Sertoli cell. (A) TER detection of primary Sertoli cell barriers. The cells were incubated with (PA) or without (Control) 0.4 mM PA for 3 days after barriers were formed on day 4 (n = 5). (B) FITC-dextran permeability assessment of primary Sertoli cell barriers. The cells were treated with (PA) or without (Control) 0.4 mM PA for 24 h after cell barriers were formed (n = 5). (C, D) Subcellular localization of PA. Fluorescently marked PA (BODIPY® FL C16) colocalized with (C) ER (ER-Tracker Red), but not (D) mitochondria (MitoRed). The nuclei were stained with Hoechst. Scale bar: 5 μm. White arrowheads, PA and ER colocalization. (E) Ultrastructural changes in the ER of TM4 cells treated with (PA) or without (Control) 0.4 mM PA for 24 h were observed by transmission electron microscopy. The lower panels show magnifications of the boxed areas in the relevant upper panels, revealing ribosomes lining the ER membranes. Scale bar: 1 μm. (F, G) Observation of ER distribution in TM4 Sertoli cells by ER-Tracker Green staining. The cells were incubated with (PA) or without (Control) 0.4 mM PA for 30 min (F) or 24 h (G). The nuclei were stained with Hoechst. Scale bar: 10 μm. White arrowheads, reticular structures at the periphery of nuclei. Time-lapse observations of ER distribution were shown in the form of videos in Supplementary files (Video S1 and Video S2). (H) Translational expression levels of ER stress-related genes were analyzed using western blotting. The relative intensities of bands were quantified by ImageJ and normalized to β-actin levels (n = 3). (I) ROS detection using DCFH-DA staining. The fluorescence densities were calculated using ImageJ (n = 3). Scale bar: 50 μm. In Panels G and H, TM4 cells were incubated with (PA) or without (Control) 0.4 mM PA for 24 h. Data are presented as mean ± SD. *P < 0.05, **P < 0.01 and ***P < 0.001 vs. Control group. (For interpretation of the references to color in this figure legend, the reader is referred to the Web version of this article.)
Fig. 4
Fig. 4
Inhibition of protein palmitoylation ameliorates PA induced Sertoli cell dysfunction. (A) Analysis of the palmitoylation levels of proteins extracted from the testes of mice administered or not administered the PA injection, with or without gavage of 2-BP (n = 6 for Control, n = 7 for PA and 2-BP + PA). (B) Analysis of the palmitoylation levels of proteins extracted from primary Sertoli cells, Leydig cells and germ cells, which were treated with or without 0.4 mM PA (n = 3). (C) Inhibition of palmitoylation by 2-BP suppressed PA-induced ER stress in Sertoli cells. Translational expression levels of ER stress-related genes were analyzed using Western blotting (n = 3). (D) ROS detection using DCFH-DA staining. The fluorescence densities were calculated using ImageJ (n = 3). Scale bar: 50 μm. (E) TER detection of primary Sertoli cell barriers. The cells were incubated with PA (PA), with PA combined with 2-BP (2-BP + PA), or with the vehicle (Control) for 3 days after barriers were formed on day 4 (n = 5). (F) FITC-dextran permeability assessment of primary Sertoli cell barriers. The cells were treated PA (PA), with PA combined with 2-BP (2-BP + PA), or with the vehicle (Control) for 24 h after cell barriers were formed (n = 5). (G)Tight junction protein levels were examined by western blotting in TM4 Sertoli cells (n = 3). The relative intensities of bands in western blotting results were quantified by ImageJ and normalized to β-actin levels. Data are presented as mean ± SD. n. s., no significant difference vs. Control group. *P < 0.05, **P < 0.01 and ***P < 0.001 vs. Control group. #P < 0.05, ##P < 0.01 and ###P < 0.001 vs. PA group.
Fig. 5
Fig. 5
Identification of palmitoylated proteins regulated by PA. (A) The flowchart illustrating the mass spectrum analysis of palmitoylated proteins regulated by PA. (BD) GO (B), COG (C) and KEGG pathway (D) analysis of proteins whose palmitoylation levels were up-regulated after PA treatment in TM4 cells. (E) Detection of palmitoylation levels of ER proteins predicted to be regulated by PA. TM4 cells were treated by PA, with or without 2-BP pretreatment.
Fig. 6
Fig. 6
The palmitoylation of calnexin is involved in PA-induced cell barrier disruption in Sertoli cells. (A) Sequences of wild type (WT) and mutated calnexin fragments. The predicted palmitoylation sites are marked with red color, and the mutated sites are marked with green color. (B) The palmitoylation of exogenous calnexin was validated, and sites 8, 503 and 504 were found to be its palmitoylation target sites. (C) The palmitoylation of exogenous calnexin was up-regulated by PA, while the mutation of all three target sites diminished palmitoylation. (D) Western blotting results indicated that mutation of all three palmitoylation target sites in calnexin alleviated PA-induced upregulation of CHOP (n = 3). (E) Mutation of all three palmitoylation target sites in calnexin alleviated PA-induced ROS production in Sertoli cells. ROS production was detected using DCFH-DA staining. The fluorescence densities were calculated using ImageJ (n = 3). Scale bar: 50 μm. (F, G) Mutation of all three palmitoylation target sites in calnexin ameliorated PA-damaged Sertoli cell barrier. TER detection (F, n = 7) and FITC-dextran permeability assays (G, n = 5) were used to detect the cell barrier integrity. (H) Tight junction protein levels were examined by western blotting. The relative intensities of bands were quantified by ImageJ and normalized to β-actin levels (n = 3). Data are presented as mean ± SD. *P < 0.05, **P < 0.01 and ***P < 0.001 vs. Control group; #P < 0.05 and ##P < 0.01 vs. PA group. (For interpretation of the references to color in this figure legend, the reader is referred to the Web version of this article.)
Fig. 7
Fig. 7
ω-3 PUFAs rescues PA-induced spermatogenesis dysfunction in mice. Mice were injected intraperitoneally (i.p.) with BSA (Control group) or PA-BSA (PA group) (n = 6 per group) once daily for 30 days, with or without gavage of ω-3 PUFAs every two days. (A, B) Sperm concentrations (A) and sperm motilities (i.e. percentage of mobile sperms) (B) were assessed using a haemocytometer. (C) Concentrations of INHB in serums were analyzed by ELISA. Data are presented as mean ± SD. *P < 0.05 and ***P < 0.001 vs. Control group. #P < 0.05 vs. PA group. (D) Assessment of BTB integrity in vivo using FITC-I permeability assays. Asterisks (*) indicate leaked FITC-I in the lumen of seminiferous tubules. Scale bars: 100 μm. (E) The ultrastructure of tight junctions was observed using transmission electron microscopy. White arrows indicate the tight junctions. Scale bars: 1 μm. (F) Analysis of the palmitoylation levels of proteins extracted from the testes of mice administered or not administered the PA injection, with or without gavage of ω-3 PUFAs. The relative intensities of bands were quantified by ImageJ and normalized to β-actin levels (n = 6). Data are presented as mean ± SD. **P < 0.01 vs. Control group; ##P < 0.01 vs. PA group.
Fig. 8
Fig. 8
ω-3 PUFAs ameliorate PA-induced Sertoli cell dysfunction and protein over-palmitoylation. (A) ω-3 PUFAs suppressed PA-induced ER stress in Sertoli cells. TM4 cells were treated by PA, with or without a pretreatment of ω-3 PUFAs. Translational expression levels of ER stress-related genes were analyzed using Western blotting. The relative intensities of bands were quantified by ImageJ and normalized to β-actin level (n = 3). (B) ROS detection using DCFH-DA staining. The fluorescence densities were calculated using ImageJ (n = 3). Scale bar: 50 μm. (C, D) Assessment of cell barrier integrity in vitro. After cell barrier formation, cells were incubated with PA (PA), with PA combined with ω-3 (ω-3 + PA), or with the vehicle (Control). TER detection (C, n = 8) and FITC-dextran permeability assays (D, n = 5) were used to analyze the integrity of primary Sertoli cell barriers. (E) Tight junction protein levels in TM4 Sertoli cells were examined by western blotting. The relative intensities of bands were quantified by ImageJ and normalized to β-actin levels (n = 3). (F) Analysis of the palmitoylation levels of proteins extracted from PA-treated TM4 cells with or without a pretreatment with ω-3 PUFAs. The relative intensities of bands were quantified by ImageJ and normalized to β-actin levels (n = 3). (G) Detection of palmitoylation levels of CNX in TM4 cells treated by PA, with or without pretreatment of ω-3 PUFAs. Data are presented as mean ± SD. **P < 0.01 and ***P < 0.001 vs. Control group. #P < 0.05, ##P < 0.01 and ###P < 0.001 vs. PA group.
Fig. 9
Fig. 9
Mechanism of Sertoli cell barrier disruption induced by PA. PA enters Sertoli cells, penetrates ER, and palmitoylates ER proteins. Palmitoylated CNX and other ER proteins activate ER stress, especially PERK pathway, promote cell apoptosis and down-regulate tight junction proteins by inducing CHOP expression, and finally disrupt Sertoli cell barrier. On the other hand, ω-3 PUFAs alleviates the palmitoylation of ER proteins and Sertoli cell dysfunction induced by PA.

References

    1. Evans E.P.P., Scholten J.T.M., Mzyk A., Reyes-San-Martin C., Llumbet A.E., Hamoh T., Arts E., Schirhagl R., Cantineau A.E.P. Male subfertility and oxidative stress. Redox Biol. 2021;46 doi: 10.1016/j.redox.2021.102071. - DOI - PMC - PubMed
    1. Deshpande P.S., Gupta A.S. Causes and prevalence of factors causing infertility in a public Health facility. J. Hum. Reprod. Sci. 2019;12(4):287–293. doi: 10.4103/jhrs.JHRS_140_18. - DOI - PMC - PubMed
    1. McCabe M.J., Tarulli G.A., Laven-Law G., Matthiesson K.L., Meachem S.J., McLachlan R.I., Dinger M.E., Stanton P.G. Gonadotropin suppression in men leads to a reduction in claudin-11 at the Sertoli cell tight junction. Hum. Reprod. 2016;31(4):875–886. [pii] - PubMed
    1. Zhu R., Wang J., Feng T., Hu X., Jiang C., Wang X., Li K., Sang Y., Hua Y., Sun H., Yao B., Li C. The alteration of RhoA geranylgeranylation and Ras farnesylation breaks the integrity of the blood-testis barrier and results in hypospermatogenesis. Cell Death Dis. 2019;10(6):450. doi: 10.1038/s41419-019-1688-9. - DOI - PMC - PubMed
    1. Morrison C.D., Brannigan R.E. Metabolic syndrome and infertility in men. Best Pract. Res. Clin. Obstet. Gynaecol. 2015;29(4):507–515. doi: 10.1016/j.bpobgyn.2014.10.006. - DOI - PubMed

Publication types