. 2022 Jul 7;29(7):1135-1153.e8.
doi: 10.1016/j.stem.2022.06.007.

Type-I-interferon signaling drives microglial dysfunction and senescence in human iPSC models of Down syndrome and Alzheimer's disease

Affiliations

Type-I-interferon signaling drives microglial dysfunction and senescence in human iPSC models of Down syndrome and Alzheimer's disease

Mengmeng Jin et al. Cell Stem Cell. .

Abstract

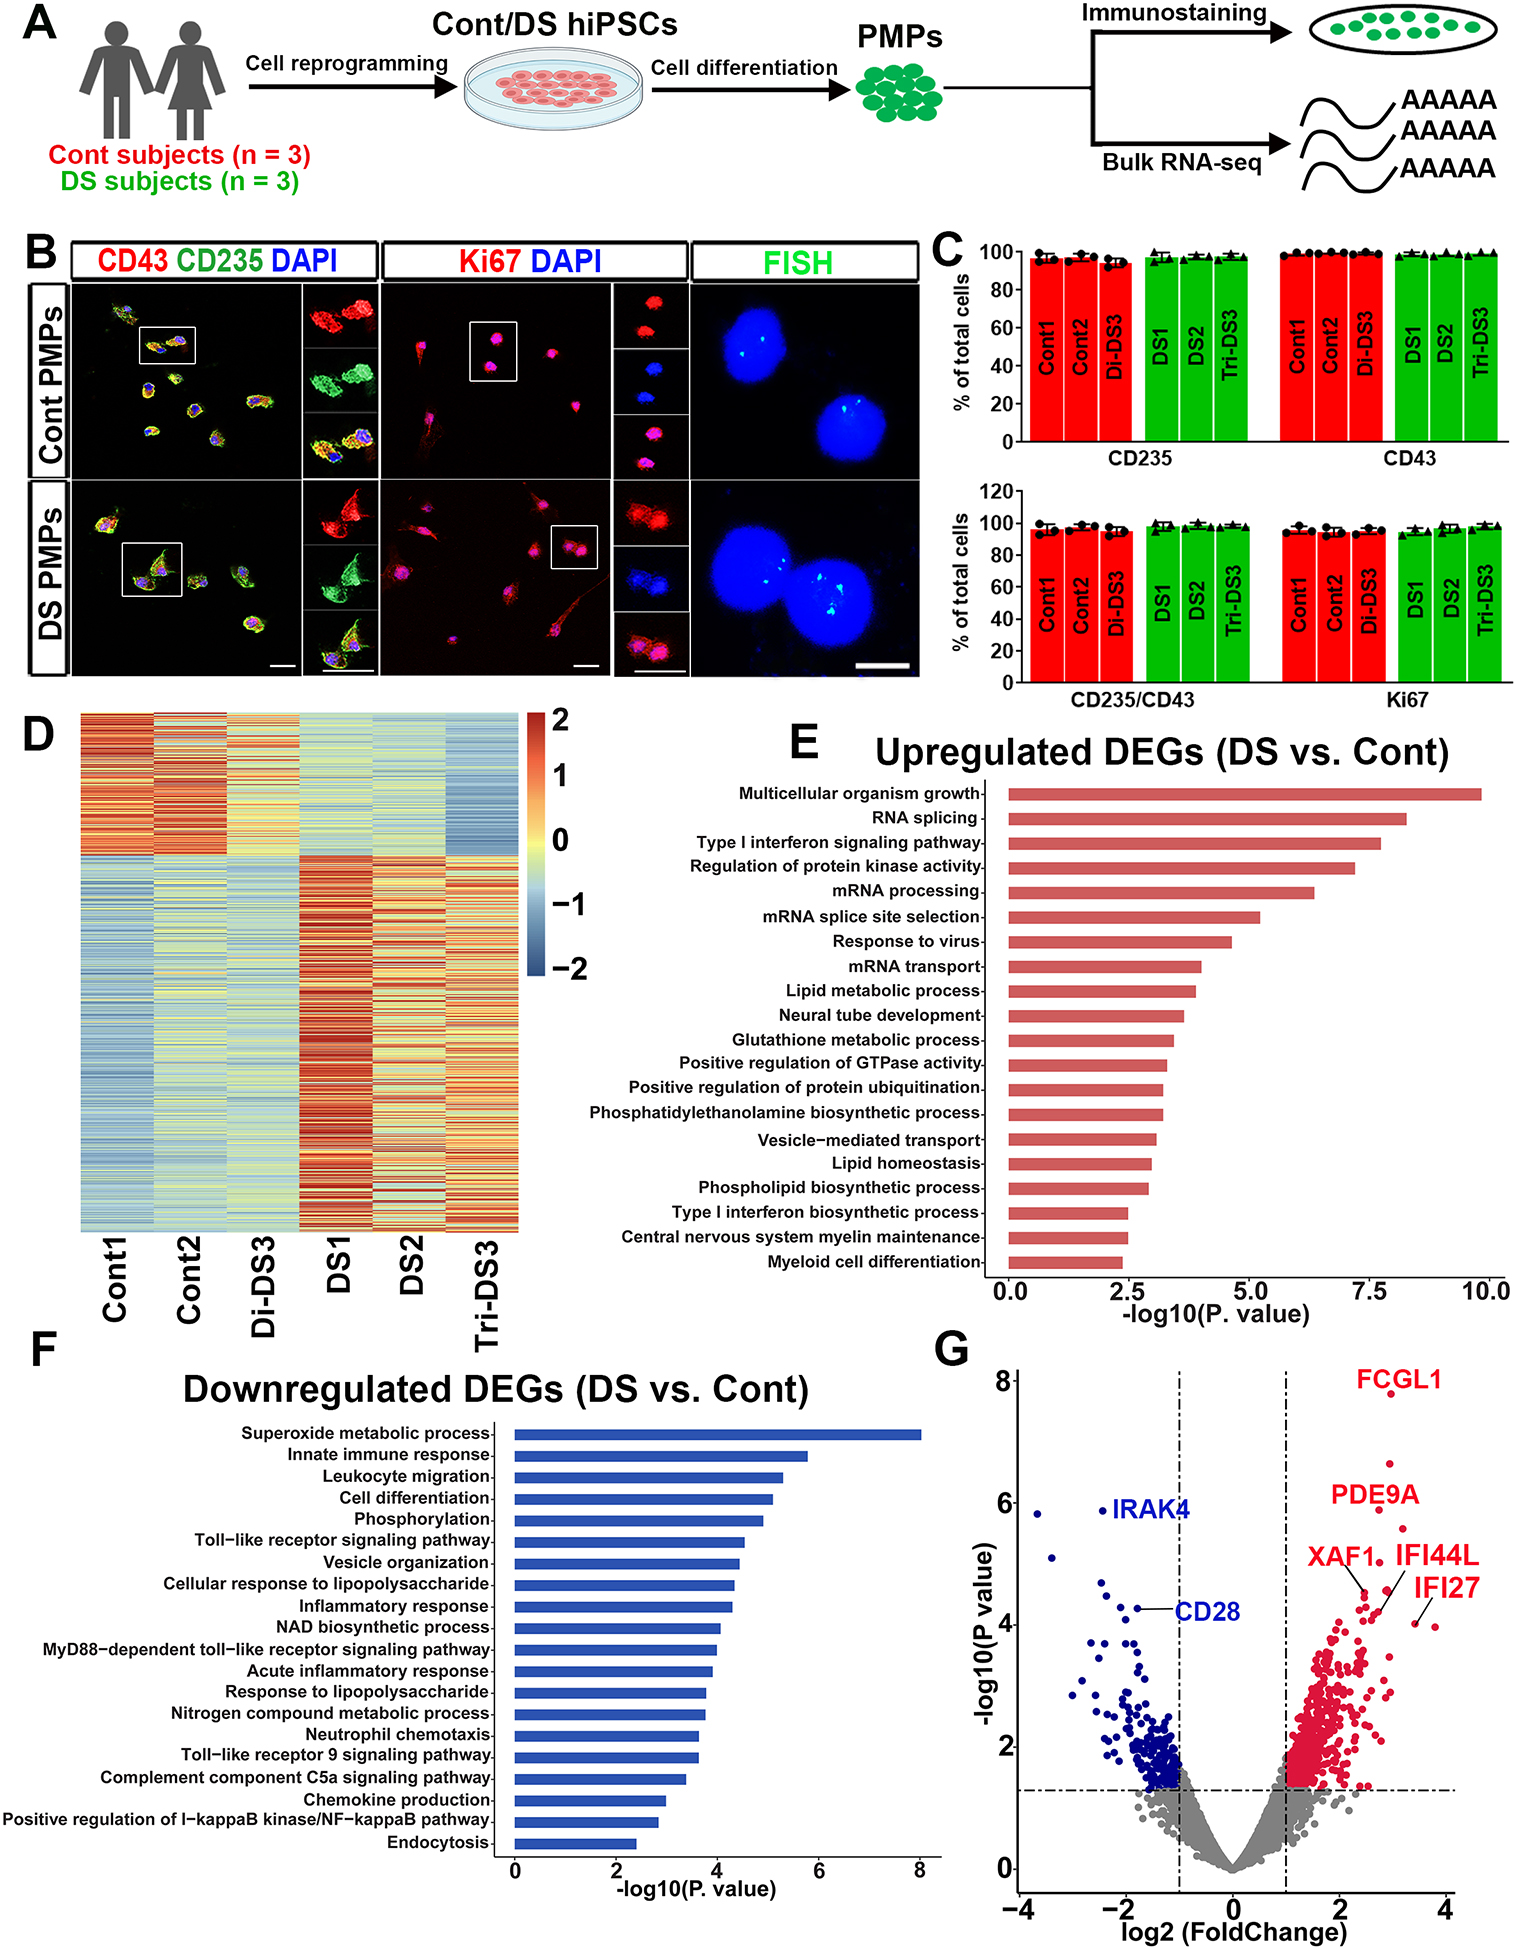
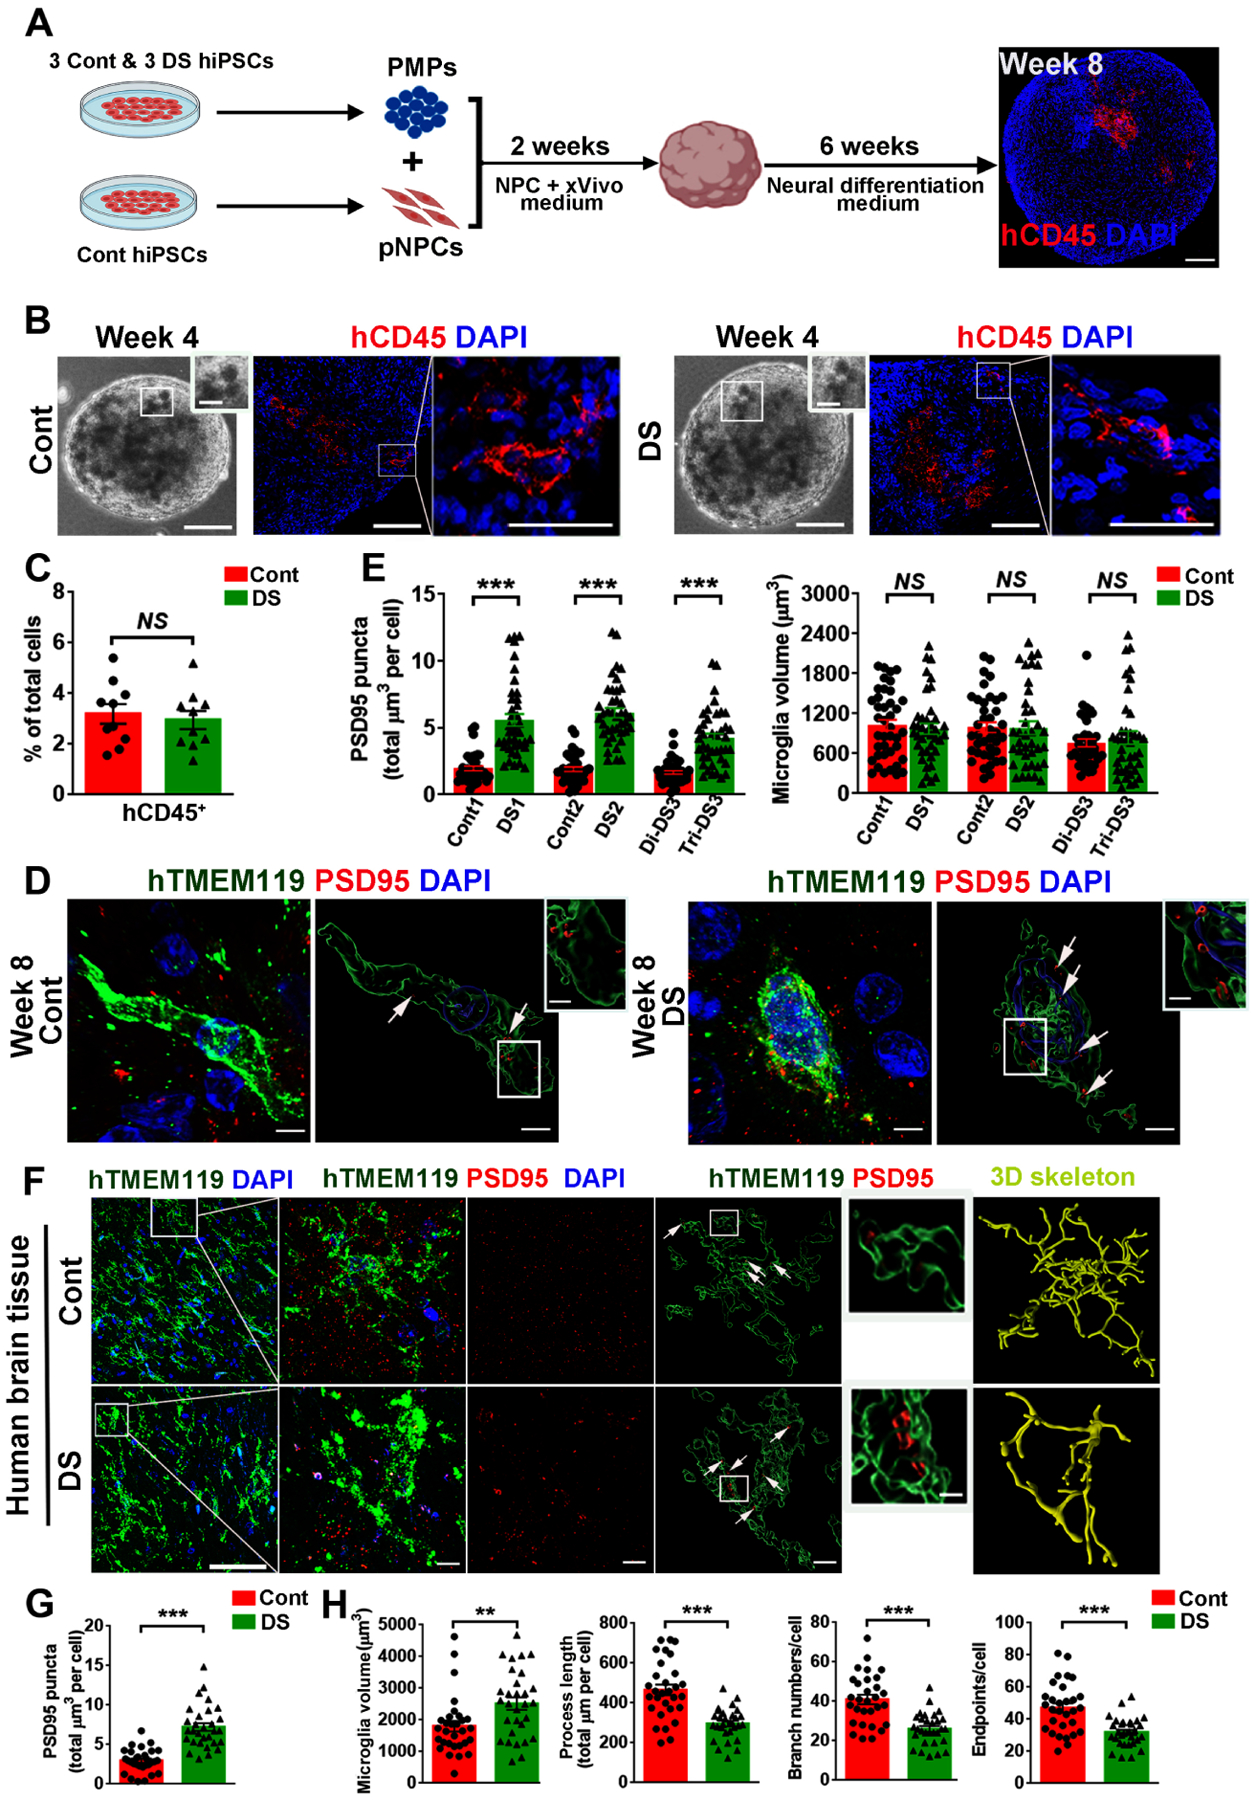
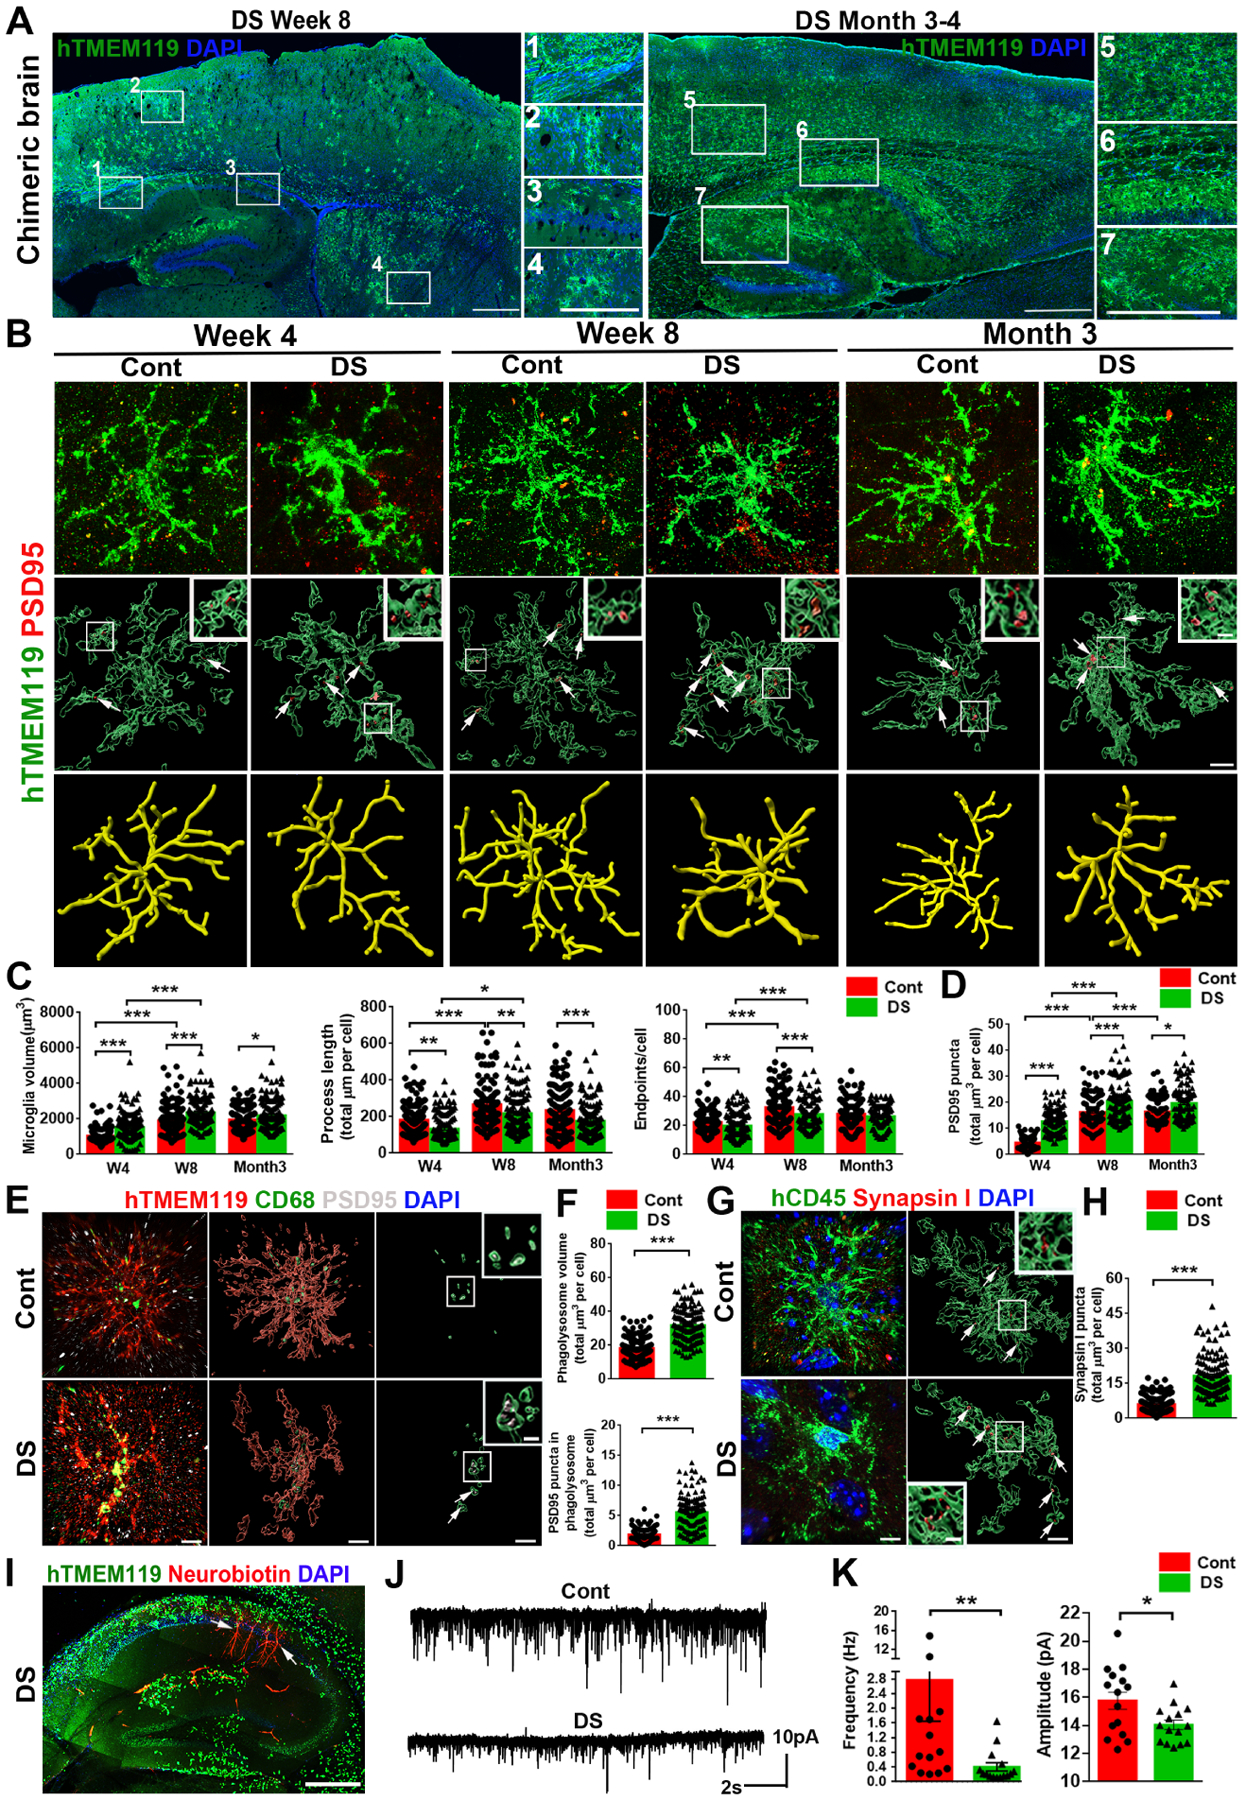
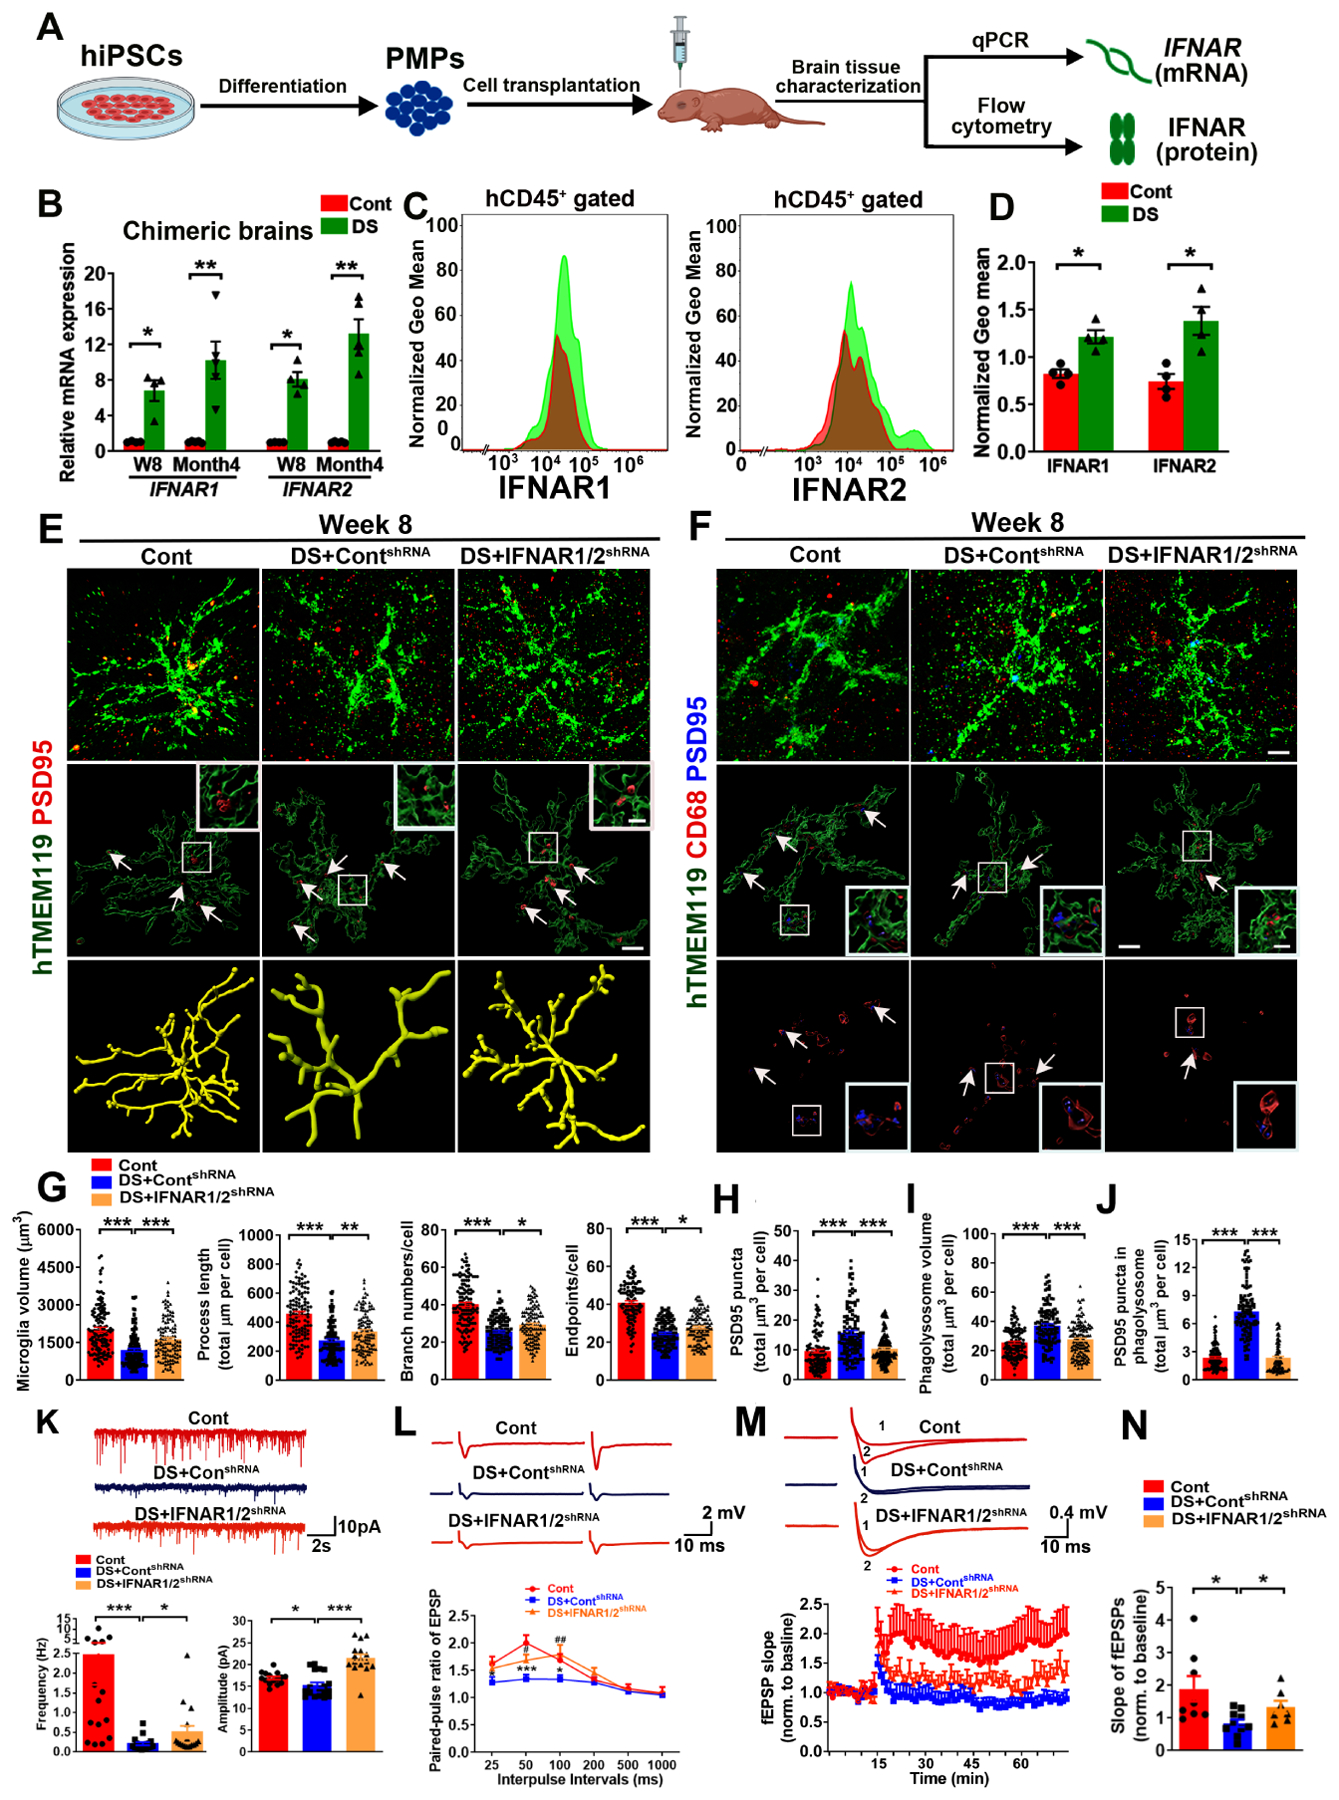
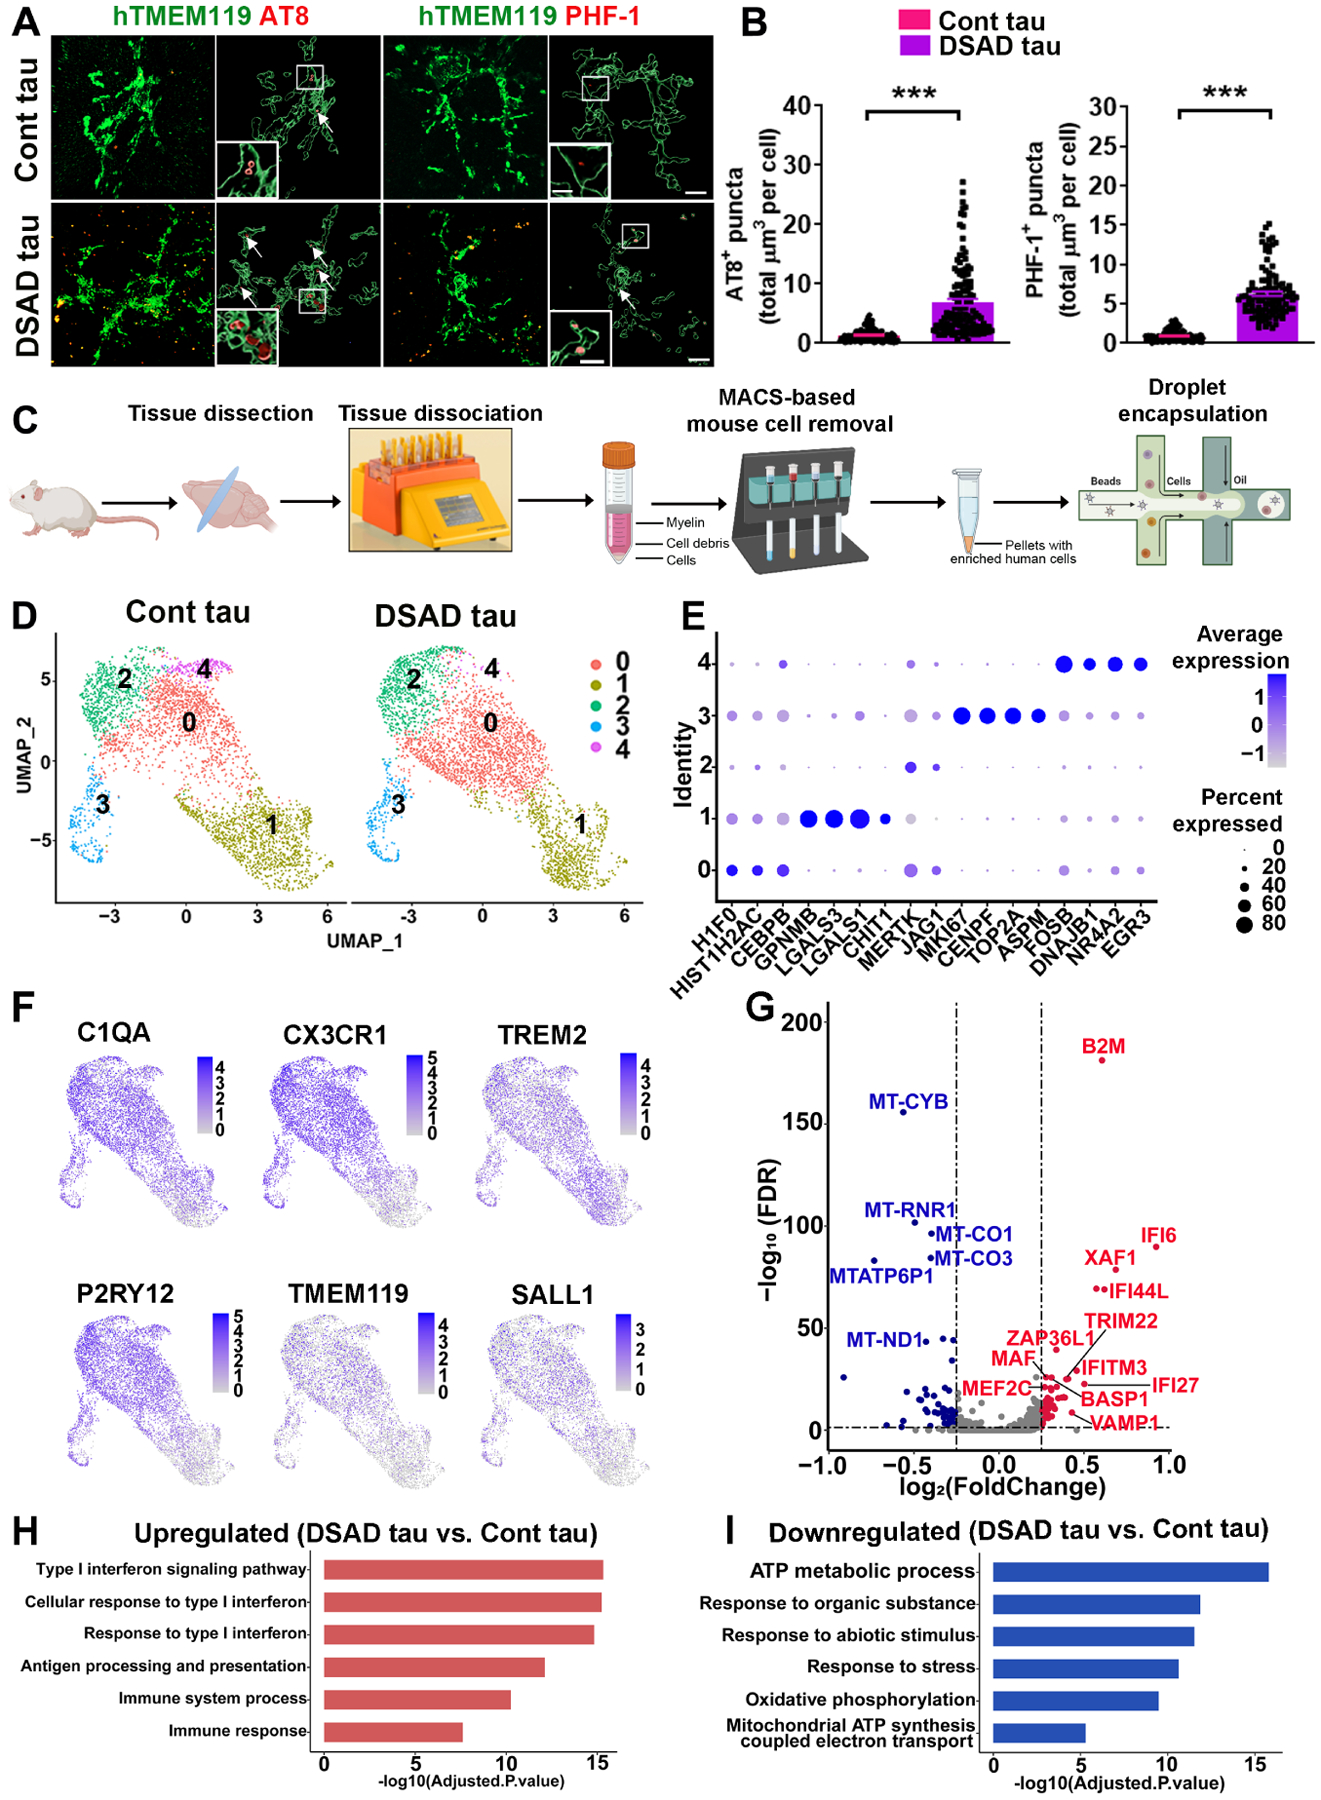
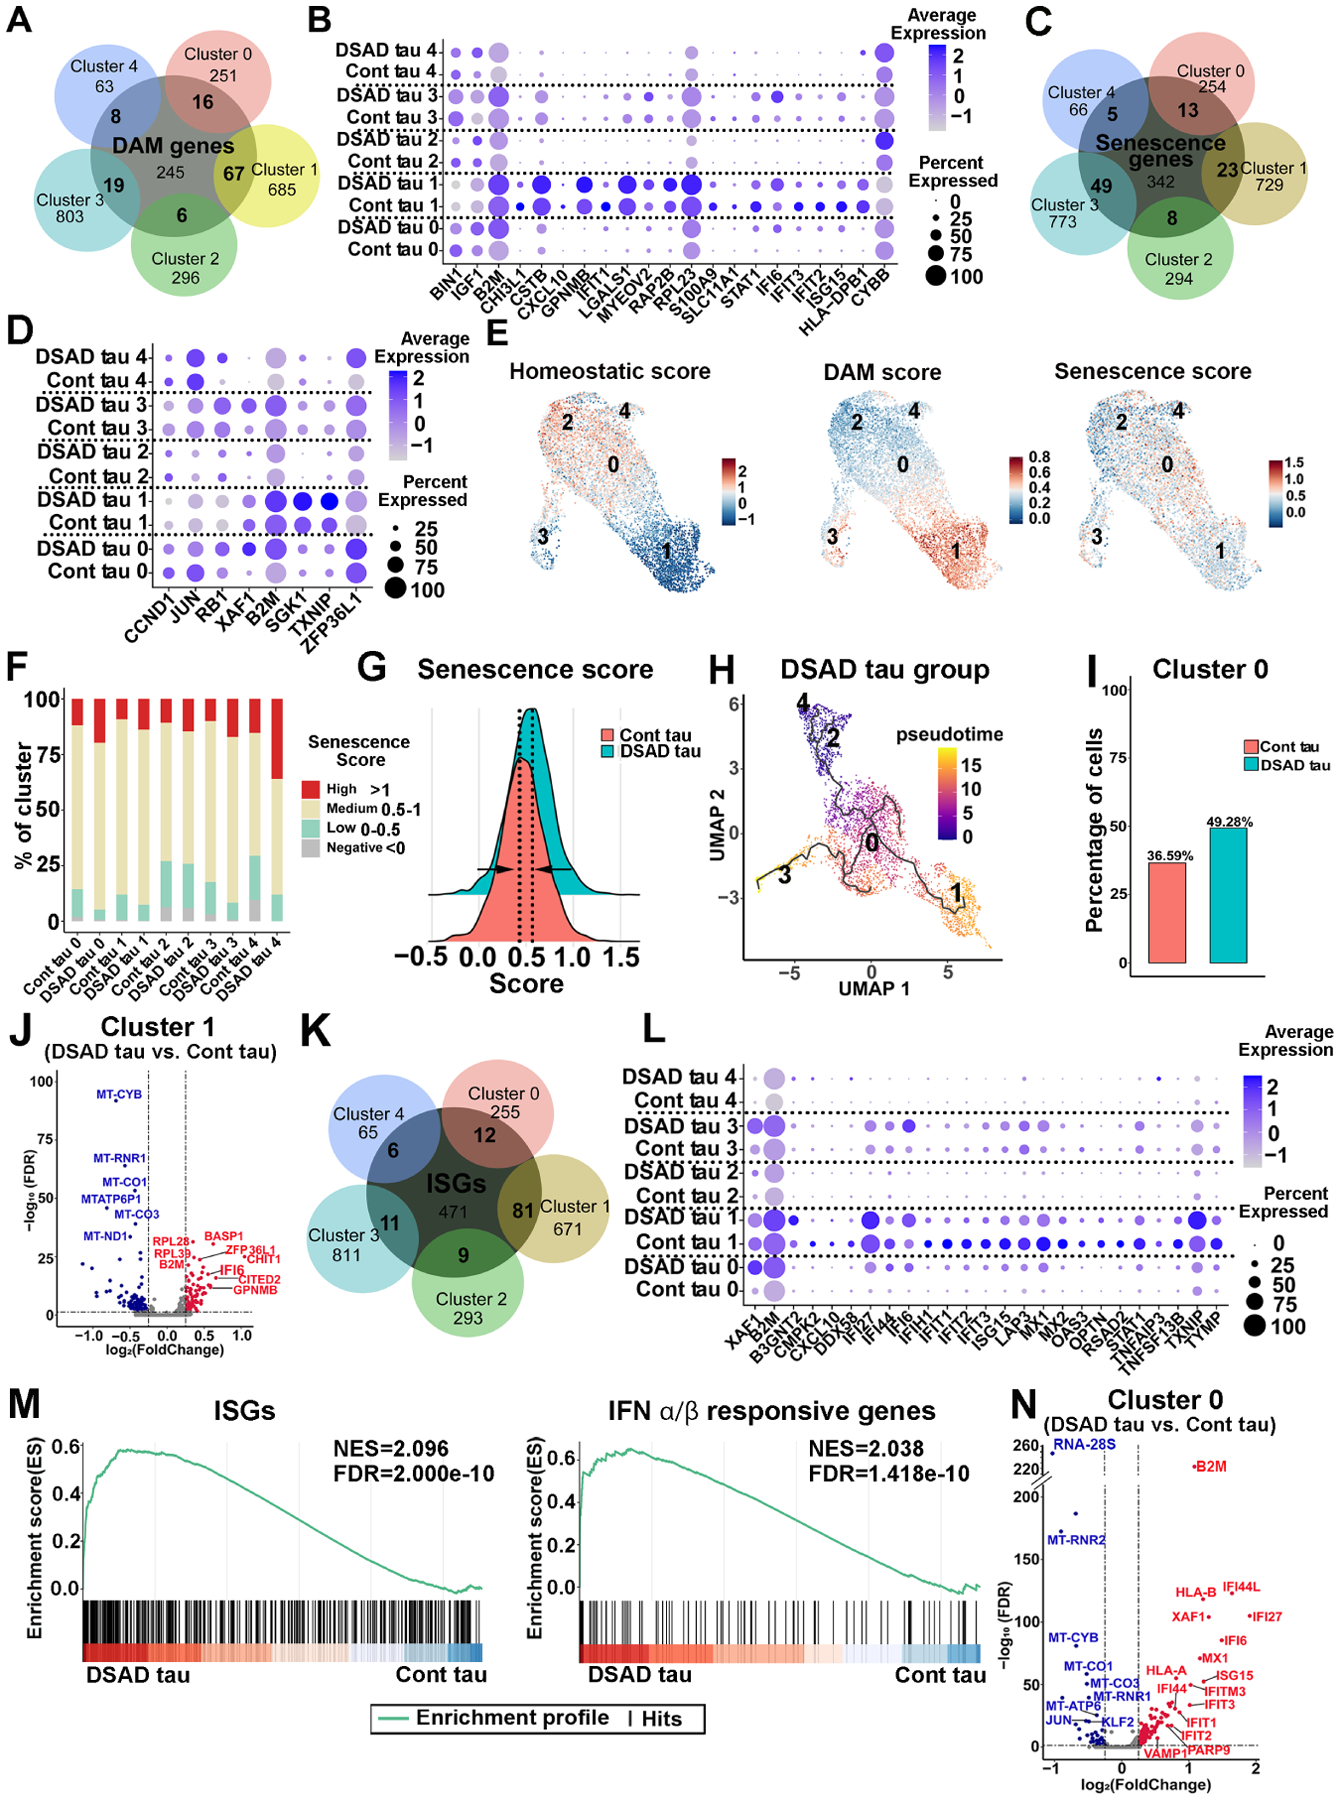
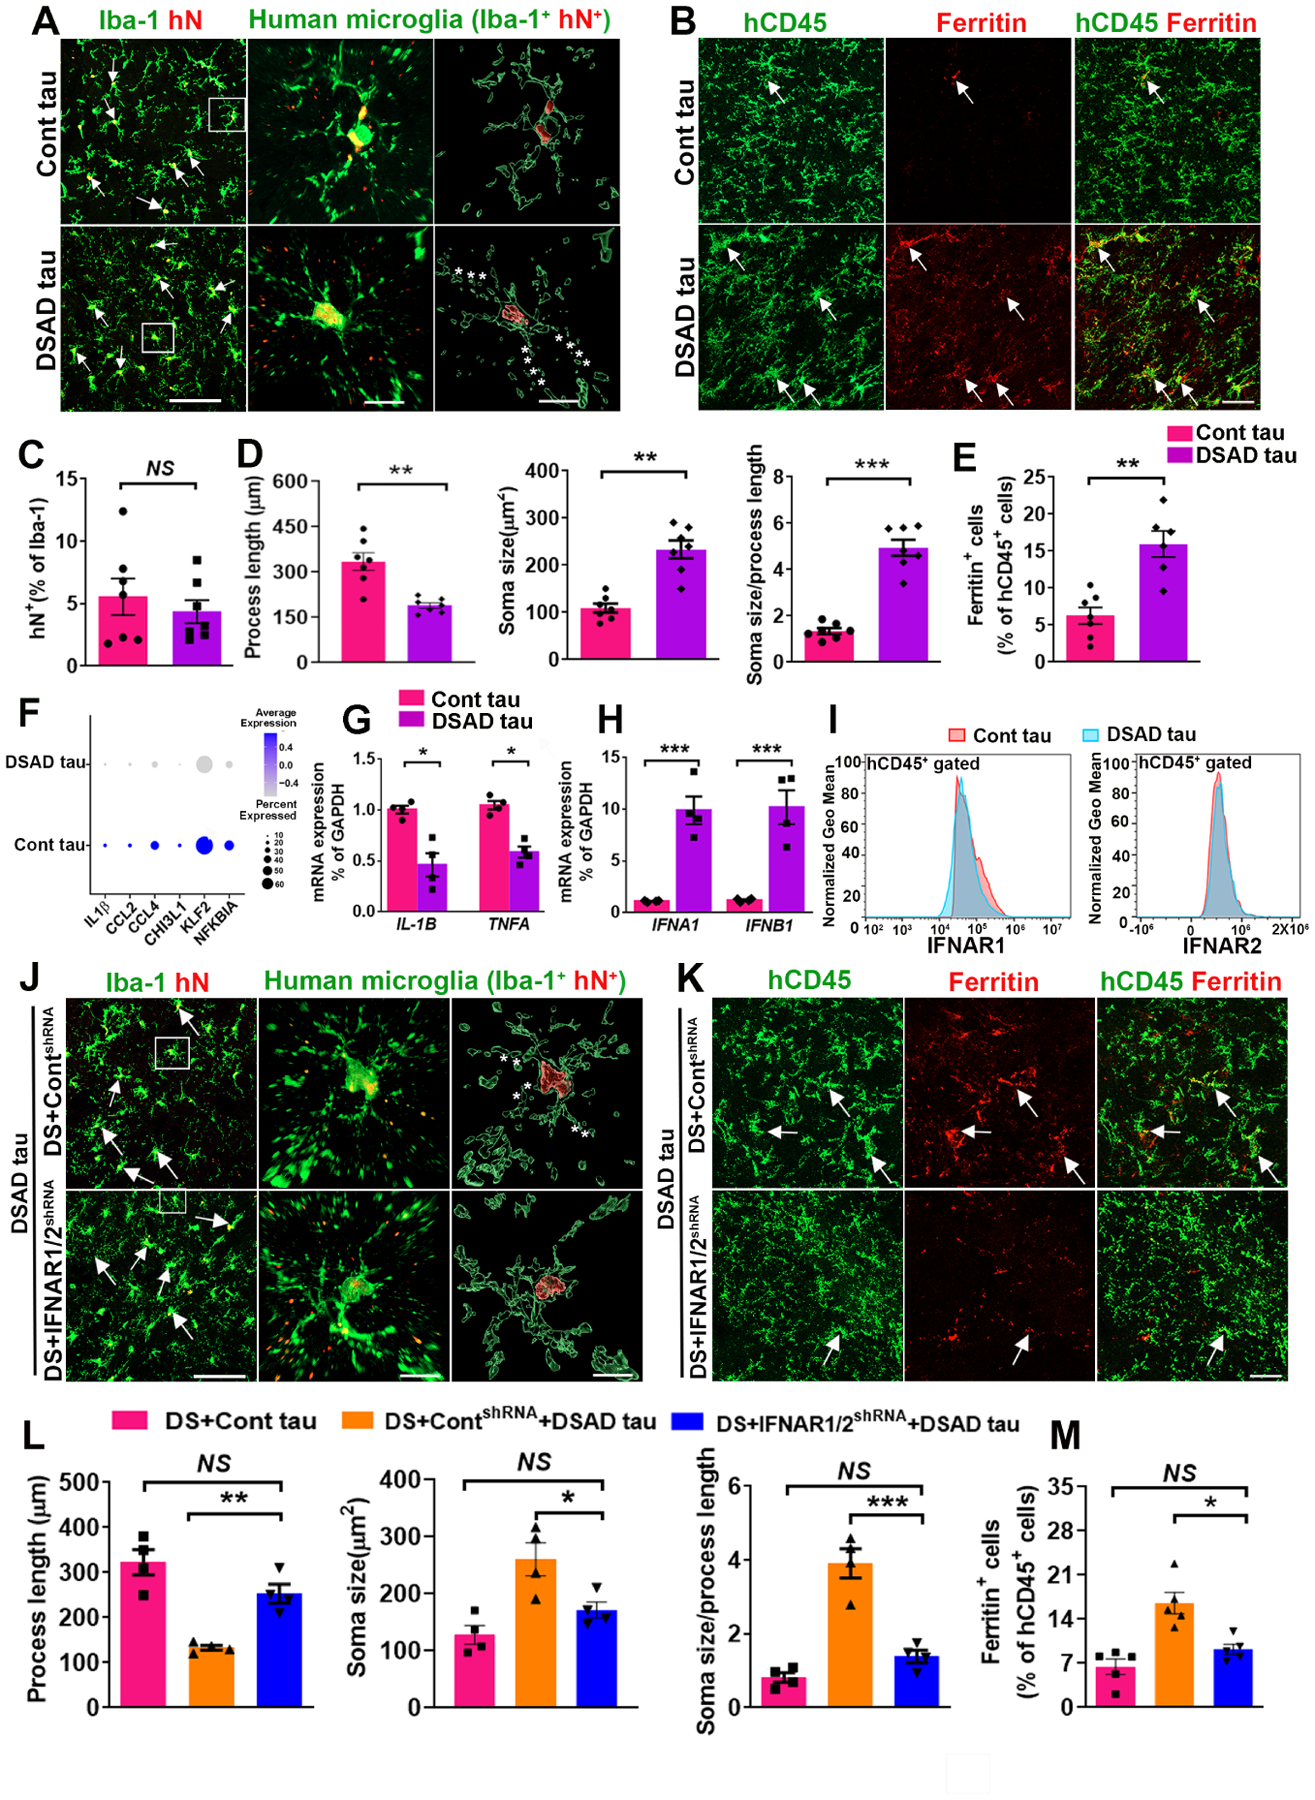
Microglia are critical in brain development and Alzheimer's disease (AD) etiology. Down syndrome (DS) is the most common genetic developmental disorder and risk factor for AD. Surprisingly, little information is available on the impact of trisomy of human chromosome 21 (Hsa21) on microglial functions during DS brain development and in AD in DS. Using induced pluripotent stem cell (iPSC)-based organoid and chimeric mouse models, we report that DS microglia exhibit an enhanced synaptic pruning function, which alters neuronal synaptic functions. In response to human brain tissue-derived pathological tau, DS microglia undergo cellular senescence and exhibit elevated type-I-interferon signaling. Mechanistically, knockdown of Hsa21-encoded type I interferon receptors, IFNARs, rescues the DS microglial phenotypes both during brain development and in response to pathological tau. Our findings provide in vivo evidence that human microglia respond to pathological tau by exhibiting dystrophic phenotypes. Targeting IFNARs may improve DS microglial functions and prevent senescence.

Keywords: Alzheimer's disease; Down syndrome; human induced pluripotent stem cells; microglia; senescence; synaptic pruning; type I interferon.


Conflict of interest statement

Declaration of interests The authors declare no competing interests.

Figures

Fig 1.
Fig 1.. Characterization of DS hiPSC-derived PMPs.
(A) Schematic representation of the generation and characterization of PMPs. This drawing was created using BioRender.com. (B) Representative images of CD235+, CD43+, Ki67+ cells, and FISH analysis in PMPs. Scale bars: 20 μm,10 μm, and 5 μm. (C) Quantification of CD235+, CD43+, CD235+/CD43+, and Ki67+ PMPs derived from the three pairs of Cont and DS hiPSC lines (n=3). (D) The heatmap showing all DEGs between Cont and DS PMPs. (E-F) GO analyses of the upregulated and downregulated DEGs in the PMPs. (G) A volcano plot illustrating downregulated (blue) and upregulated (red) DEGs in PMPs.
Fig 2.
Fig 2.. Abnormal development and function of DS microglia in cerebral organoids and human brain tissues.
(A) A schematic representation of developing microglia-containing cerebral organoids. This drawing was created using BioRender.com. Scale bar: 100 μm. (B) Representative images of hCD45+ microglia in Cont and DS organoids. (C) Quantification of the percentage of hCD45+ cells in total DAPI+ cells in organoids at week 8 (n=10, the data were pooled from the three pairs of organoids). (D) Representative raw fluorescent super-resolution and 3D surface rendered images showing colocalization of hTMEM119+ and PSD95+ staining in week 8 organoids. Scale bars: 5 μm and 1 μm. (E) Quantification of PSD95+ puncta inside hTMEM119+ microglia and microglial volume at week 8 (n=3, the experiments were repeated 3 times, each dot represents one microglia). (F) Representative images of hTMEM119 and PSD95 staining in hippocampal slices from a Cont and a DS individual. Arrows indicate PSD95+ puncta. Scale bar: 50 μm, 5 μm and 1 μm. (G, H) Quantification of PSD95+ puncta inside microglia, microglial volume, process length, branch numbers, and endpoints (n=30 microglia/group). Student’s t test, **P < 0.01 and ***P < 0.001. Data are presented as mean ± SEM.
Fig 3.
Fig 3.. Modeling DS microglial phenotypes in human-mouse microglial chimeras.
(A) Representative images from sagittal brain sections showing the distribution of transplanted DS hiPSC-derived microglia at week 8 and 3 to 4 months. Scale bar: 1 mm and 500 μm. (B) Representative images showing colocalization of hTMEM119+ and PSD95+ staining at 4, 8 weeks, and 3 months post-transplantation. Arrows indicate PSD95+ puncta. Scale bar: 5 μm and 1μm. (C, D) Quantification of microglial volume, process length, endpoints, and PSD95+ puncta inside microglia (n=120–160 microglia from 3–5 mice/group). (E) Representative images showing colocalization of hTMEM119+CD68+ PSD95+ staining of week 8 chimeras. Arrows indicate PSD95+ puncta in the CD68+ phagolysosome. Scale bar: 5 μm and 1 μm. (F) Quantification of CD68+ phagolysosome volume and PSD95+ puncta inside CD68+ phagolysosomes (n=120 microglia from 4 mice/group). (G) Representative images of hCD45 and synapsin I staining in week 8 of chimeras. Arrows indicate synapsin I+ puncta. Scale bar: 5 μm and 1 μm. (H) Quantification of synapsin I+ puncta in hCD45+ microglia (n=120 microglia from 4 mice/group). (I) A representative image of hTMEM119+ microglia and Neurobiotin+ recorded neurons in the hippocampus of DS microglia chimera. Arrows indicate Neurobiotin+ recorded neurons. Scale bar: 500 μm. (J) Representative traces of mEPSCs in CA1 hippocampal pyramidal neurons. (K) Quantification of the frequency and amplitude of mEPSCs (n=14–15 neurons from 4–5 mice/group). Student’s t test, *P < 0.05 and **P < 0.01. Data are presented as mean ± SEM.
Fig 4.
Fig 4.. Knockdown of IFNARs rescues defective DS microglia in chimeras.
(A) A schematic diagram showing the experimental design. This drawing created using BioRender.com. (B) qPCR analysis of IFNAR1 and IFNAR2 mRNA expression in chimeras at week 8 and month 4 (n=4–5 mice/group). (C, D) Flow cytometry analysis and quantification of IFNAR1 and IFNAR2 expression in 4 months old chimeras (n=4). (E–F) Representative images of hTMEM119+PSD95+ and hTMEM119+CD68+ PSD95+ staining in 8week-old chimeras (n=113–136 microglia from 3–4 mice/group). Arrows indicate PSD95+ puncta and PSD95+ puncta inside CD68+ phagolysosome. Scale bars: 5 μm and 1 μm. (G) Quantification of microglial volume, process length, branch numbers, and endpoints (n=115–136 from 3–4 mice/group). (H) Quantification of PSD95+ puncta in hTMEM119+microglia (n=115–133 microglia from 3–4 mice/group). (I, J). Quantification of CD68+ phagolysosomes and PSD95+ puncta in CD68+ phagolysosomes (n=113–136 microglia from 3–4 mice/group). (K) Representative traces of mEPSCs in CA1 hippocampal pyramidal neurons. Quantification of the frequency and amplitude of mEPSCs (n=15–18 neurons from 3 mice/group). (L) Representative traces and quantification of PPR of EPSPs in 3–4 months old chimeras (n=9–12 slices from 3–4 mice/group). Asterisk represents Cont versus DS+ ContshRNA, and pound sign indicates DS+ContshRNA versus DS+IFNAR1/2shRNA. (M) Representative traces of baseline (1) and last 10 min (2) fEPSP after 4×100 Hz LTP induction. Quantification of LTP after LTP induction in 3–4 months old chimeras (n=7–10 slices from 3–4 mice/group). (N) Quantification of the last 10 min of fEPSP slope after LTP induction (n=7–10 slices from 3–4 mice/group). Student’s t test or One-way ANOVA test, *P < 0.05, **P < 0.01 and ***P < 0.001. Data are presented as mean ± SEM.
Fig 5.
Fig 5.. scRNA-seq analysis of DS microglial chimeras receiving injection of Cont or pathological DSAD tau.
(A) Representative images of hTMEM119, AT8, and PHF-1 staining in 4 to 5-month-old chimeras receiving injection of Cont or DSAD tau at 8 weeks. Arrows indicate AT8+ or PHF-1+ p-tau. Scale bars: 7 μm and 3 μm. (B) Quantification of AT8+ and PHF-1+ p-tau in microglia (n=110–127 from 3–4 mice/group). (C) A schematic diagram showing the design of the scRNA-seq experiment. This drawing was created using BioRender.com. (D) A UMAP plot showing independent subclusters (clusters 0–4) from Cont and DSAD tau groups. (E) A dot plot showing the representative conserved markers from each subcluster. (F) UMAP plots with dots (representing cells) colored by the expression levels of human microglial genes. (G) A volcano plot illustrating downregulated (blue) and upregulated (red) DEGs. (H, I) GO enrichment analyses of the upregulated and downregulated DEGs. Student’s t test, ***P < 0.001. Data are presented as mean ± SEM.
Fig 6.
Fig 6.. Pathological tau induces DAM, senescence, and ISG signatures in DS microglia.
(A) A Venn diagram showing the overlap between DAM genes and the gene markers defined from each cluster. (B) A dot plot representing the expression of DAM DEGs in each cluster from the Cont and DSAD tau groups. (C) A Venn diagram showing the overlap between senescence genes and gene markers defined from each cluster. (D) Dot plot showing the DEGs expression of the senescence genes signature in every subcluster from DSAD tau and Cont tau groups. (E) Feature plots showing the scoring of homeostatic, DAM, and senescence signatures. (F) Bar plots of the percentage of cells with a negative (<0), low (0–0.5), medium (0.5–1), or high (>1) senescence score in the custom senescence signature in each cluster. (G) A ridge plot showing the senescence score in DSAD and Cont tau groups. (H) UMAP representation of the trajectory of DS microglia in response to DSAD tau. Cells are colored by pseudotime. (I) Cell ratios of cluster 0 in the Cont and DSAD tau groups. (J) A Volcano plot illustrating the downregulated (blue) and upregulated (red) DEGs in cluster 1. (K) A Venn diagram showing the overlap between ISGs and the gene markers defined from each cluster. (L) A Dot plot displaying the ISG DEGs in each cluster from the Cont and DSAD tau groups. (M) GSEA plots showing enrichment of ISGs and IFNα/β responsive genes in DSAD and Cont tau groups (NES: normalized enrichment score, FDR: false discovery rate). (N) A Volcano plot showing the downregulated (blue) and upregulated (red) DEGs in cluster 0.
Fig 7.
Fig 7.. Knockdown of IFNARs rescues pathological tau-induced senescence in DS microglia.
(A) Representative images of Iba+/hN+ human microglia in Cont and DSAD tau groups. Arrows indicate Iba+/hN+ human microglia. Asterisks indicate fragmented processes. Scale bars: 50 μm and 10 μm. (B) Representative images showing colocalization of hCD45+ and Ferritin+ staining in Cont and DSAD tau groups. Arrows indicate Ferritin+ and/or hCD45+ staining. Scale bar: 50 μm. (C) Quantification of the percentage of hN+ in Iba-1+ cells (n=7 mice/group). (D) Quantification of the process length, soma size, and soma size/process length cells (n=7 mice/group). (E) Quantification of the percentage of Ferritin in hCD45+cells (n=6–7 mice/group). (F) A Dot plot representing the expression of the inflammation-related genes IL1B, CCL2, CCL4, CHI3L1, KLF2, NFKBIA identified from scRNA-seq. (G) qPCR analysis of IL-1B and TNFA mRNA expression (n=4 mice/group). (H) qPCR analysis of IFNA1 and IFNB1 mRNA expression (n=4 mice/group). (I) Flow cytometry analysis showing the expression of IFNAR1 and IFNAR2 in Cont tau and DSAD tau group (n=2 mice/group). (J) Representative images of human microglia (Iba+hN+) in chimeras. Arrows indicate Iba+/hN+ human microglia. Asterisks indicate fragmented processes. Scale bar: 50 μm and 10 μm. (K) Representative image showing colocalization of hCD45+ and Ferritin+ staining in chimeras. Arrows indicate Ferritin+ and/or hCD45+ staining. Scale bar: 50 μm. (L) Quantification of the process length, soma size, and soma size/process length (n=4 mice/group). (M) Quantification of the percentage of Ferritin+ in hCD45+ cells (n=5 mice/group). Student’s t test or One-way ANOVA test, *P < 0.05, **P < 0.01 and ***P < 0.001. Data are presented as mean ± SEM.

Comment in

References

    1. Abud EM, Ramirez RN, Martinez ES, Healy LM, Nguyen CHH, Newman SA, Yeromin AV, Scarfone VM, Marsh SE, Fimbres C, et al. (2017). iPSC-Derived Human Microglia-like Cells to Study Neurological Diseases. Neuron 94, 278–293 e279. - PMC - PubMed
    1. Alvarez-Lindo N, Baleriola J, de Los Rios V, Suarez T, and de la Rosa EJ (2019). RAG-2 deficiency results in fewer phosphorylated histone H2AX foci, but increased retinal ganglion cell death and altered axonal growth. Sci Rep 9, 18486. - PMC - PubMed
    1. Araya P, Waugh KA, Sullivan KD, Nunez NG, Roselli E, Smith KP, Granrath RE, Rachubinski AL, Enriquez Estrada B, Butcher ET, et al. (2019). Trisomy 21 dysregulates T cell lineages toward an autoimmunity-prone state associated with interferon hyperactivity. Proc Natl Acad Sci U S A 116, 24231–24241. - PMC - PubMed
    1. Avelar RA, Ortega JG, Tacutu R, Tyler EJ, Bennett D, Binetti P, Budovsky A, Chatsirisupachai K, Johnson E, Murray A, et al. (2020). A multidimensional systems biology analysis of cellular senescence in aging and disease. Genome Biol 21, 91. - PMC - PubMed
    1. Bar E, and Barak B (2019). Microglia roles in synaptic plasticity and myelination in homeostatic conditions and neurodevelopmental disorders. Glia 67, 2125–2141. - PubMed

Publication types