. 2022 Jul 7;185(14):2591-2608.e30.
doi: 10.1016/j.cell.2022.06.007.

Dissecting the treatment-naive ecosystem of human melanoma brain metastasis

Affiliations

Dissecting the treatment-naive ecosystem of human melanoma brain metastasis

Jana Biermann et al. Cell. .

Abstract

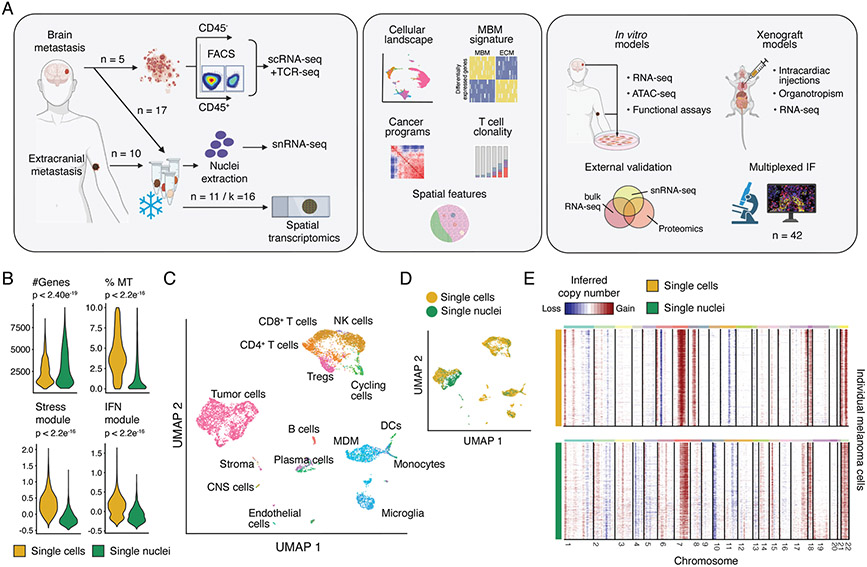
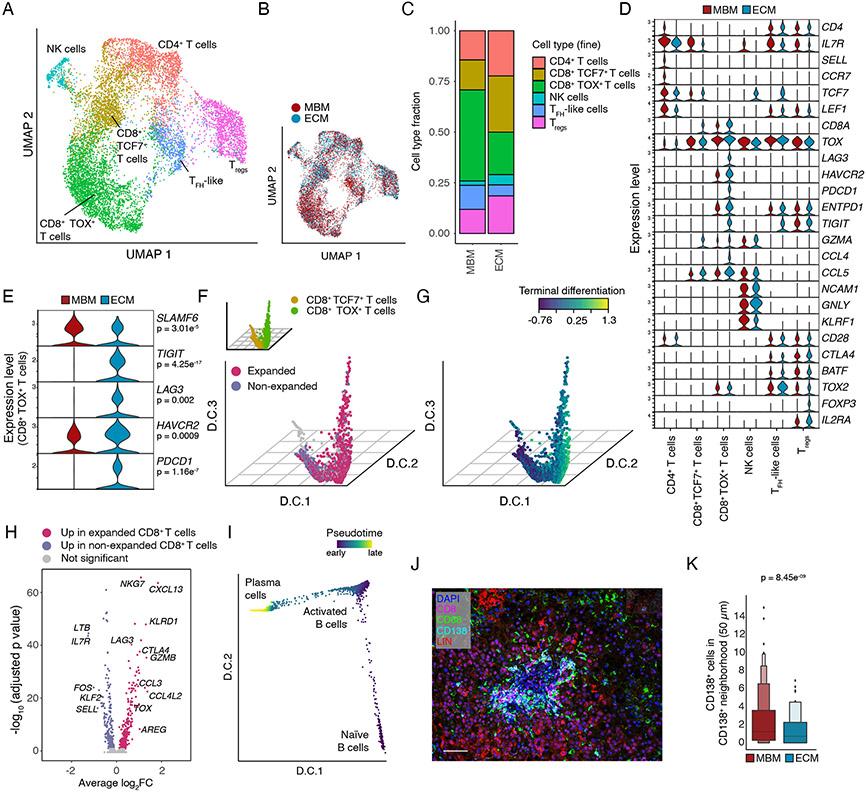
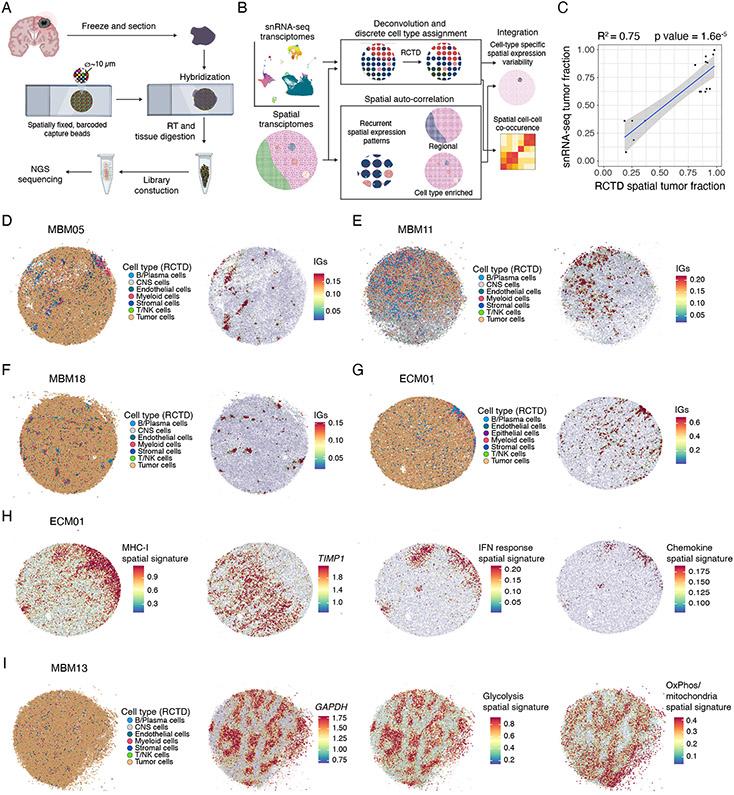
Melanoma brain metastasis (MBM) frequently occurs in patients with advanced melanoma; yet, our understanding of the underlying salient biology is rudimentary. Here, we performed single-cell/nucleus RNA-seq in 22 treatment-naive MBMs and 10 extracranial melanoma metastases (ECMs) and matched spatial single-cell transcriptomics and T cell receptor (TCR)-seq. Cancer cells from MBM were more chromosomally unstable, adopted a neuronal-like cell state, and enriched for spatially variably expressed metabolic pathways. Key observations were validated in independent patient cohorts, patient-derived MBM/ECM xenograft models, RNA/ATAC-seq, proteomics, and multiplexed imaging. Integrated spatial analyses revealed distinct geography of putative cancer immune evasion and evidence for more abundant intra-tumoral B to plasma cell differentiation in lymphoid aggregates in MBM. MBM harbored larger fractions of monocyte-derived macrophages and dysfunctional TOX+CD8+ T cells with distinct expression of immune checkpoints. This work provides comprehensive insights into MBM biology and serves as a foundational resource for further discovery and therapeutic exploration.

Keywords: brain metastasis; chromosomal instability; melanoma; neuronal-like cell state; single-cell genomics; spatial transcriptomics; tumor-microenvironment.


Conflict of interest statement

Declaration of interests B.I. has received honoraria from consulting with Merck, Janssen Pharmaceuticals, Astra Zeneca, and Volastra Therapeutics. M.A.D. has been a consultant to Roche/Genentech, Array, Pfizer (New York, NY, United States of America), Novartis, BMS, GSK, Sanofi-Aventis (Bridgewater, NJ, United States of America), Vaccinex, Apexigen, EISAI, and ABM Therapeutics and he has been the PI of research grants to MD Anderson by Roche/Genentech (South San Francisco, CA, United States of America), GSK, Sanofi-Aventis, Merck, Myriad, and Oncothyreon. A.R. has received honoraria from consulting with CStone, Merck, and Vedanta, is or has been a member of the scientific advisory board and holds stock in Advaxis, Appia, Apricity, Arcus, Compugen, CytomX, Highlight, ImaginAb, ImmPact, ImmuneSensor, Inspirna, Isoplexis, Kite-Gilead, Lutris, MapKure, Merus, PACT, Pluto, RAPT, Synthekine, and Tango, has received research funding from Agilent (Santa Clara, CA, United States of America) and from Bristol-Myers Squibb through Stand Up to Cancer (SU2C), and patent royalties from Arsenal Bio. T.E. has acted as a consultant for Almiral Hermal, Bristol-Myers Squibb, MSD, Novartis, Pierre Fabre, and Sanofi. E.Z.M. is a consultant for Curio Bioscience. The other authors do not declare competing interests.

Figures

Figure 1.
Figure 1.. Study design and comparison of fresh vs. frozen profiling
(A) Study design including specimens, analyses and validation approaches. (B) Quality-control parameters of a matched MBM specimen profiled with sc/snRNA-seq. (C,D) UMAP embedding with (C) cell type assignment and (D) profiling method. (E) Inferred copy number alterations (CNAs) from a matched MBM specimen processed with scRNA-seq (top) and snRNA-seq (bottom).
Figure 2.
Figure 2.. Cellular and genomic landscape of MBM
(A) UMAP of integrated transcriptomes of 22 MBM and 10 ECM samples showing cell type assignment, (B) sequencing, and (C) metastatic site. (D) Cell type distribution of MBM/ECM profiled by snRNA-seq. (E) UMAP of integrated malignant cell transcriptomes profiled by snRNA-seq data and indicated cycling status and tissue origin (inset). (F) CNA inference in cancer cells (rows) across chromosomes (columns) with amplifications (red) and deletions (blue) based on method (far left bar), tissue site (middle bar) and patient (inner bar). (G) Fraction of genome altered in MBMWES and ECMWES from Fischer et al. (H) Frequency of micronuclei per visual field in patient-derived MBM (5B1 and 12-273 BM) or ECM (4L and 12-273 LN, respectively) cell line cultures. (I) Relative in vitro migration of MBM/ECM models as in (H). (J) Design for in vivo experiments using 5B1 and 4L models. (K) Frequency of animals with/without MBM and (L) ECM burden from experiment in 5B1 and 4L injection as in (J). Bars, mean±SD. Wilcoxon rank-sum test.
Figure 3.
Figure 3.. Cancer cell specific programs of MBM profiled by snRNA-seq
(A,B) Module scores of (A) MITF and (B) AXL programs in melanoma cells of MBM/ECM. Wilcoxon rank-sum test. (C) DEGs between MBM and ECM cancer cells. Patient and tissue origin of individual cells (ticks) indicated on top bar. Selected genes (rows) indicated with gene name. (D) Pathway module scores of selected, differentially enriched pathways (adjusted p<0.0001) in MBM/ECM melanoma cells. (E) Differential inferred protein activity in melanoma cells from MBM/ECM (indicated by ticks on top bar) with selected rows (proteins) highlighted. (F,G) Scoring of MBM signature on MBMbulk/ECMbulk from Fischer et al. and (G) mouse xenograft-derived MBM/ECM transcriptomes from 5B1/4L and 12-273 BM/LN; Wilcoxon rank-sum test. (H) Spearman correlation of individual programs from cancer cells and metaprograms (MP) (black boxes) using KINOMO; left bar indicating tissue origin. (I) Normalized gene contribution of MPs (columns) identified in (H) and biological function (left). (J,K) Count of programs from tissue sites (J) and individual samples (K) in metaprograms from (H). (L) Log2FC of DEGs in MBM with recurrent identification in snRNA-seq (this study; x-axis), bulk RNA-seq (Fischer et al.; y-axis) and proteomics datasets (Kleffman et al.; dot size). (M,N) Exemplary immunofluorescence micrograph showing nuclei (DAPI), CD8, NCAM1, CD68, CD138, and SOX10/HMB-45 (=LIN) expression in MBM (M) and ECM (N). Scale bar=100 μm. (O) Fraction of NCAM1+ melanoma (LIN+) cells in MBM/ECM (boxplot indicating mean + quartiles) and (P) intensity of NCAM1 in melanoma cells. Wilcoxon rank-sum test.
Figure 4.
Figure 4.. Landscape and differences of myeloid cells in MBM/ECM profiled by snRNA-seq.
(A) UMAP of integrated myeloid cells from 17 MBM and 10 ECM samples, indicating cell type assignment. (B) UMAP as in (A) with tissue origin. (C) Fractions of cell types in the myeloid compartment of MBM and ECM. (D) Violin plots of marker genes in myeloid cells separated by tissue origin. Columns indicate cell type assignment. Rows represent selected marker genes. (E) Diffusion component (D.C.) analysis of monocytes/macrophages colored by FTL expression (left), cell type (top right) and tissue origin (bottom right). (F,G) RNA velocity-based UMAP of MDM-c1 and FTL+ MDM in MBM showing FTL expression (F) with cell type assignment (inset) and pseudotime (G). (H) Violin plots of selected genes across all MDMs and separated by tissue site; MAST, adj. p-value as indicated. (I,J) Fraction of macrophages (CD68+ cells, boxplot indicating mean and quartiles) (I) and intensity of CD163 protein (J) measured by IF in an independent patient cohort of MBM/ECM. Wilcoxon rank-sum test. (K) D.C. 1–3 of microglia profiled showing two major populations, microglia (MG)-1 and MG-2. (L) Volcano plot of DEGs between MG-1 (activated) and MG-2 subpopulations.
Figure 5.
Figure 5.. Transcriptional and clonal T and B cell landscape in MBM.
(A,B) UMAP embedding of T/NK cells profiled by snRNA-seq showing cell type assignment (A) and tissue origin (B). (C) Fraction of T/NK cell subsets shown in (A). (D) Violin plots of selected genes (rows) in T/NK cell subsets (columns) and separated by tissue origin. (E) Violin plots of CD8+ TOX+ T cells profiled by snRNA-seq showing differentially expressed immune checkpoints (rows) by tissue origin. MAST, adj. p-value as indicated. (F) D.C. 1-3 of CD8+ T cells (profiled by scRNA-seq) indicating subsets (TCF7+ or TOX+, inset) and clonal expansion. (G) T cell terminal differentiation signature score on in D.C. embedding shown in (F). (H) Volcano plot depicting DGE of expanded and non-expanded CD8+ T cells in MBM profiled by scRNA-seq. (I) D.C. embedding of B cell differentiation showing pseudotime projection in B and plasma cells profiled by sc/snRNA-seq. (J) Exemplary IF micrograph showing plasma cell aggregates in an MBM. Scale bar = 100 μm. (K) Box plot showing local neighborhood in MBM and ECM quantifying number of CD138+ plasma cells in direct vicinity of CD138+ plasma cells as a metric for plasma cell clustering in tissue. Boxes display mean and quartiles, Wilcoxon rank-sum test.
Figure 6.
Figure 6.. Spatial features of metastatic melanoma.
(A) Illustration of SlideSeqV2 experimental protocol. (B) Illustration of computational approach to analyze spatially auto-correlated genes (using Moran’s I) in specific cell types and tumor regions, and measurement of cellular co-occurrence. RCTD, robust cell-type decomposition. (C) Correlation of malignant cell fraction in spatial transcriptomics and matched snRNA-seq. Error bands, 95% s.e. interval on the Spearman’s correlation coefficient. (D-G) RCTD-based cell type assignment (left puck) and spatial expression pattern of immunoglobulins (IG signature, right puck) in MBM05 (D), MBM11 (E), MBM18 (F) and ECM01 (G), identifying plasma cell clusters. (H) Spatial plots of ECM01 showing expression of MHC-I genes, TIMP1, type I interferon response genes, and chemokines (pucks from left to right). (I) Malignant cell rich MBM13 with spatial plots showing expression of GAPDH, a glycolysis signature, and antithetical expression of OxPhos signature (pucks from left to right).

References

    1. Ackermann AM, Wang Z, Schug J, Naji A, and Kaestner KH (2016). Integration of ATAC-seq and RNA-seq identifies human alpha cell and beta cell signature genes. Mol. Metab 5, 233–244. - PMC - PubMed
    1. Adamson SE, Griffiths R, Moravec R, Senthivinayagam S, Montgomery G, Chen W, Han J, Sharma PR, Mullins GR, Gorski SA, et al. (2016). Disabled homolog 2 controls macrophage phenotypic polarization and adipose tissue inflammation. J. Clin. Invest 126, 1311–1322. - PMC - PubMed
    1. Aibar S, González-Blas CB, Moerman T, Huynh-Thu VA, Imrichova H, Hulselmans G, Rambow F, Marine JC, Geurts P, Aerts J, et al. (2017). SCENIC: Single-cell regulatory network inference and clustering. Nat. Methods 14, 1083–1086. - PMC - PubMed
    1. Akbani R, Akdemir KC, Aksoy BA, Albert M, Ally A, Amin SB, Arachchi H, Arora A, Auman JT, Ayala B, et al. (2015). Genomic Classification of Cutaneous Melanoma. Cell 161, 1681–1696. - PMC - PubMed
    1. Alberti G (2021). GmAMisc: “Gianmarco Alberti” Miscellaneous. R package version 1.2.0.

Publication types