. 2022 Aug 4;185(16):2918-2935.e29.
doi: 10.1016/j.cell.2022.06.018. Epub 2022 Jul 7.

Tissue-resident memory and circulating T cells are early responders to pre-surgical cancer immunotherapy

Affiliations

Tissue-resident memory and circulating T cells are early responders to pre-surgical cancer immunotherapy

Adrienne M Luoma et al. Cell. .

Abstract

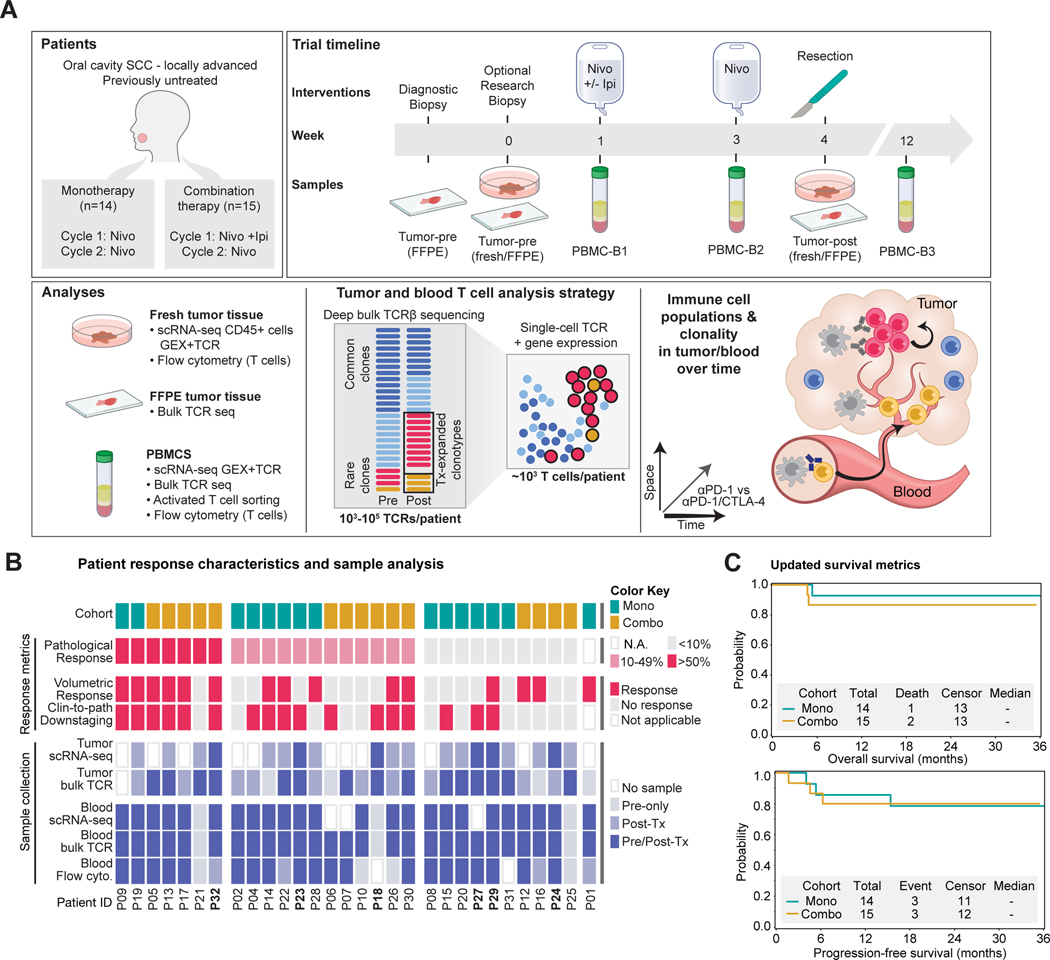
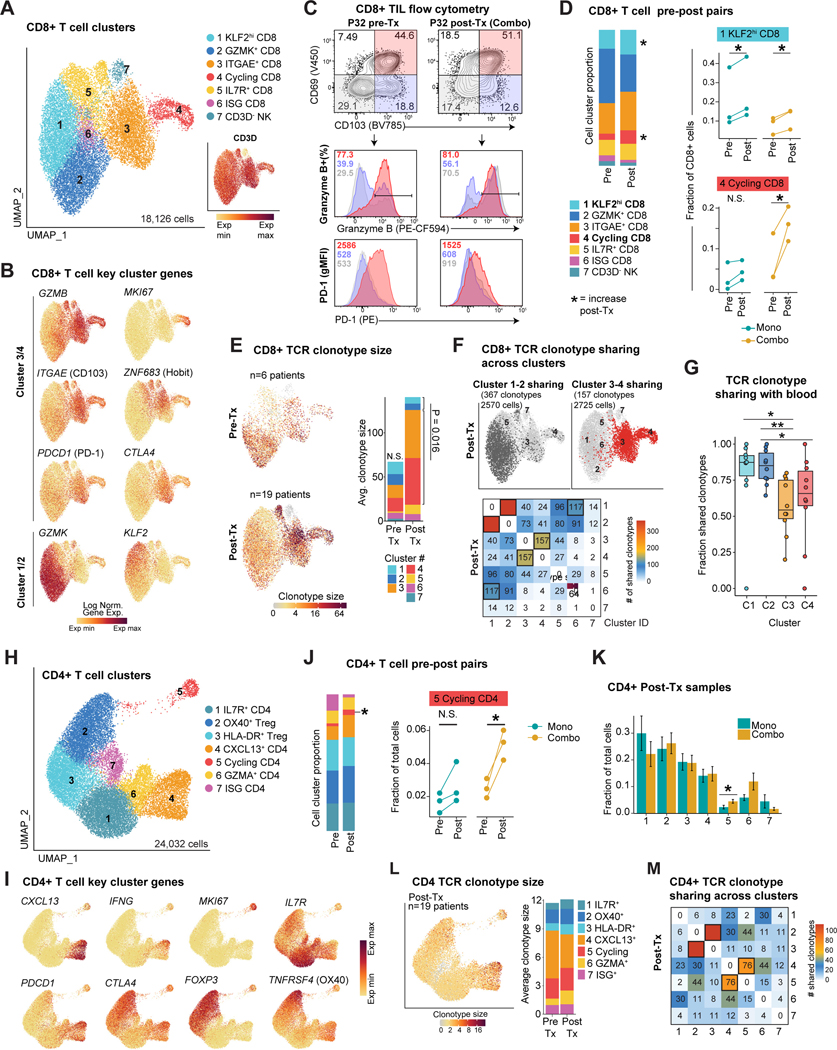
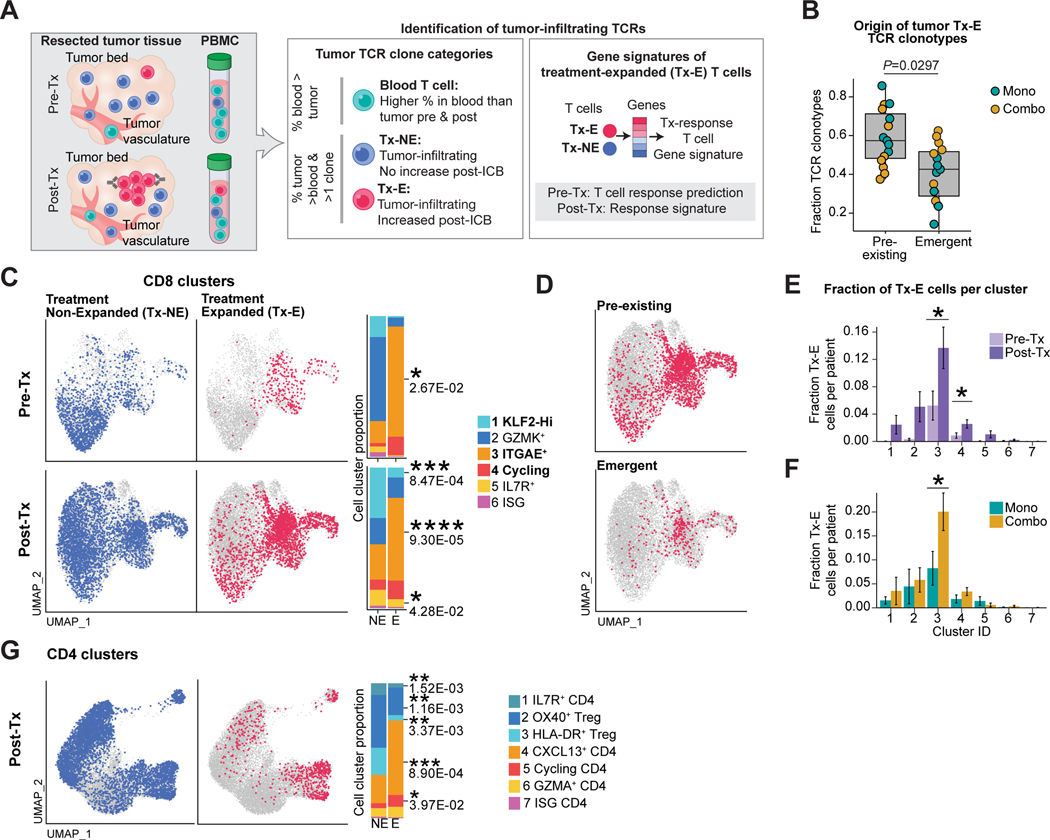
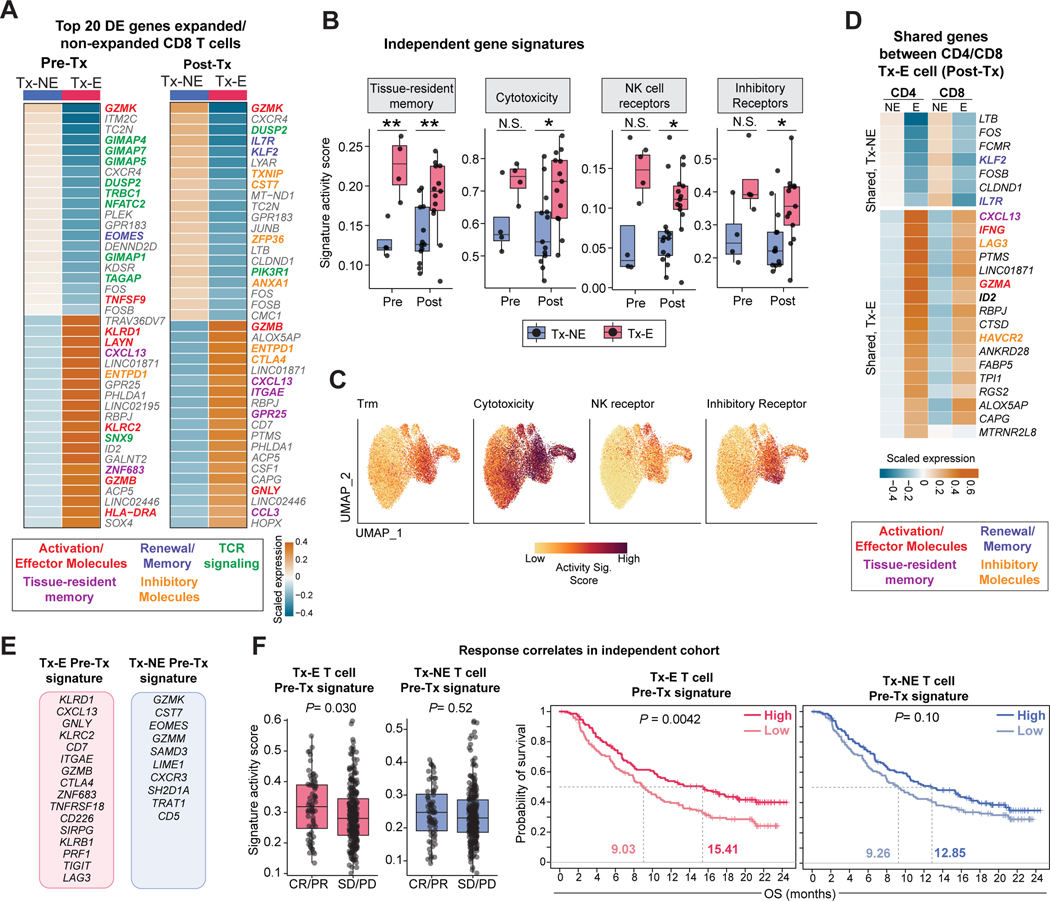
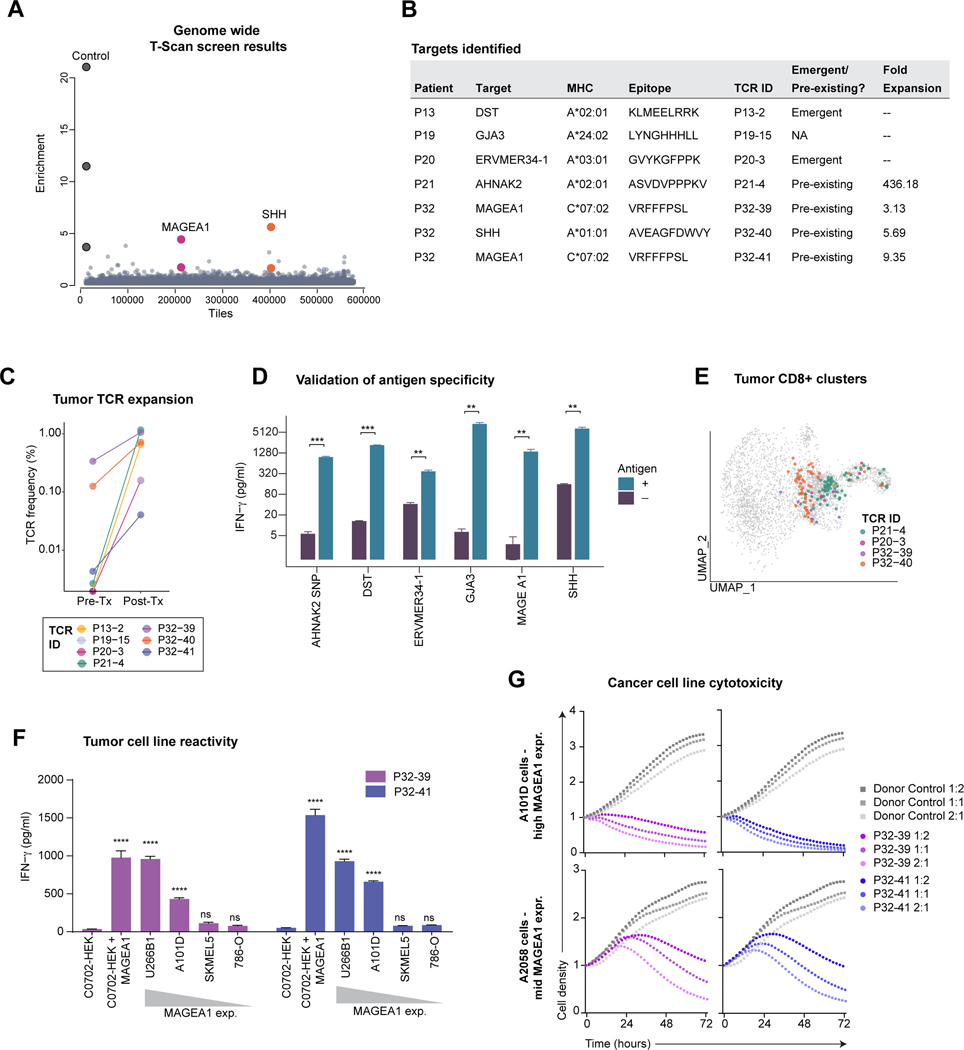
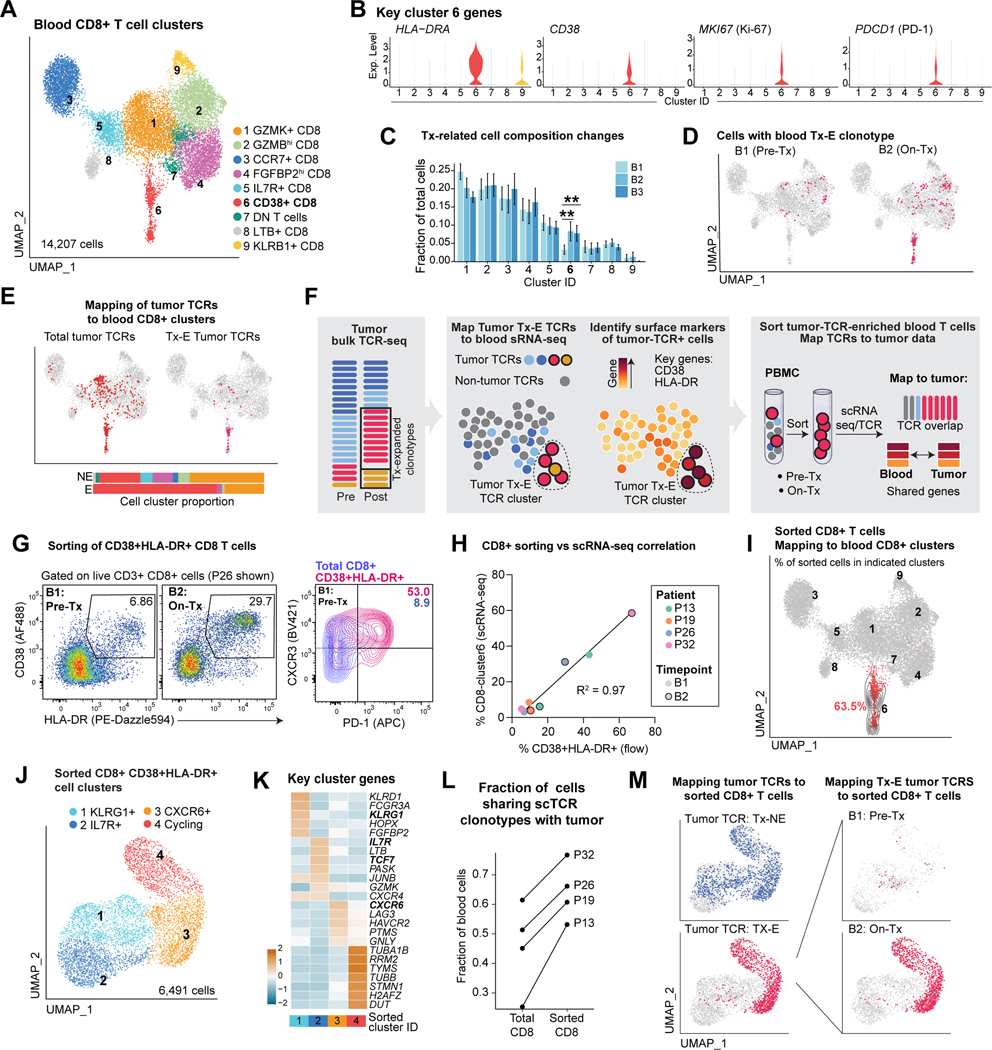
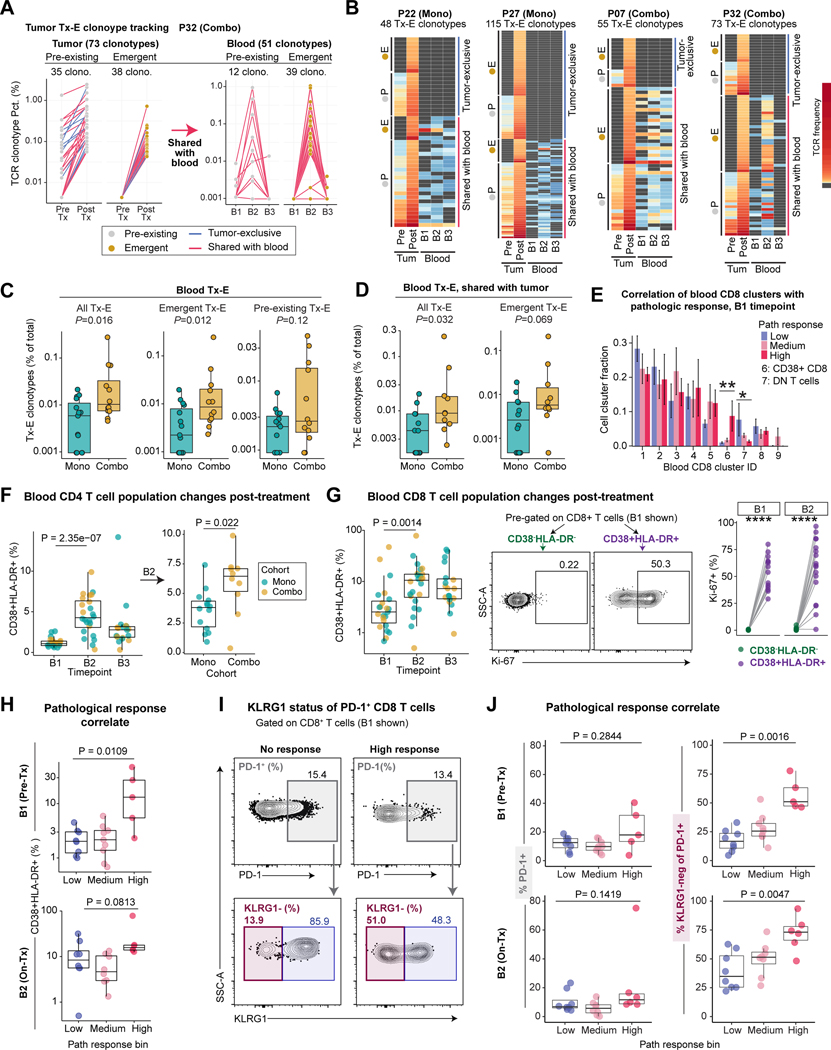
Neoadjuvant immune checkpoint blockade has shown promising clinical activity. Here, we characterized early kinetics in tumor-infiltrating and circulating immune cells in oral cancer patients treated with neoadjuvant anti-PD-1 or anti-PD-1/CTLA-4 in a clinical trial (NCT02919683). Tumor-infiltrating CD8 T cells that clonally expanded during immunotherapy expressed elevated tissue-resident memory and cytotoxicity programs, which were already active prior to therapy, supporting the capacity for rapid response. Systematic target discovery revealed that treatment-expanded tumor T cell clones in responding patients recognized several self-antigens, including the cancer-specific antigen MAGEA1. Treatment also induced a systemic immune response characterized by expansion of activated T cells enriched for tumor-infiltrating T cell clonotypes, including both pre-existing and emergent clonotypes undetectable prior to therapy. The frequency of activated blood CD8 T cells, notably pre-treatment PD-1-positive KLRG1-negative T cells, was strongly associated with intra-tumoral pathological response. These results demonstrate how neoadjuvant checkpoint blockade induces local and systemic tumor immunity.

Keywords: T cells; cancer; immunotherapy; neoadjuvant therapy; single-cell RNA sequencing; tissue-resident memory T cells.


Conflict of interest statement

Declaration of interests K.W.W. serves on the SAB of SQZ Biotech, Nextechinvest, Bisou Bioscience Company, and T-Scan Therapeutics and receives sponsored research funding from Novartis. He is a scientific co-founder of Immunitas Therapeutics. J.D.S. reports research support paid to the institution from Merck, BMS, Regeneron, Debiopharm; Consulting/Scientific Advisory Board/Travel fees: Genentech, Immunitas, Debiopharm, BMS, Nanobiotix, Tilos, Castle Biosciences, Astra Zeneca, LEK, Catenion, ACI Clinical, Astellas, Stimit, and Merck KGA; Expert witness fees. Stock options: Immunitas; Equity: Doximity. E.M.V.A. reports Advisory/Consulting: Tango Therapeutics, Genome Medical, Invitae, Enara Bio, Janssen, Manifold Bio, and Monte Rosa; Research support: Novartis, BMS; Equity: Tango Therapeutics, Genome Medical, Syapse, Enara Bio, Manifold Bio, Microsoft, and Monte Rosa; Travel reimbursement: Roche/Genentech; Patents: Institutional patents filed on chromatin mutations and immunotherapy response, and methods for clinical interpretation; intermittent legal consulting on patents for Foaley & Hoag. A.R. is a founder and equity holder of Celsius Therapeutics, an equity holder in Immunitas Therapeutics, and until August 31, 2020, was an SAB member of Syros Pharmaceuticals, Neogene Therapeutics, Asimov, and Thermo Fisher Scientific. From August 1, 2020, A.R. is an employee of Genentech and has equity in Roche.

Figures

Figure 1:
Figure 1:. Study design and clinical response data
A) Tumor and blood sample collection from HNSCC patients for single-cell RNA-seq and TCR repertoire analysis. B) Clinical metadata and analyses performed for each patient, including treatment cohort and clinical response metrics (volumetric response based on bidirectional tumor measurements, clinical and pathological downstaging at time of surgery, pathological response based on histological assessment). C) Overall and progression-free survival of patients for a median follow-up period of 36 months. See also Figure S1 and Table S1.
Figure 2:
Figure 2:. Identification of treatment-responsive CD8 and CD4 T cell populations
A) UMAP embedding of tumor CD8 T cells. Inset shows the normalized expression level of CD3D gene (n=19 post-Tx patients, n=6 pre-Tx patients). B) Normalized expression of selected markers defining tumor CD8 T cell clusters. C) Identification of CD103+C69+ Trm cells by flow cytometry, pre-gated on live/CD45+/CD3+/CD8+ T cells; quantification of PD-1 and granzyme B protein level for indicated populations (patient P32). D) Tumor CD8 T cell cluster frequency comparing paired pre-Tx and post-Tx samples (n = 6 patients). Right, fraction of tumor CD8 T cells in clusters 1 and 4 for pairs of pre-Tx and post-Tx samples split by cohort (two-sided paired t-test, * p<0.05). E) Single-cell TCR clonotype size projected onto a UMAP embedding for pre- and post-Tx samples. Bar plot displays the average clonotype size in each pre-Tx and post-Tx CD8 T cell cluster (C1&2 versus C3&4 paired two-sided Wilcoxon rank-sum test p=0.016). F) Sharing of expanded TCR clonotypes across tumor CD8 T cell clusters in post-Tx tumors. Top, clonotypes from tumor CD8 clusters 1 & 2 or clusters 3 & 4 and sharing across clusters. Bottom, heatmap indicating the number of shared expanded TCR clonotypes for each cluster pair in aggregated patients. Bold boxes indicate statistically significant sharing of expanded clonotypes between clusters, accounting for cluster size (FDR < 1e-05, one-sided Fisher’s exact test followed by Benjamini-Hochberg correction). G) Fraction of clonotypes from tumor CD8 T cell clusters 1–4 shared with blood bulk TCR repertoire; TCRs aggregated from individual patients (n=10, paired two-sided Wilcoxon rank-sum test, *p<0.05, **p<0.01). H) UMAP embedding showing sub-clusters of total tumor CD4 T cells (n=19 post-Tx samples and n=6 paired pre-Tx samples). I) Normalized expression of selected marker genes in tumor CD4+ T cells. J) Left, average tumor CD4 T cell cluster frequency in paired pre-Tx and post-Tx samples. Right, tumor CD4 cluster 5 frequency for paired pre-Tx and post-Tx tumor samples, split by cohort (paired two-sided t-test, * p<0.05) K) Comparison of tumor CD4 T cell cluster frequency between treatment cohorts in tumor post-Tx samples. Average and SEM are shown for each patient group (n=10 mono patients, n=9 combo patients, two-sided t-test, * p<0.05). L) Single-cell TCR clonotype size projected onto tumor CD4 UMAP visualization. Bar plot displays the average clonotype size for each pre-Tx and post-Tx CD4 T cell cluster. M) Sharing of expanded TCR clonotypes across tumor post-Tx CD4 T cells as in (F). Bold boxes indicate statistically significant clonotype sharing between clusters (FDR < 1e-05, one-sided Fisher’s exact test followed by Benjamini-Hochberg correction). See also Figure S2 and Table S2.
Figure 3:
Figure 3:. Treatment-induced clonal expansion of tissue-resident memory T cells.
A) Strategy for discovery of Tx-E and Tx-NE tumor TCRs. B) Classification of Tx-E TCR origin. Fraction of each clonotype category is shown for individual patients (pre-existing vs emergent, paired two-sided t-test). C) Projection of TCRs with significant Tx-E or Tx-NE onto UMAP embeddings of tumor CD8 TIL. Bar plots show fraction of Tx-E and Tx-NE cells in CD8 T cell clusters (paired two-sided t-test). D) Projection of Tx-E TCRs onto post-treatment scRNA-seq data, grouped by pre-existing or emergent clonotypes. E) Quantification of Tx-E cell fraction per cluster in pre-Tx versus post-Tx samples (average and SEM for each patient group, n=5 pre-Tx patients, n=13 post-Tx patients, two-sided t-test, *p < 0.05). F) Quantification of Tx-E cell fraction per cluster in post-Tx samples comparing treatment cohorts (average and SEM for each patient group, n=7 mono patients, n=6 combo therapy patients, two-sided t-test, *p < 0.05). G) UMAP embedding of post-Tx CD4 clusters highlighting tumor Tx-NE/Tx-E TCRs; bar plots show fraction of Tx-NE and Tx-E cells in tumor CD4 T cell clusters (paired two-sided t-test). See also Figure S3.
Figure 4:
Figure 4:. Gene programs of Tx-E T cells and relation to clinical response.
A) Top 20 differentially expressed (DE) genes between tumor CD8 Tx-NE and Tx-E cells in pre-Tx and post-Tx samples; averaged scaled gene expression of all cells in each group. B-C) Comparison of averaged activity scores for indicated gene signatures between Tx-NE and Tx-E T cells in pre-Tx and post-Tx patient samples (n=4 pre-Tx patients, n= 13 post-Tx patients, two-sided t-test, *p<0.05, **p<0.01). For two pre-Tx patients we were unable to calculate scores due to missing bulk TCR timepoint/lack of pre-Tx cells. D) Top Tx-E versus Tx-NE DE genes shared by tumor CD4 and CD8 T cells in post-Tx samples. E-F) Signature gene sets from E used to analyze bulk RNA-seq data from an independent ICB-treated patient cohort (metastatic urothelial cancer patients treated with anti-PD-L1). F: Left, activity scores for patients with complete or partial response (CR/PR) versus stable disease or progressive disease (SD/PD), two-sided t-test. Right, Kaplan-Meier curves showing overall survival (likelihood ratio test). See also Figure S4 and Tables S3-4.
Figure 5.
Figure 5.. Identification of tumor-associated targets of expanded TCRs.
A) Representation of results from a genome-wide T-scan screen. Each circle represents a single 90-aa protein fragment; y-axis represents the fold-change of each peptide in relation to the unsorted input library (eight sorted replicates). Protein fragments with fold enrichment >2.5 that share overlapping peptide sequences from same target are highlighted. B) HLA, TCR expansion and epitope information. C) Treatment-related expansion of clonotypes with validated target antigens. Frequency calculated from bulk TCR β chain dataset. D) Validation of the T-scan screen hits. Target cells (HEK293T) that expressed the relevant HLAs (indicated in B) were pulsed with the indicated peptides; non-pulsed cells were used as controls. IFNγ release by CD8+ T cells expressing the patient TCRs following incubation with target cells (average and SD of n = 3, ** P < 0.01; *** P < 0.001 Student’s t-test). E) Projection of TCRs with validated target antigens onto tumor CD8 UMAP embedding. Three low-frequency TCRs were not identified in filtered CD8 T cell sub-clusters, although single-cell TCR pairs could be identified in un-filtered data. F) Cancer cell reactivity of primary T cells expressing MAGEA1-specific TCRs. CD8+ T cells expressing P32-39 or P32-41 TCRs were co-cultured for 18h with a panel of C*07:02 positive cancer cell lines that expressed MAGEA1 at variable levels; HEK293T cells engineered to express C*07:02 ± MAGEA1 protein fragment were included as controls. IFNγ concentration in the supernatant was measured by ELISA assay. Each condition compared to C*07:02 HEK293 control (average and SD of n = 3, ****P < 0.0001 one-way ANOVA and Bartlett’s post-test). G) Cytotoxic activity of T cells expressing MAGEA1-specific TCRs. A101D and A2058 tumor cells were co-cultured with P32-39 TCR, P32-41, or with non-transduced control donor T cells at indicated E:T ratios. Red fluorescence was measured over time and normalized to timepoint 0. Circles represent an average of n = 2. See also Figure S5 and Table S5.
Figure 6:
Figure 6:. Neoadjuvant ICB enhances systemic tumor immunity
A) UMAP embedding showing sub-clusters of total blood CD8 T cells across three timepoints (B1 pre-treatment, B2 on-treatment, B3 post-treatment/post-surgery, n=27 B1, n=24 B2, n=18 B3). B) Violin plots showing normalized scRNA-seq expression of selected genes for cluster 6 of blood CD8 T cells. C) Longitudinal comparison of blood CD8 T cell cluster frequency (partially paired two-sided t-test,**p<0.01; average and SEM for each patient group). D) Mapping of blood Tx-E TCRs (based on bulk TCR β repertoire sequencing) to blood CD8 T cell scRNA-seq data. E) Mapping of total tumor TCR clonotypes (left) and tumor Tx-E clonotypes (right), identified by bulk TCR β repertoire sequencing, to blood on-treatment (B2) CD8 T cell scRNA-seq data. Bar plots show distribution of tumor Tx-NE and Tx-E TCRs among blood CD8 T cell clusters (color code for clusters as in A). F) Strategy for sorting of Tx-E T cells from B1 and B2 blood samples based on surface markers inferred from scRNA-seq data. G) Representative flow cytometry plots for sorting of activated blood CD8 T cells. H) Comparison of sorted T cells as determined by flow cytometry (% live CD38+ HLA-DR+ cells) versus scRNA-seq (% CD8 cluster 6 T cells); fit with a linear regression model. I) Projection of sorted blood CD8 T cells to reference total blood CD8 T cells; 63.5% of sorted T cells projected to CD8 C6 cluster. Contour lines reflect the density of projected cells on reference UMAP embedding. J) Sub-clusters of sorted blood CD8 T cells (n=4 B1 and B2). K) Top DE genes among subclusters of sorted blood CD8 T cells, ranked by averaged ln (fold change) compared to all other clusters and z-score normalized. L) Fraction of total and sorted blood CD8 TCRs that could be mapped to respective tumor bulk TCR dataset. M) Mapping of tumor Tx-E and Tx-NE TCRs to sorted blood CD8 T cells . Left, total sorted CD8 T cells; right, sorted CD8 T cells at B1 and B2 timepoints (n=2 patients, P13, P32 for whom we could calculate tumor Tx-E/NE TCRs; n=2 patients did not have pre/post treatment bulk TCR data). See also Figure S6 and Table S6.
Figure 7:
Figure 7:. Activation state of circulating T cells as biomarkers of tumor pathological response
A) Frequencies of tumor Tx-E TCR clonotypes and their associated frequencies in the blood for a patient with an exceptional cellular response (P32). B) Frequencies of tumor Tx-E TCR clonotypes and their associated frequencies in the blood. Data for four patients with notable Tx-E TCR abundance are shown. Each row represents one tumor Tx-E clonotype grouped as indicated; grey cell means TCR was not detected for given sample. C) Frequency of blood Tx-E TCR clonotypes plotted as percentage of total blood clonotypes within treatment cohorts. Shown are all Tx-E TCRs (left) or split into emergent (middle) and pre-existing (right) TCRs. Each dot represents an individual patient (n=15 mono patients, n=12 combo patients; two-sided Wilcoxon rank-sum test). D) Frequency of total or emergent blood Tx-E clonotypes shared with tumor, plotted as percentage of total blood clonotypes. Each point represents an individual patient for whom frequencies could be calculated (n= 12 mono, n=10 combo; two-sided Wilcox test). E) Correlation of blood CD8 T cell cluster fraction with tumor pathological response at B1 . Difference between low and high pathological response groups was determined (n = 7 for high response, n = 9 for low response, two-sided Wilcoxon rank-sum test, *p<0.05, **p<0.01). F) Kinetic changes in blood CD4 T cells. Left, frequency of CD4+ CD38+ HLA-DR+ cells, pre-gated on live/CD3+/CD4+ cells shown across timepoints (n=23 B1, n=24 B2, n=19 B3). Right, frequency of CD4+ CD38+ HLA-DR+ cells at B2 comparing cohorts (n= 14 B2 Mono, n = 10 B2 Combo; two-sided unpaired Wilcoxon rank-sum test). G) Kinetic changes of blood CD8 T cells. Left, Frequency of CD8+ CD38+ HLA-DR+ cells, pre-gated on live/CD3+/CD8+ cells, shown for each patient across timepoints and colored by treatment (n=23 B1, n=24 B2, n=19 B3, two-sided Wilcoxon rank-sum test). Right, quantification of Ki-67+ frequency (%) among CD38+ HLA-DR+ and CD38- HLA-DR- cells for samples with ≥ 100 cells per population (n = 14 B1, n = 17 B2, paired two-sided Wilcoxon rank-sum test, ****p<0.0001). H) Correlation of pathological response with frequency of CD8+ CD38+ HLA-DR+ T cells in pre-Tx and on-Tx blood samples (B1: n= 8 low, n = 9 medium, n= 5 high; B2: n= 8 low, n= 8 medium, n = 6 high; two-sided Wilcoxon rank-sum test). I-J) Correlation of pathological response with KLRG1 status of PD-1+ CD8 T cells. I: Representative flow cytometry plots identifying PD-1+ CD8 T cells (top) and KLRG1 expression by PD-1+ cells (bottom) from low and high pathological response patients at B1 timepoint. J: Frequency of PD-1+ cells (left) and PD-1+ KLRG1- cells (right) at B1 and B2 timepoints; at B2 on-treatment timepoint, PD-1 was detected with anti-IgG4 (bound nivolumab) (B1: n= 8 low, n = 9 medium, n= 5 high; B2: n= 8 low, n= 8 medium, n = 6 high; two-sided Wilcoxon rank-sum test). See also Figure S7 and Table S7.

Comment in

References

    1. Aibar S, Gonzalez-Blas CB, Moerman T, Huynh-Thu VA, Imrichova H, Hulselmans G, Rambow F, Marine JC, Geurts P, Aerts J, et al. (2017). SCENIC: single-cell regulatory network inference and clustering. Nat Methods 14, 1083–1086. - PMC - PubMed
    1. Amaria RN, Reddy SM, Tawbi HA, Davies MA, Ross MI, Glitza IC, Cormier JN, Lewis C, Hwu WJ, Hanna E, et al. (2018). Neoadjuvant immune checkpoint blockade in high-risk resectable melanoma. Nat Med 24, 1649–1654. - PMC - PubMed
    1. Andreatta M, Corria-Osorio J, Muller S, Cubas R, Coukos G, and Carmona SJ (2021). Interpretation of T cell states from single-cell transcriptomics data using reference atlases. Nat Commun 12, 2965. - PMC - PubMed
    1. Aran D., Looney AP., Liu L., Wu E., Fong V., Hs A., Chak S., Naikawadi RP., Wolters PJ., Abate AR., et al.. (2019). Reference-based analysis of lung single-cell sequencing reveals a transitional profibrotic macrophage. Nat Immunol 20, 163–172. - PMC - PubMed
    1. Banchereau R, Chitre AS, Scherl A, Wu TD, Patil NS, de Almeida P, Kadel Iii EE, Madireddi S, Au-Yeung A, Takahashi C, et al. (2021). Intratumoral CD103+ CD8+ T cells predict response to PD-L1 blockade. J Immunother Cancer 9. - PMC - PubMed

Publication types

Substances