. 2022 Jul;114(4):110423.
doi: 10.1016/j.ygeno.2022.110423. Epub 2022 Jul 6.

Genomic signatures for drylands adaptation at gene-rich regions in African zebu cattle

Affiliations

Genomic signatures for drylands adaptation at gene-rich regions in African zebu cattle

Abdulfatai Tijjani et al. Genomics. 2022 Jul.

Abstract

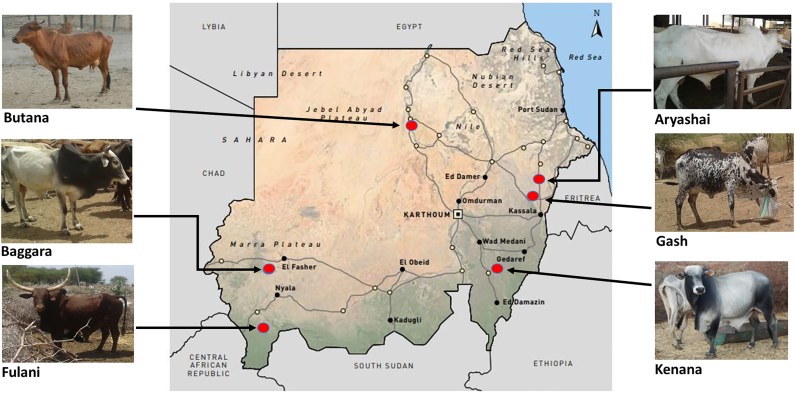
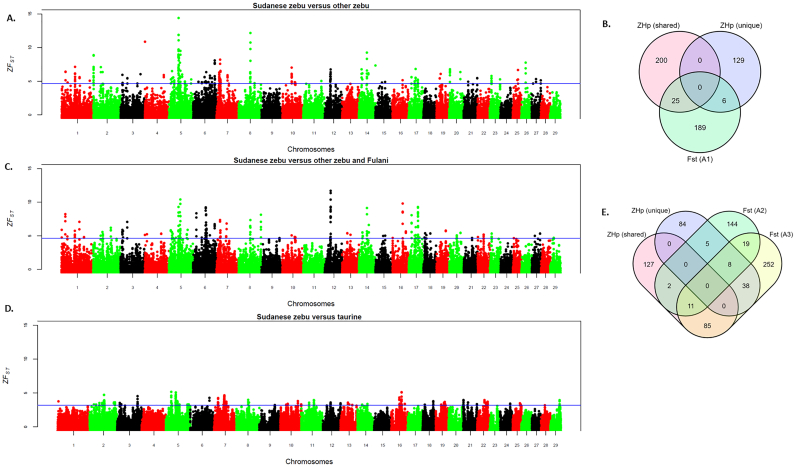
Background: Indigenous Sudanese cattle are mainly indicine/zebu (humped) type. They thrive in the harshest dryland environments characterised by high temperatures, long seasonal dry periods, nutritional shortages, and vector disease challenges. Here, we sequenced 60 indigenous Sudanese cattle from six indigenous breeds and analysed the data using three genomic scan approaches to unravel cattle adaptation to the African dryland region.

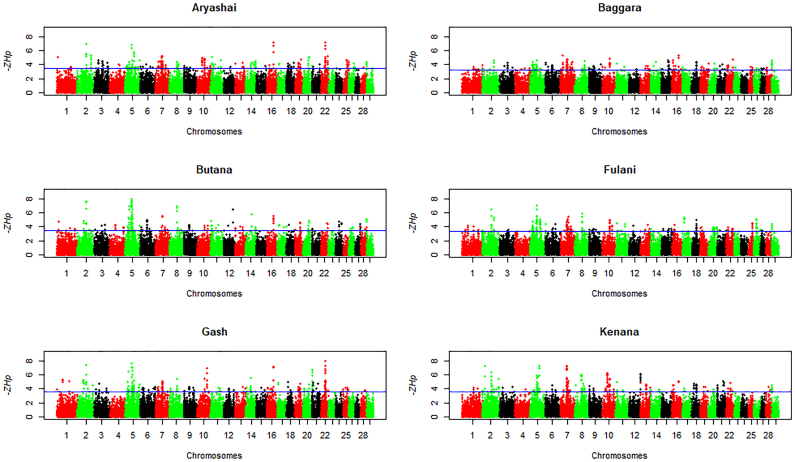
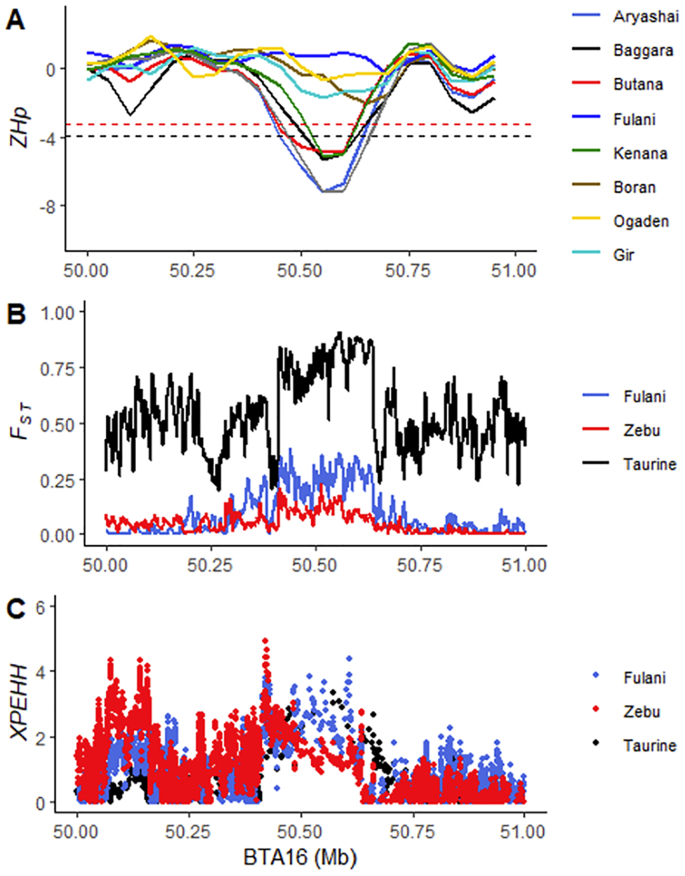
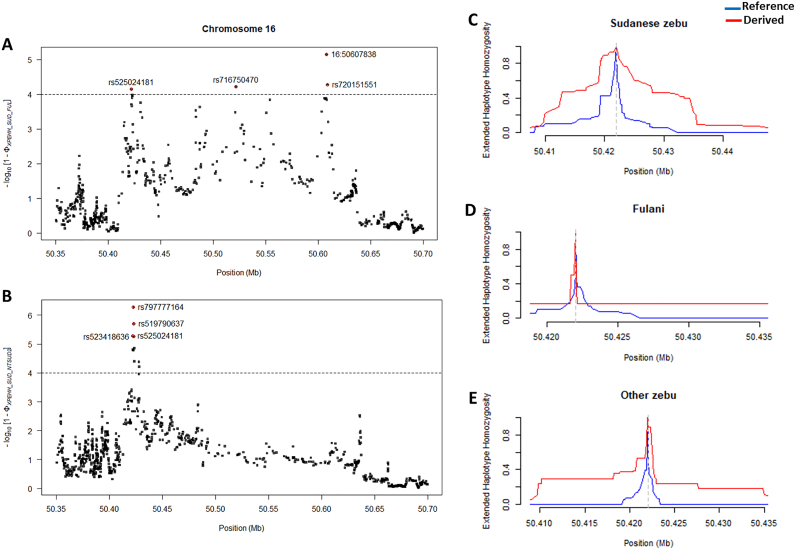
Results: We identified a set of gene-rich selective sweep regions, detected mostly on chromosomes 5, 7 and 19, shared across African and Gir zebu. These include genes involved in immune response, body size and conformation, and heat stress response. We also identified selective sweep regions unique to Sudanese zebu. Of these, a 250 kb selective sweep on chromosome 16 spans seven genes, including PLCH2, PEX10, PRKCZ, and SKI, which are involved in alternative adaptive metabolic strategies of insulin signalling, glucose homeostasis, and fat metabolism.

Conclusions: Our results suggest that environmental adaptation may involve recent and ancient selection at gene-rich regions, which might be under a common regulatory genetic control, in zebu cattle.

Keywords: Adaptive genetic differentiation; African zebu; Desert adaptation; Fat metabolism; Insulin signalling; Sudanese zebu.


Figures

Fig. 1
Fig. 1
The geography of Sudan shows the sampling areas of the Sudanese zebu cattle populations. Map adapted from Impiglia [9]. Photo credit: Professor Hassan Musa, University of Khartoum, Sudan.
Fig. 2
Fig. 2
Genetic diversity and population structure of the 17 studied breeds. (A) Boxplot of average nucleotide diversities (π). The nucleotide diversity level within each cattle breed was calculated based on an overlapping 100 kb window with a 50 kb step size. (B) Principal component (PC 1 versus PC 2) analysis for 17 cattle breeds. (C) Principal component (PC 1 versus PC 2) analysis for the six Sudanese zebu cattle populations. (D) Admixture plot showing ancestry proportions for the 17 cattle breeds. The population structure was assessed using ADMIXTURE ver.1.3.0. The individual population is represented by a vertical bar and partitioned into coloured segments. Each segment's length represents the proportion of the inferred number of ancestries (K = 2 to K = 5). GIR – Gir, GAS – Gash, ARY – Aryashai, BTN – Butana, KEN – Kenana, BAG – Baggara, FLN – Fulani, OGD – Ogaden, BOR – Kenya Boran, ANK – Ankole, NDA – N'Dama, MUT – Muturu, YKT – Yakutian, WES – Western Finncattle, EAS – Eastern Finncattle, AAN – Angus, and HOL – Holstein. The cattle breeds were also grouped into six entities, namely, Asian zebu (ASZ), Sudanese zebu (SUD), East African zebu (AFZ), African sanga (AFS), West African taurine (WAT), and European taurine (EUT).
Fig. 3
Fig. 3
Maximum likelihood evolutionary tree and possible gene flow among the 17 cattle breeds: (A) without migration events, (B) assuming ten migration events. E-Finn (Eastern Finncattle) W-Finn (Western Finncattle), K-Boran (Kenyan Boran).
Fig. 4
Fig. 4
Genome-wide distribution of ZHp scores across bovine autosomes in six Sudanese zebu populations. The blue line indicates the ZHp threshold value (lowest 0.5%) for selecting outlier windows (candidate regions under positive selection). (For interpretation of the references to colour in this figure legend, the reader is referred to the web version of this article.)
Fig. 5
Fig. 5
Genome-wide distribution of ZFST scores along the Bos taurus (ARS-UCD1.2) autosomes and overlap of detected protein coding genes following the population differentiation FST analyses between Sudanese zebu populations and the populations of other cattle breeds. (A) FST analysis between population of six Sudanese zebu breeds and other zebu/sanga (Kenya Boran, Ogaden, Ankole and Gir). (B) Venn diagram showing the overlap of detected protein-coding genes between ZHp and FST tests in (A). (C) FST analysis between five Sudanese zebu breeds (except Fulani) and the population of other zebu/sanga comprising Fulani, Kenya Boran, Ogaden, Ankole and Gir). (D) FST analysis between population of five Sudanese zebu breeds (except Fulani) and the population of all taurine breeds studied. The blue lines indicate the top 0.5% ZFST values threshold to consider outlier regions. (E) Venn diagram showing the numbers of overlapping detected protein-coding genes between ZHp and FST tests in (C) and (D). (For interpretation of the references to colour in this figure legend, the reader is referred to the web version of this article.)
Fig. 6
Fig. 6
Strong evidence of positive selection in Sudanese zebu population at a 250-kb chromosome 16 locus. (A) Genomic footprints of low diversity (ZHp) in the candidate region in eight African zebu breeds and Gir zebu. The red and black dashed line indicates the maximum and minimum genome-wide ZHp selection outlier threshold values among the cattle breeds. (B) Population differentiation (FST) between the Sudanese zebu populations (excluding the Fulani) and other zebu and taurine cattle populations. (C) Increased haplotype homozygosity (XP-EHH) at the 250 kb selective sweep locus in Sudanese zebu compared to other cattle populations. (For interpretation of the references to colour in this figure legend, the reader is referred to the web version of this article.)
Fig. 7
Fig. 7
Localisation of SNPs at the Sudanese zebu-specific candidate selective sweep at the chromosome 16 locus following XP-EHH analysis between the combined five Sudanese breeds and (A), Fulani, and (B), other zebu breeds (East African and Gir breeds). (C) The decay of extended haplotype homozygosity around rs525024181 in Sudanese Zebu, (D) Fulani, and (E) other zebu breeds.

References

    1. Wilson R.T. Livestock in the Republic of the Sudan: policies, production, problems and possibilities. Anim. Husb. Dairy and Vet. Sci. 2018;2(3):1–12.
    1. Rahman I. Sudanese cattle resources and their productivity: a review. Agric. Rev. 2007;28(4):305–308.
    1. Nahar A.B. Higher Council for Environment and Natural Resources; Khartoum, Sudan: 2009. Sudan’s Fourth National Report to the Convention on Biological Diversity.
    1. HCENR, (Higher Council for Environment and Natural Resources) Ministry of Environment, Natural Resources and Physical Development; Sudan: 2014. Sudan’s Fifth National Report to the Convention on Biological Diversity.https://www.cbd.int/doc/world/sd/sd-nr-05-en.pdf
    1. Epstein H. Africana Publishing Corporation; 1971. The Origin of the Domestic Animals of Africa.

Publication types

LinkOut - more resources