Review
. 2022 Jul 8:45:533-560.
doi: 10.1146/annurev-neuro-110920-035434.

Theory of the Multiregional Neocortex: Large-Scale Neural Dynamics and Distributed Cognition

Affiliations
Review

Theory of the Multiregional Neocortex: Large-Scale Neural Dynamics and Distributed Cognition

Xiao-Jing Wang. Annu Rev Neurosci. .

Abstract

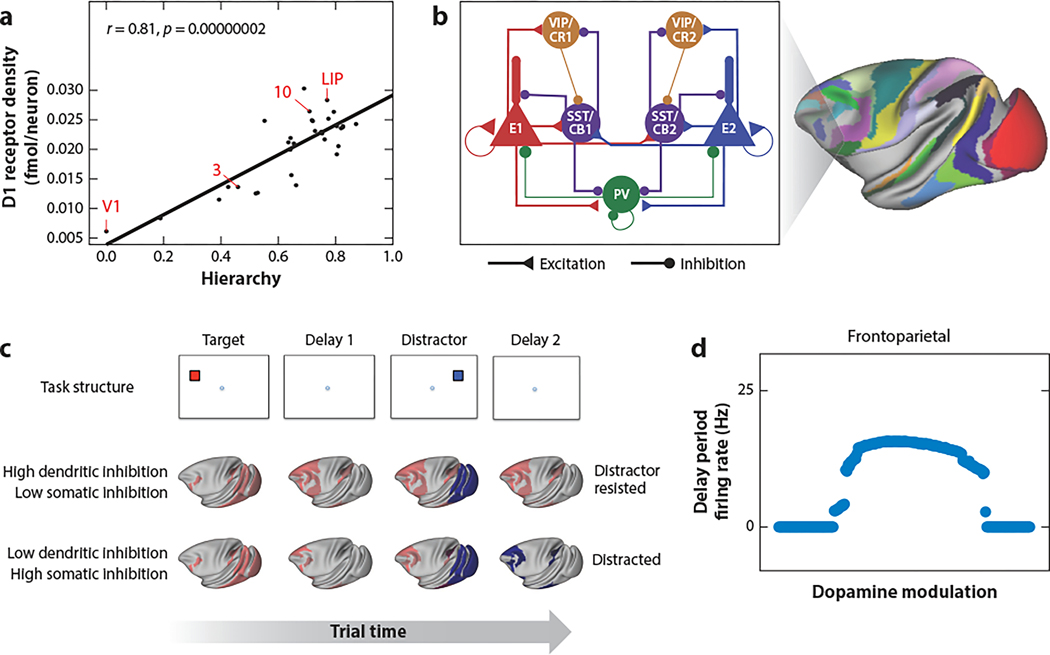
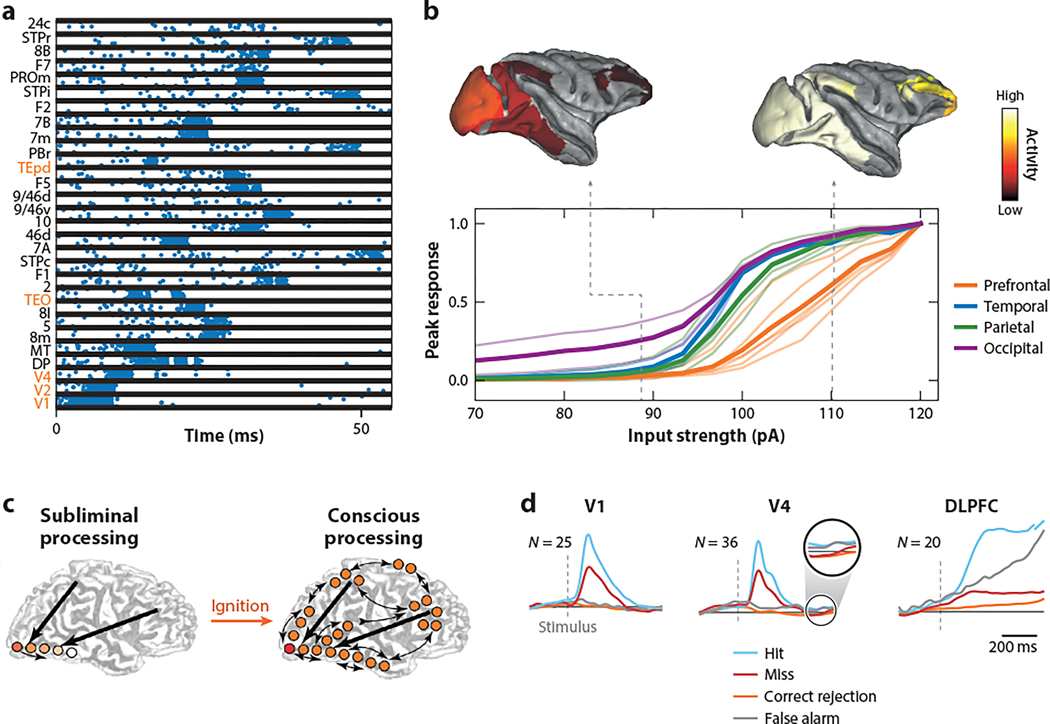
The neocortex is a complex neurobiological system with many interacting regions. How these regions work together to subserve flexible behavior and cognition has become increasingly amenable to rigorous research. Here, I review recent experimental and theoretical work on the modus operandi of a multiregional cortex. These studies revealed several general principles for the neocortical interareal connectivity, low-dimensional macroscopic gradients of biological properties across cortical areas, and a hierarchy of timescales for information processing. Theoretical work suggests testable predictions regarding differential excitation and inhibition along feedforward and feedback pathways in the cortical hierarchy. Furthermore, modeling of distributed working memory and simple decision-making has given rise to a novel mathematical concept, dubbed bifurcation in space, that potentially explains how different cortical areas, with a canonical circuit organization but gradients of biological heterogeneities, are able to subserve their respective (e.g., sensory coding versus executive control) functions in a modularly organized brain.

Keywords: computational modeling; distributed cognition; global brain dynamics; hierarchy of timescales; macroscopic gradients; neocortical connectome.


Figures

Figure 1
Figure 1
Interareal connections of macaque monkey cortex. (a) Relative weight of connection of one among all source areas to a target area is quantified by the fraction of labeled neurons (FLN). FLNs span five orders of magnitude and are fit by a lognormal distribution. (b) The FLN between a pair of cortical areas is an exponential function of their distance (red line), with the decay rate λ = 0.175 mm−1. (c) Cortical connectivity spatial length as a function of gray matter volume (GMV). Shown is the base 10 logarithm of the decay rate λ of the exponential distance rule of the mouse, marmoset, and macaque, computed in the same way in all three cases. The plot is a linear fit on these three points with a slope of −2/9. The red square is the measured value of the decay rate in the rat, and the intersection of the blue dotted lines is the predicted decay rate in the human. Panels a and b adapted from Wang & Kennedy (2016) with original data from Markov et al. (2014a) and Ercsey-Ravasz et al. (2013). Panel c adapted from Theodoni et al. (2022) (CC BY 4.0).
Figure 2
Figure 2
Hierarchy of time constants in the neocortex. (a) Time constant extracted from autocorrelation function of neuronal spiking fluctuations during baseline of eye fixation in five cortical areas of macaque monkeys as a function of an anatomically defined hierarchical position. (b) Time constant of autocorrelation function of neuronal spiking fluctuations in thalamic LGN, the LP, V1, and five higher-order visual cortical areas (LM, AL, RL, PM, and AM) of mice as a function of their anatomically defined hierarchical positions. (c) Spatial distribution of information integration time constants in the brain of zebrafish performing a decision task. (d) Hierarchy of time constants in human cortical areas underlying language processing. A hierarchy of speech processing timescale (operationalized by measuring the temporal receptive window) in each region increases in a topographically organized manner, from milliseconds up to minutes. Abbreviations: ACC, anterior cingulate cortex; AL, anterolateral area; AM, anteromedial area; LGN, lateral geniculate nucleus; LIP, lateral intraparietal area; LM, lateromedial area; LP, visual pulvinar; LPFC, lateral prefrontal cortex; MT, middle temporal visual area; OFC, orbitofrontal cortex; PM, posteromedial area; RL, rostrolateral area. Panel a adapted from Murray et al. (2014) (CC BY 4.0). Panel b adapted with permission from Siegle et al. (2021). Panel c adapted with permission from Dragomir et al. (2020). Panel d adapted with permission from Hasson et al. (2015).
Figure 3
Figure 3
A multiregional model of the macaque monkey cortex endowed with a laminar structure. (a) The four levels incorporated in the model include a within-layer local microcircuit, a laminar circuit with two laminar modules, an interareal circuit with laminar-specific projections, and a large-scale network of cortical areas based on macaque anatomical connectivity. Each level is anatomically constrained. Only the connections at each level (not shown at a lower level) are plotted, for clarity. (Left) Stochastic gamma oscillations in the superficial layer (green) and alpha rhythm in the deep layer (orange). (b) Frequency-dependent Granger causality for bottom-up and top-down processes in macaque monkey cortex. ∗∗∗ denotes statistically significant difference. (c) A circuit substrate for predictive coding. Under the assumption that the dominant effect of feedback projection is excitation of infragranular pyramidal cells, which in turn project to supragranular inhibitory neurons, a top-down prediction signal Y changes the sign and is effectively inhibitory for infragranular excitatory neurons, compared with excitation X from feedforward stimulation, thereby implementing XY. This mechanism may apply to a chain of cortical areas in a hierarchy. Panel a adapted from Mejias et al. (2016). Panel b adapted with permission from Bastos et al. (2015).
Figure 4
Figure 4
Distributed working memory representation in a large-scale monkey cortex model in which none of the isolated areas is capable of generating persistent activity. (a) Model schema. Zooming in illustrates interareal connections between V1 and V2, each with two selective excitatory neural pools (purple and green) and an inhibitory neural pool (blue). Feedforward projection predominantly targets excitatory cells, whereas feedback projection more strongly targets inhibitory neurons (thick arrowed lines). (b) In model simulation of a visual delayed response task, activities of the two excitatory neural populations are shown for 6 sample areas. Blue lines represent activity of the neural pool selective for the shown stimulus, and orange lines represent activity of the neural pool nonselective for it. (c) The activity map is confined to the posterior part of the cortex during stimulus presentation. By contrast, persistent activity is distributed in the frontal, parietal, and temporal areas after stimulus withdrawal. Firing rate is shown in color. (d) Mnemonic firing rate of the selective neural pool in each area during the delay period is plotted as a function of its hierarchical position. Those areas displaying persistent activity are separated from those that do not by a gap in the firing rate (red arrow). Simulation results use the model from Mejias & Wang (2022). Abbreviations: 8B, frontal eye field Brodmann area 8B; 9/46d, dorsolateral prefrontal cortex Brodmann area 9 and dorsal 46; 24c, anterior cingulate cortex Brodmann area 24; FB, feedback; FF, feedforward, LIP, lateral intraparietal area; MT, middle temporal area; V1, primary visual cortex.
Figure 5
Figure 5
Dopamine modulation of a multiregional cortical system. (a) The D1 receptor density per neuron increases along the anatomically defined cortical hierarchy. (b) An extended local circuit model with diverse types of inhibitory neurons. (c) Simulations of a working memory task with a distractor. With a high dendritic-somatic inhibition ratio (top row), target-selective activity (red) is maintained in the second delay in spite of the distractor that briefly causes activity in the distractor-selective neural population (blue) of visual cortical areas (middle row). With a low dendritic-somatic inhibition ratio, persistent activity becomes selective for the distractor in the second delay (bottom row). (d) Inverted U-shaped dependence on D1 modulation of persistent activity in the parietofrontal cortical areas. Abbreviations: 3, primary somatosensory cortex Brodmann area 3; 10, frontal polar cortex Brodmann area 10; E, excitatory neurons; LIP, lateral intraparietal cortex; PV, parvalbumin; SST/CB, somatostatin/calbindin; V1, primary visual cortex; VIP/CR, vasoactive intestinal peptide/calretinin-expressing inhibitory neuron. Figure adapted from Froudist-Walsh et al. (2021) (CC BY 4.0).
Figure 6
Figure 6
Ignition in a large-scale cortex. (a) Signal propagation across some areas but not others in response to a brief input to V1 in a large-scale monkey cortex model of spiking neurons. The areas along the ventral stream showing strong response activity are indicated in orange. The list of full names of cortical areas shown is provided in Markov et al. (2014a). (b) The peak response averaged over areas in the occipital, temporal, parietal, and frontal lobes as a function of the intensity of a stimulus to V1. (c) Illustration of ignition as a physiological signature of consciousness. (d) Average normalized activity of neurons in V1, V4, and dorsolateral prefrontal cortex (DLPFC) of monkeys performing a visual detection task with intermediate contrast levels around the detection threshold. Neural signals in visual areas predominantly reflect the physical stimulus in hit and miss trials, whereas neural firing in the DLPFC displays strong responses correlated with subjective awareness in hit and false alarm trials. Panels a and b adapted from Joglekar et al. (2018). Panel c adapted with permission from Dehaene et al. (2006). Panel d adapted with permission from van Vugt et al. (2018).

References

    1. Abbott LF, Bock DD, Callaway EM, Denk W, Dulac C, et al. 2020. The mind of a mouse. Cell 182:1372–76 - PubMed
    1. Ahrens MB, Li JM, Orger MB, Robson DN, Schier AF, et al. 2012. Brain-wide neuronal dynamics during motor adaptation in zebrafish. Nature 485:471–77 - PMC - PubMed
    1. Amit D. 1995. The Hebbian paradigm reintegrated: local reverberations as internal representations. Behav. Brain Sci 18:617–25
    1. Amunts K, Zilles K. 2015. Architectonic mapping of the human brain beyond Brodmann. Neuron 88:1086–107 - PubMed
    1. Ardid S, Wang X-J, Compte A. 2007. An integrated microcircuit model of attentional processing in the neocortex. J. Neurosci 27:8486–95 - PMC - PubMed

Publication types

LinkOut - more resources