. 2022 Aug 17;42(33):6325-6343.
doi: 10.1523/JNEUROSCI.1878-21.2022. Epub 2022 Jul 8.

T-Type Ca2+ Channels Boost Neurotransmission in Mammalian Cone Photoreceptors

Affiliations

T-Type Ca2+ Channels Boost Neurotransmission in Mammalian Cone Photoreceptors

Adam Davison et al. J Neurosci. .

Abstract

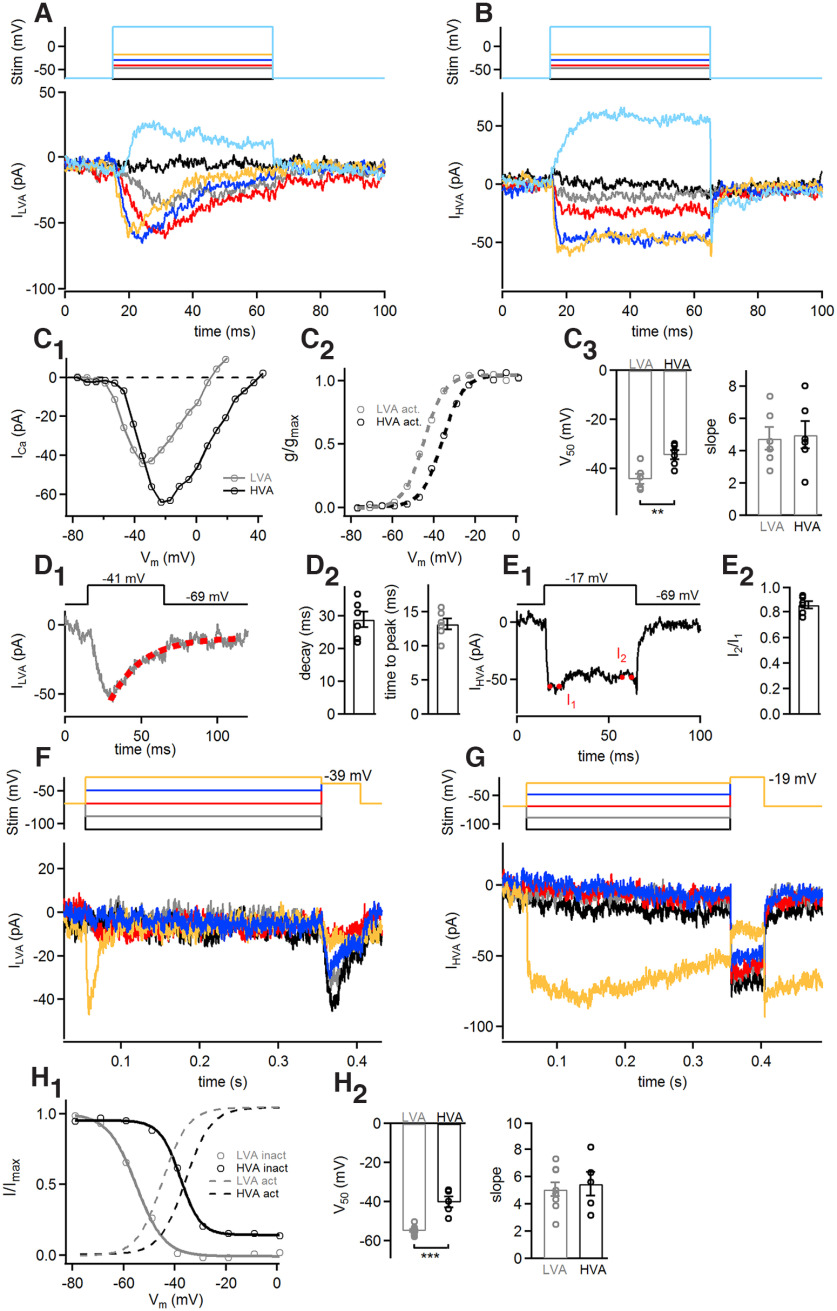
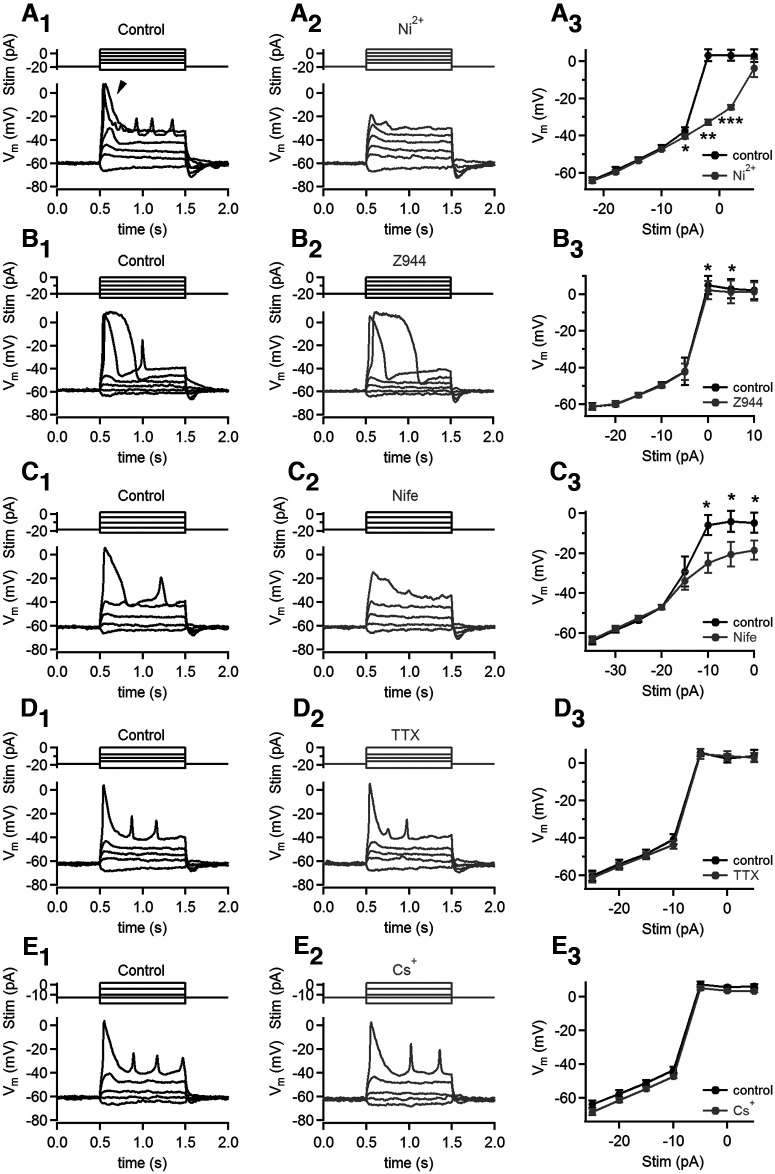
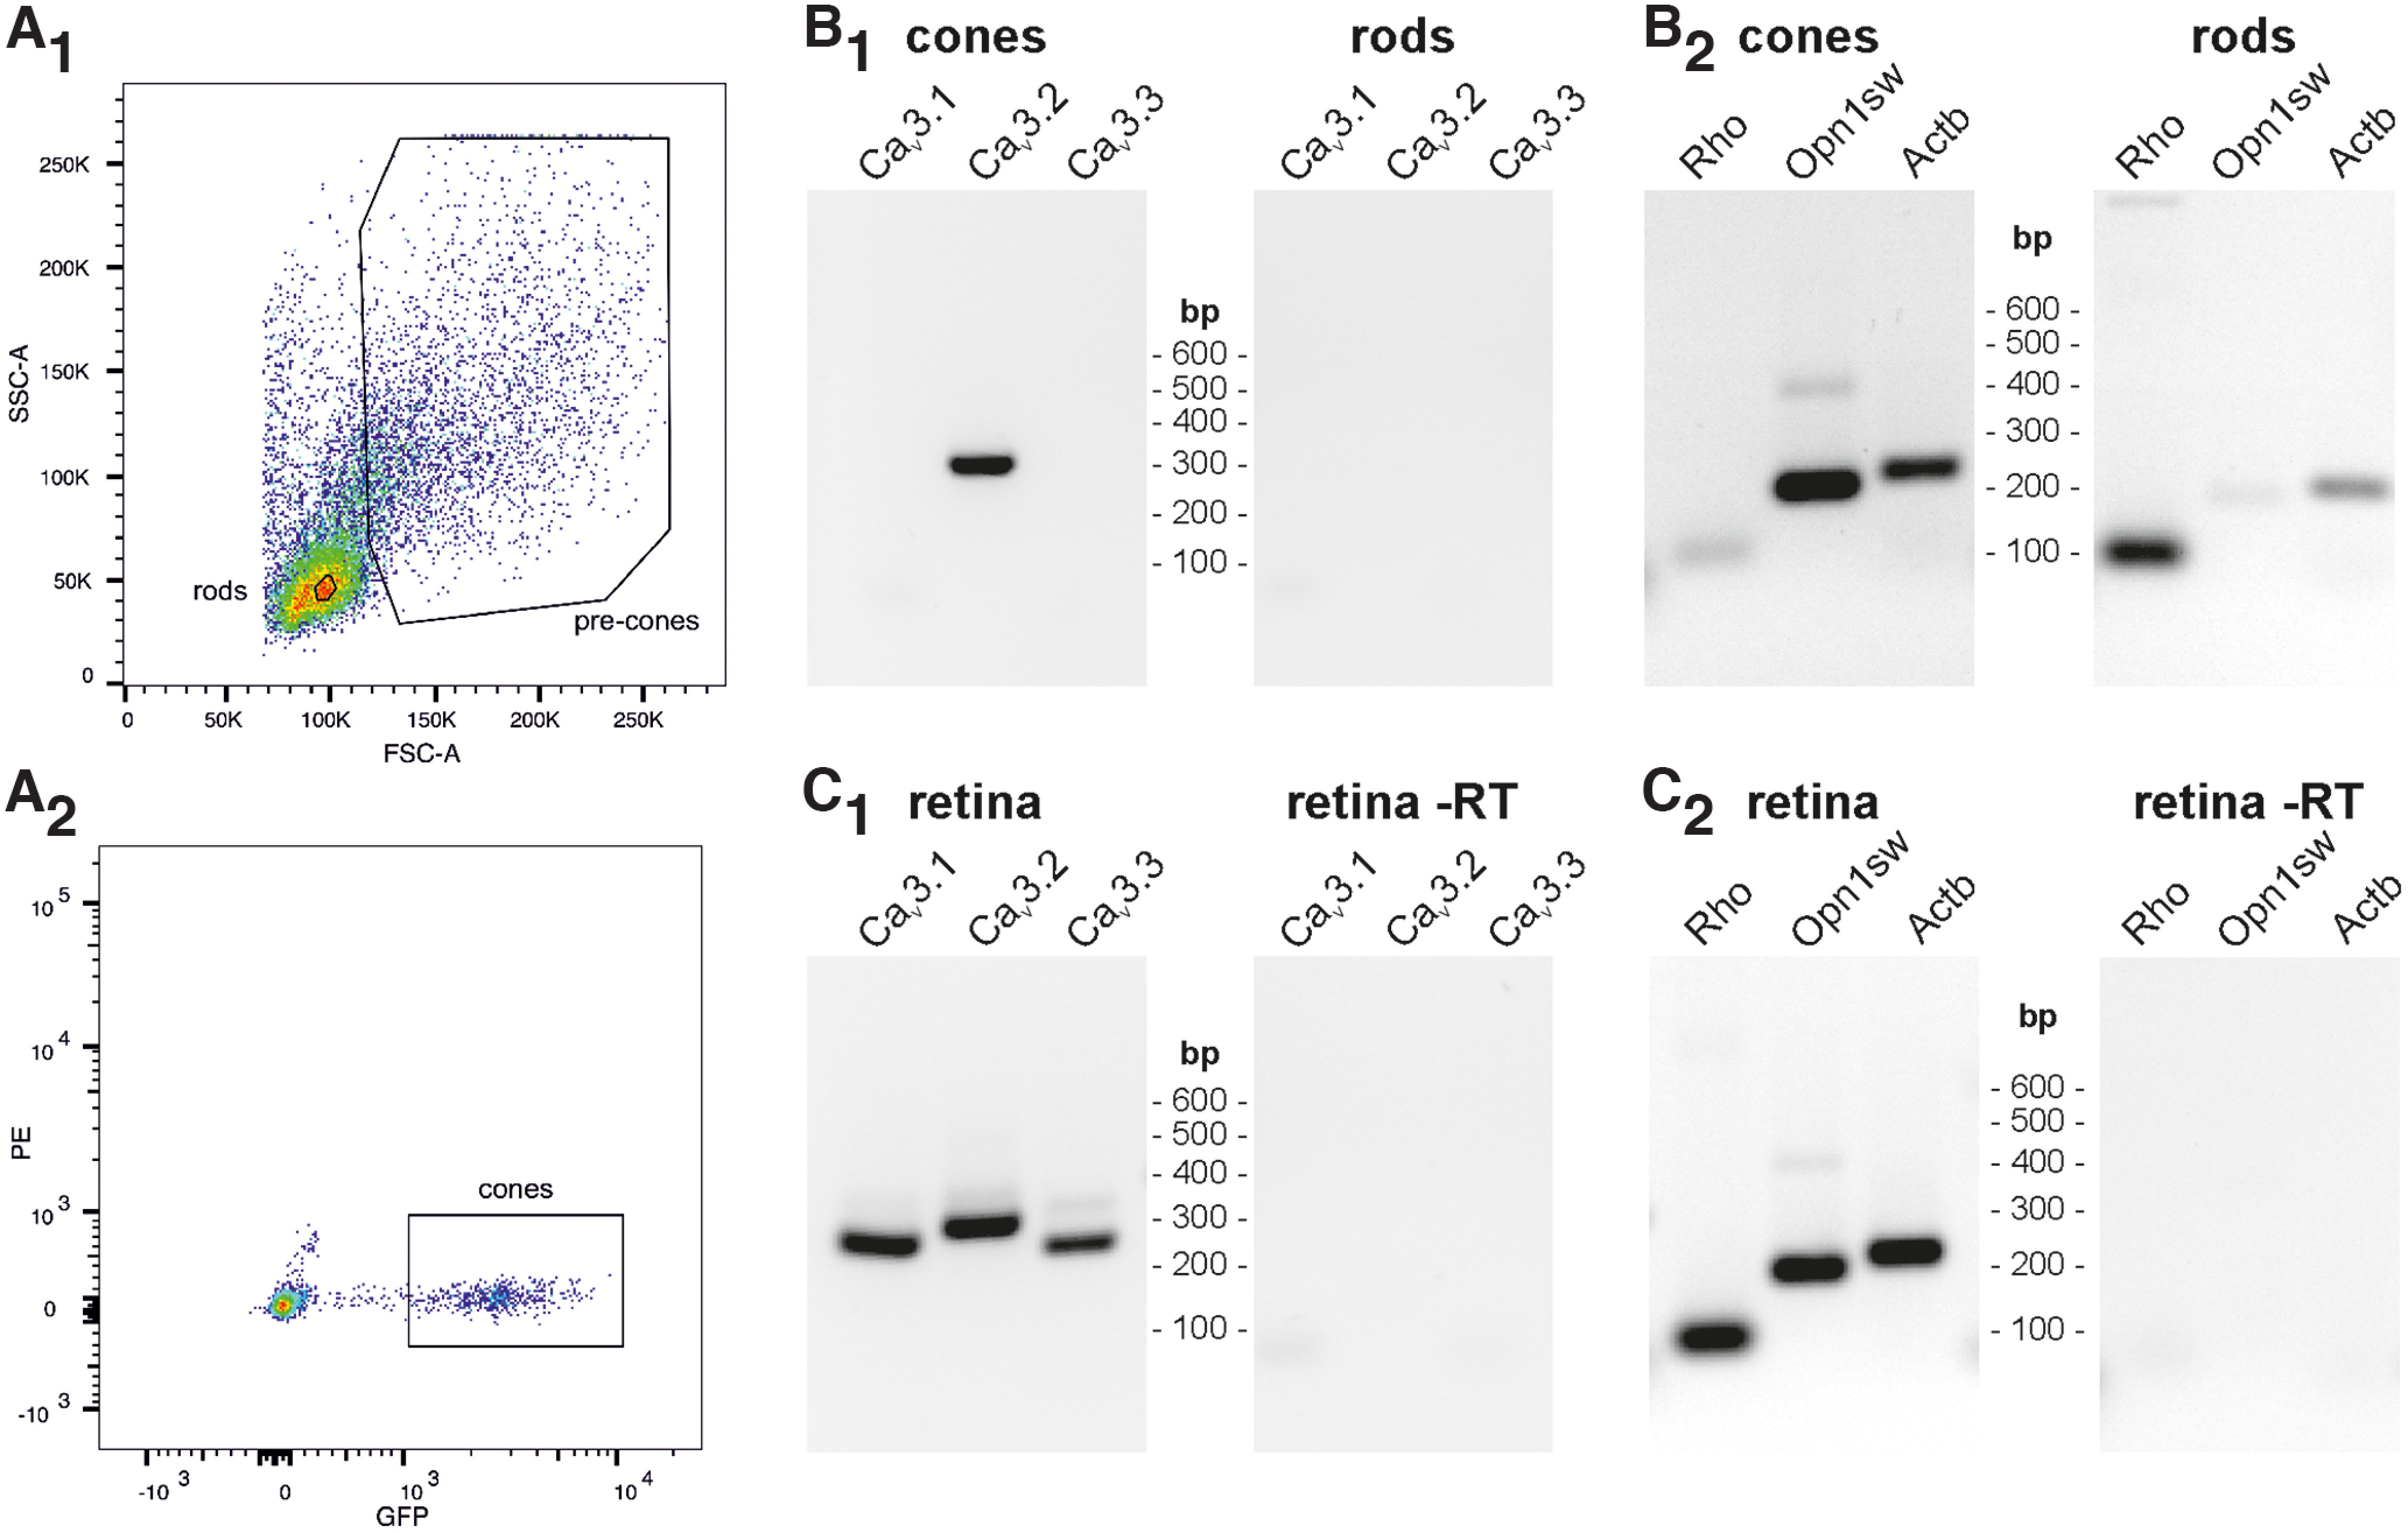
It is a commonly accepted view that light stimulation of mammalian photoreceptors causes a graded change in membrane potential instead of developing a spike. The presynaptic Ca2+ channels serve as a crucial link for the coding of membrane potential variations into neurotransmitter release. Cav1.4 L-type Ca2+ channels are expressed in photoreceptor terminals, but the complete pool of Ca2+ channels in cone photoreceptors appears to be more diverse. Here, we discovered, employing whole-cell patch-clamp recording from cone photoreceptor terminals in both sexes of mice, that their Ca2+ currents are composed of low- (T-type Ca2+ channels) and high- (L-type Ca2+ channels) voltage-activated components. Furthermore, Ca2+ channels exerted self-generated spike behavior in dark membrane potentials, and spikes were generated in response to light/dark transition. The application of fast and slow Ca2+ chelators revealed that T-type Ca2+ channels are located close to the release machinery. Furthermore, capacitance measurements indicated that they are involved in evoked vesicle release. Additionally, RT-PCR experiments showed the presence of Cav3.2 T-type Ca2+ channels in cone photoreceptors but not in rod photoreceptors. Altogether, we found several crucial functions of T-type Ca2+ channels, which increase the functional repertoire of cone photoreceptors. Namely, they extend cone photoreceptor light-responsive membrane potential range, amplify dark responses, generate spikes, increase intracellular Ca2+ levels, and boost synaptic transmission.SIGNIFICANCE STATEMENT Photoreceptors provide the first synapse for coding light information. The key elements in synaptic transmission are the voltage-sensitive Ca2+ channels. Here, we provide evidence that mouse cone photoreceptors express low-voltage-activated Cav3.2 T-type Ca2+ channels in addition to high-voltage-activated L-type Ca2+ channels. The presence of T-type Ca2+ channels in cone photoreceptors appears to extend their light-responsive membrane potential range, amplify dark response, generate spikes, increase intracellular Ca2+ levels, and boost synaptic transmission. By these functions, Cav3.2 T-type Ca2+ channels increase the functional repertoire of cone photoreceptors.

Keywords: Cav3.2; calcium; cone photoreceptors; exocytosis; spike.


Figures

Figure 1.
Figure 1.
The presence of ILVA and IHVA in cone photoreceptors. A, Example transmission microscope image of a patch-clamp recording from a cone photoreceptor terminal in a mouse horizontal retinal slice. White arrowhead, Cone photoreceptor terminal; black arrowhead, rod photoreceptor terminal. B1, Example whole-cell patch-clamp recording from mouse cone photoreceptor terminals. Currents were monitored in response to a voltage ramp protocol from −89 to +49 mV, with a speed of 0.1875 mV/ms. Prepulse duration was 800 ms at different Vh values (black, −89 mV; gray, −39 mV). B2, Example trace shows the current–voltage relationship of ICa. Arrowheads indicated ILVA and IHVA components. C1–C3, Peak amplitudes of ILVA: Vh = −89 mV: −12.72 ± 2.15 pA, n = 12; Vh = −39 mV: −6.90 ± 1.53 pA, n = 12; p < 0.0001, paired t test. Peak amplitudes of IHVA: Vh = −89 mV: −19.66 ± 3.33 pA, n = 12; Vh = −39 mV: −20.19 ± 3.45 pA, n = 12; p = 0.4511, paired t test. ICa peak position: LVA: −42.48 ± 0.46 mV, n = 12; HVA: −20.75 ± 0.71 mV, n = 12; p < 0.0001, Mann–Whitney test.
Figure 2.
Figure 2.
Pharmacological separation of ILVA from IHVA. A1, Example current–voltage relationship of ramp-evoked ICa in mouse cone photoreceptors in the presence and absence of 100 μm NiCl2. Arrowheads indicate ILVA and IHVA component (LVA, HVA). A2, Peak ILVA amplitude: control: −11.03 ± 1.80 pA, n = 5; nickel (Ni2+): −6.22 ± 1.13 pA, n = 5; p = 0.0030, paired t test. Peak IHVA amplitude: control: −37.45 ± 5.25 pA, n = 5; nickel (Ni2+): −11.01 ± 1.52 pA, n = 5; p = 0.0022, paired t test. B1, Example current–voltage relationship of evoked ICa in the presence and absence of 1 μm mibefradil (Mibe). B2, Peak ILVA amplitude: control: −11.15 ± 0.94 pA, n = 6; mibefradil: −9.81 ± 0.93 pA, n = 6; p = 0.0641, paired t test. Peak IHVA amplitude: control: −37.04 ± 3.48 pA, n = 6; mibefradil: −35.06 ± 3.27 pA, n = 6; p = 0.1712, paired t test. C1, Example current–voltage relationship of evoked ICa in the presence and absence of 5 μm Z944. C2, Peak ILVA amplitude: control: −12.51 ± 1.58 pA, n = 7; Z944: −6.05 ± 0.82 pA, n = 7; p = 0.0003, paired t test. Peak IHVA amplitude: control: −36.61 ± 4.06 pA, n = 7; Z944: −49.25 ± 6.04 pA, n = 7; p = 0.0371, paired t test. D1, Current response to a voltage ramp protocol from −89 to +61 mV, with a speed of 0.1875 mV/ms in the presence (gray) and absence (black) of 3 mm CsCl. Prepulse duration was 800 ms. D2, Example trace shows current–voltage relationship of ICa during 3 mm CsCl application. D3, Peak ILVA amplitude: control: −15.72 ± 0.87 pA, n = 7; CsCl: −15.71 ± 1.25 pA, n = 7; p = 0.9786, paired t test. Peak IHVA amplitude: control: −29.42 ± 3.71 pA, n = 7; CsCl: −32.09 ± 4.05 pA, n = 7; p = 0.0933, paired t test. E1, Example current–voltage relationship of evoked ICa in the presence and absence of 10 μm nifedipine (Nife). E2, Peak IHVA amplitude: control: −37.45 ± 5.25 pA, n = 5; nifedipine: −19.73 ± 6.42 pA, n = 5; p = 0.0022, paired t test. Peak ILVA amplitude: control: −10.83 ± 0.87 pA, n = 5; nifedipine: −10.86 ± 1.00 pA, n = 5; p = 0.9082, paired t test. F1, Example current–voltage relationship of evoked ICa in the presence and absence of 1 μm TTX. F2, Peak ILVA amplitude: control: −12.80 ± 0.26 pA, n = 5; TTX: −12.92 ± 0.47 pA, n = 5; p = 0.7628, paired t test. Peak IHVA amplitude: control: −34.51 ± 0.81 pA, n = 5; TTX: −33.61 ± 1.02 pA, n = 5; p = 0.2789, paired t test. G1, Example current–voltage relationship of evoked ICa in the presence and absence of 10 μm ω-conotoxin GVIA (Cono). G2, Peak ILVA amplitude: control: −12.05 ± 1.77 pA, n = 5; Cono: −11.81 ± 2.06 pA, n = 5; p = 0.7978, paired t test. Peak IHVA amplitude: control: −31.37 ± 2.92 pA, n = 5; Cono: −31.03 ± 3.60 pA, n = 5, p = 0.7205; paired t test. H1, Example current–voltage relationship of evoked ICa in the presence and absence of (3 mm CsCl, 10 μm nifedipine, 5 μm Z944 and 100 μm nickel). H2, Peak ILVA amplitude (LVA), −10.72 ± 1.53 pA; peak IHVA amplitude (HVA), −40.16 ± 5.78 pA; peak ICa amplitude in the presence of L-type and T-type Ca2+ channel blockers (Mix), −3.0 ± 0.33 pA. LVA versus mix, p = 0.005; HVA versus mix, p = 0.0028; n =5, unpaired t test.
Figure 3.
Figure 3.
Physiological properties of ILVA and IHVA. A, Representative examples of ILVA in cone photoreceptors evoked by 50 ms voltage steps to different potentials (Vh = −62, −38, −32, −20, −8, and 52 mV) in the presence of 8 μm CNQX, 3 mm CsCl, and 10 μm nifedipine. B, Representative examples of IHVA evoked by 50 ms voltage steps to different potentials (Vh = −62, −38, −32, −20, −8, and 52 mV) in the presence of 8 μm CNQX, 3 mm CsCl, and 5 μm Z944. C1, Current–voltage relationship of ILVA and IHVA currents evoked by voltage steps from −77 to 43 mV by 6 mV steps. C2, Voltage dependence of steady-state activation of ILVA and IHVA (g/gmax). Data points were fitted with the Boltzmann function (dashed lines). C3, Mean V50: ILVA, −44.17 ± 1.98 mV; IHVA, −34.38 ± 1.78 mV; n = 6; p = 0.0043, unpaired t test. Mean activation slope factor (slope): ILVA, −4.77 ± 0.70; IHVA, 4.99 ± 0.83; n = 6; p = 0.8417, unpaired t test. D1, Typical maximal ILVA in cone photoreceptors evoked by a voltage step from −69 to 41 mV (50 ms). The dashed red line indicates ILVA decay fitted with an exponential function. D2, Corresponding time to ILVA peak, 13.18 ± 0.81 ms. Decay, tau of single exponential function: 28.82 ± 2.38 ms. E1, Typical maximal IHVA in cone photoreceptors evoked by a voltage step from −69 to −17 mV (50 ms). E2, Corresponding fast inactivation ratio, 0.85 ± 0.03. F, Example traces showing the steady-state inactivation of ILVA. A 300-ms-long conditioning pulse over a series of Vh, from −100 to −20 mV (20 mV increments), was applied before the test pulse (−39 mV, 50 ms). G, Example traces showing the steady-state inactivation of IHVA. The 300-ms-long conditioning pulse over a series of Vh values from −100 to −20 mV (20 mV increments) was applied before the test pulse (−19 mV, 50 ms). H1, Steady-state inactivation of ILVA and IHVA were calculated by normalizing the test pulse-evoked current amplitude to the maximum current amplitude and were plotted over the prepulse Vm. Data points were fitted with Boltzmann function and illustrated as solid black (IHVA) and gray (ILVA) lines. Dashed lines are the Boltzmann fits of the ILVA and IHVA activation kinetics from C2. H2, Mean V50: ILVA, −54.82 ± 0.81 mV; IHVA, −40.11 ± 2.76 mV; n = 8 and n = 5; p < 0.0001, unpaired t test. Mean inactivation slope factor (slope): ILVA, 5.06 ± 0.49; IHVA, 5.45 ± 0.87; n = 8 and n = 5; p = 0.6773, unpaired t test.
Figure 4.
Figure 4.
Ca2+ spikes present at cone photoreceptors. A1, Example of cone photoreceptor Vm change to current injections (6, 1, −4, −9, −14, and −24 pA) in current-clamp mode using K+-gluconate-based intracellular pipette solution. Arrowhead labels the initial fast rise of the Vm (spike) at the beginning of the stimulus. A2, Example trace of cone photoreceptor Vm change to the same level of current injections in the presence of 100 μm nickel (Ni2+). A3, Vm amplitude versus stimulus intensity plot. Significance was tested with a paired t test among each stimulus intensity (−22 pA, p = 0.7346; −18 pA, p = 0.1548; −14 pA, p = 0.2918; −10 pA, p = 0.3324; −6 pA, p = 0.0389; −2 pA, p < 0.0001; 2 pA, p < 0.0001; 6 pA, p = 0.2151; n = 6). B1, B2, Example traces of cone photoreceptor Vm change to current pulses (0, −5, −10, −15, −20, and −25 pA), in the absence (control, B1) and presence (gray, B2) of 5 μm Z944. B3, Vm amplitude versus stimulus intensity plot. Significance was tested with a paired t test in each stimulus intensity (−25 pA, p = 0.9846; −20 pA, p = 0.9583; −15 pA, p = 0.9467; −10 pA, p = 0.1408; −5 pA, p = 0.3731; 0 pA, p = 0.0485; 5 pA, p = 0.0498; 10 pA, p = 0.2916; n = 7). C1, C2, Example traces of cone photoreceptor Vm change to current pulses (2, −4, −10, −16, and −22 pA), in the absence (control; C1) and presence (Nife; gray; C2) of 10 μm nifedipine. C3, Vm amplitude versus stimulus intensity plot. Significance was tested with a paired t test in each stimulus intensity (−35 pA, p = 0.1143; −30 pA, p = 0.1352; −25 pA, p = 0.1362; −20 pA, p = 0.9151; −15 pA, p = 0.5775; −10 pA, p = 0.0150; −5 pA, p = 0.0199; 0 pA, p = 0.050; n = 6). D1, D2, Example traces of cone photoreceptor Vm change to current pulses (0, −8, −12, −16, and −24 pA), in the absence (control; D1) and presence (TTX; gray; D2) of 1 μm tetrodotoxin. D3, Vm amplitude versus stimulus intensity plot. Significance was tested with paired t test in each stimulus intensity (−25 pA, p = 0.296; −20 pA, p = 0.1322; −15 pA, p = 0.2485; −10 pA, p = 0.1641; −5 pA, p = 0.6813; 0 pA, p = 0.1703; 5 pA, p = 0.3681; n = 4). E1, E2, Example traces of cone photoreceptor Vm change to current pulses (2, −4, −10, −13, and −19 pA), in the absence (control; E1) and presence (Cs+; gray; E2) of 1 μm CsCl. E3, Vm amplitude versus stimulus intensity plot. Significance was tested with paired t test in each stimulus intensity (−25 pA, p = 0.2575; −20 pA, p = 0.2498; −15 pA, p = 0.2172; −10 pA, p = 0.1939; −5 pA, p = 0.1366; 0 pA, p = 0.0712; 5 pA, p = 0.0512; n = 5).
Figure 5.
Figure 5.
Spontaneous spike activity at dark Vm. A1–C2, Example Vm changes in control condition and during 100 μm nickel (Ni2+), 10 μm nifedipine (Nife), and 5 μm Z944 application. C3, Peak Vm of spontaneous spike events: control, −13.3 ± 2.50 mV; Z944, −19.45 ± 3.13 mV; n = 7; p = 0.0337, paired t test. Spontaneous spike frequency: control, 1.45 ± 0.38 Hz; Z944, 1.1 ± 0.32 Hz; n = 7; p = 0.2462, paired t test. Half-width: control, 38.0 ± 2.50 ms; Z944, 50.68 ± 3.13 ms; p = 0.0145, paired t test; n = 7. D, Summary of spike parameters generated in control condition. Frequency, 1.47 ± 0.23; peak Vm, −13.56 ± 1.72 mV; baseline Vm, −40. 57 ± 0.50 mV; half-width, 31.96 ± 1.72 ms. E1, Example of a spontaneous spike in cone photoreceptors. E2, Time derivative of the Vm of the trace in E1 plotted against Vm. E3, Zoomed in region of the rising phase from E2. Dashed gray line, Exponential fit to estimate the average of the trace; straight gray lines, 7.5% of the maximal rise rate reveals the Vm threshold of the spike. E4, Vm at 0.22 dV/dt: −36.17 ± 0.29 mV; n = 14; maximal Vm rise rate: 3.17 ± 0.24 mV/ms; n = 14. F1, Example Vm changes at near body temperature (33°C). F2, Frequency of spikes, 1.05 ± 0.17 Hz; peak Vm, −10.65 ± 2.05 mV; baseline, −35.52 ± 1.1 mV; half-width, 27.77 ± 4.3 ms. Room temperature versus 33°C: frequency, p = 0.2610; peak Vm, p = 0.3458; baseline, p = 0.0002; half-width, p = 0.4844, unpaired t test; n = 12 and n = 5, respectively. G1, Example trace showing Vm changes evoked by full-field light flash (300 ms, ∼130 W/cm2 irradiance) in dark-adapted cone photoreceptor. G2, Vm before light stimulation (Dark Vm), −39.65 ± 0.99 mV; light response evoked Vm hyperpolarization (Vmin), −53.96 ± 2.46 mV; offset of the light response (Vmax), −3.61 ± 4.08 mV.
Figure 6.
Figure 6.
Spikes cause intracellular Ca2+ rise in cone photoreceptor terminals. A, Example of simultaneous current-clamp recording (from −13 to −4 pA, 5 s) and Ca2+ imaging with 100 μm Fluo-4 in the cone photoreceptor terminal. Pictures in the top panel were taken from the patched cone photoreceptor terminal at the time points labeled with arrows (t1t3). B, Example of simultaneous current-clamp recording and Ca2+ imaging during stronger stimulation (from −13 to −2 pA, 5 s). Arrows indicate Ca2+ rise because of the individual spike events. C, Linear relationships between the timing of spike and Ca2+ signal peak (p < 0.0001, R2 = 0.9992). D, Relative Ca2+ change during spikes (ΔF/F0), 1.08 ± 0.33; Δt between spike peak amplitude and Ca2+ signal peak (Δt), 30.58 ± 8.36 ms.
Figure 7.
Figure 7.
LVA Ca2+ channels boost synaptic vesicle release. A1, Black, Example traces showing ICa and Cm induced by a voltage step (from −69 to −19 mV, 25 ms) at cone photoreceptors. Stim, Stimulus; Gm, membrane conductance; Gs, series conductance; gray, ICa and Cm induced by a voltage step (from −39 to −19 mV, 25 ms). Labeling similar to black traces. A2, QICa: Vh = −69 mV: 1.35 ± 0.19 pC; Vh = −39 mV: 0.83 ± 0.06 pC; n = 7; p = 0.0003, paired t test; Cm: Vh = −69 mV: 75.62 ± 4.69 fF; Vh = −39 mV: 45.02 ± 2.90 fC; n = 7; p = 0.0003, paired t test. B1, Black, Example traces of ICa and Cm jump induced by voltage stimulus (from −69 to −19 mV, 25 ms), Patch pipette contained 5 mm EGTA. Gray, Same as black but in the presence of 10 μm nifedipine. B2, QICa: control, 1.16 ± 0.19 pC; Nife, 0.59 ± 0.09 pC; n = 6; p = 0.0047, paired t test; Cm: control, 90.99 ± 10.73 fF; Nife, 76.23 ± 9.52 fF; n = 6; p = 0.0007, paired t test. C1, Black, Example traces of ICa and Cm change induced by a voltage step (from −69 to −19 mV, 25 ms). Pipette contained 10 mm BAPTA. Gray, Same as black but in the presence of 10 μm nifedipine. C2, QICa: control: 1.28 ± 0.10 pC, n = 5; Nife: 0.74 ± 0.04 pC, n = 5; p = 0.0021, paired t test; Cm: control: 35.16 ± 5.18 fF, n = 5; Nife: 18.45 ± 2.23 fF, n = 5; p = 0.0063, paired t test. D1, Black, Example traces of ICa and Cm jump induced by a voltage step (from −69 to −39 mV, 25 ms). Pipette contained 5 mm EGTA. Gray, Same as black but with 10 mm BAPTA-containing intracellular solution. D2, QICa: 5 mm EGTA, 0.36 ± 0.04 pC; 10 mm BAPTA, 0.34 ± 0.03 pC; n = 5 and n = 4; p = 0.7302, unpaired t test; Cm: 5 mm EGTA, 83.68 ± 13.76 fF; 10 mm BAPTA, 16.61 ± 3.99 fF; n = 5 and n = 4; p = 0.0159, unpaired t test. E, Paired comparison of (−19 mV, 25 ms; strong) and mild (−39 mV, 25 ms; mild) stimulus evoked QICa with 5 mm EGTA containing intracellular solution. Mild, QICa = 0.36 ± 0.04 pC; strong, QICa = 1.09 ± 0.1 pC; n = 5; p = 0.0005, paired t test. Mild, ΔCm = 83.68 ± 13.76 fF; strong, ΔCm = 95.24 + 12.42 fF; n = 5; p = 0.0021, paired t test. F, Paired comparison of strong (−19 mV, 25 ms) and mild (−39 mV, 25 ms) stimulus-evoked QICa with 10 mm BAPTA containing intracellular solution. Mild: QICa = 0.33 ± 0.03 pC; strong: QICa = 1.12 ± 0.04 pC; n = 4; p = 0.0005, paired t test; mild: ΔCm = 16.61 ± 3.99 fF; p = 0.0005; strong: ΔCm = 55.97 ± 9.44 fF; n = 4; p = 0.01, paired t test.
Figure 8.
Figure 8.
Analysis of T-type Ca2+ channels in sorted photoreceptors. A1, FACS strategy for isolating rod photoreceptors by FSC/SSC. A2, FACS strategy for isolating cone photoreceptors by GFP fluorescence of Rac3-eGFP mice. B1, Nested RT-PCR analysis of sorted cone and rod photoreceptor samples with LVA-specific primer pairs for Cav3.1, Cav3.2, and Cav3.3. A distinct band is present for the cone photoreceptor sample using Cav3.2 primers, whereas no bands can be observed for the sorted rod photoreceptor population. B2, Conventional RT-PCR with primers for Rho, Opn1sw, and Actb on sorted rod and cone photoreceptors. Strong bands are visible for Opn1sw and Rho in cone and rod photoreceptor samples, respectively, as well as for Actb. C1, C2, RT-PCR analysis of whole-retina and negative control samples, in which reverse transcriptase was omitted during cDNA synthesis (retina, –RT). For whole retina, the following expected bands are present: Cav3.1 (271 bp), Cav3.2 (305 bp), Cav3.3 (258 bp), Rho (81 bp), Opn1sw (175 bp), and Actb (196 bp). No bands are visible for retina –RT samples.

References

    1. Adler EM, Augustine GJ, Duffy SN, Charlton MP (1991) Alien intracellular calcium chelators attenuate neurotransmitter release at the squid giant synapse. J Neurosci 11:1496–1507. 10.1523/JNEUROSCI.11-06-01496.1991 - DOI - PMC - PubMed
    1. Akopian A, Witkovsky P (1996) D2 dopamine receptor-mediated inhibition of a hyperpolarization-activated current in rod photoreceptors. J Neurophysiol 76:1828–1835. 10.1152/jn.1996.76.3.1828 - DOI - PubMed
    1. Angstadt JD, Calabrese RL (1991) Calcium currents and graded synaptic transmission between heart interneurons of the leech. J Neurosci 11:746–759. 10.1523/JNEUROSCI.11-03-00746.1991 - DOI - PMC - PubMed
    1. Babai N, Sendelbeck A, Regus-Leidig H, Fuchs M, Mertins J, Reim K, Brose N, Feigenspan A, Brandstätter JH (2016) Functional roles of complexin 3 and complexin 4 at mouse photoreceptor ribbon synapses. J Neurosci 36:6651–6667. 10.1523/JNEUROSCI.4335-15.2016 - DOI - PMC - PubMed
    1. Babai N, Gierke K, Müller T, Regus-Leidig H, Brandstätter JH, Feigenspan A (2019) Signal transmission at invaginating cone photoreceptor synaptic contacts following deletion of the presynaptic cytomatrix protein Bassoon in mouse retina. Acta Physiol (Oxf) 226:e13241. 10.1111/apha.13241 - DOI - PubMed

Publication types

LinkOut - more resources