. 2022 Jul 8;13(1):3942.
doi: 10.1038/s41467-022-31394-1.

The effect of COVID certificates on vaccine uptake, health outcomes, and the economy

Affiliations

The effect of COVID certificates on vaccine uptake, health outcomes, and the economy

Miquel Oliu-Barton et al. Nat Commun. .

Abstract

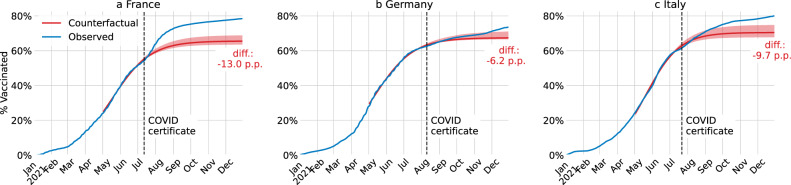
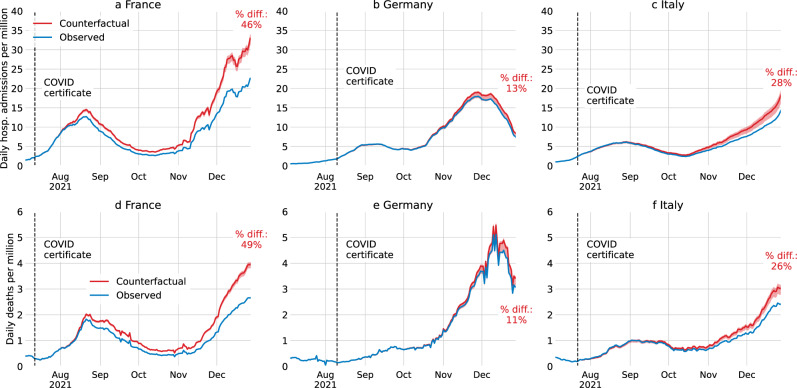
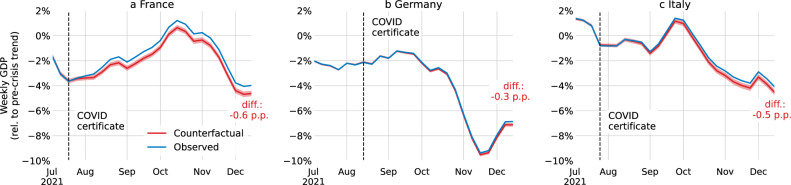
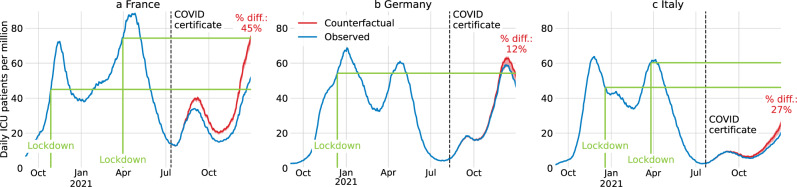
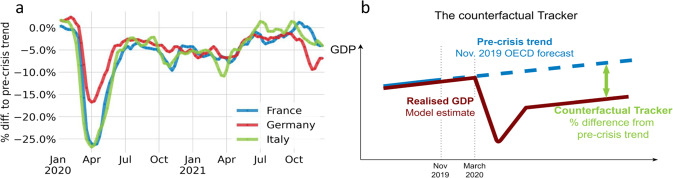
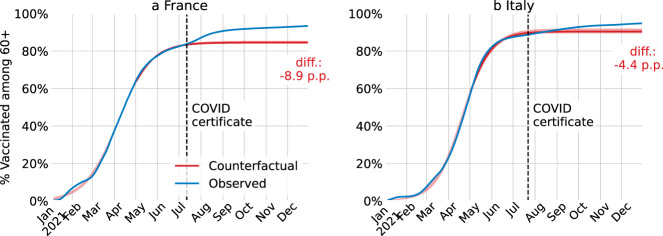
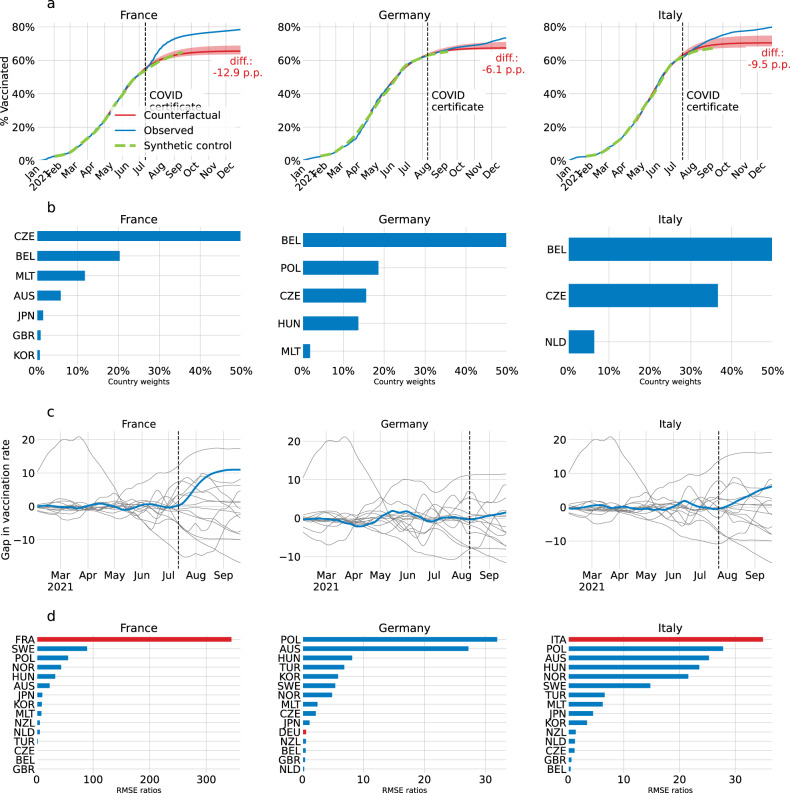
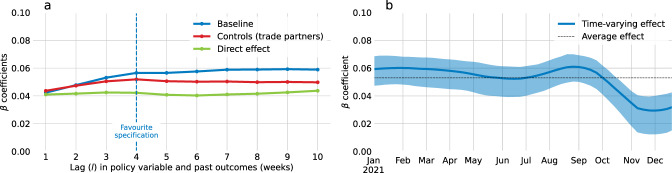
In the COVID-19 pandemic many countries required COVID certificates, proving vaccination, recovery, or a recent negative test, to access public and private venues. We estimate their effect on vaccine uptake for France, Germany, and Italy using counterfactuals constructed via innovation diffusion theory. The announcement of COVID certificates during summer 2021 were associated - although causality cannot be directly inferred - with increased vaccine uptake in France of 13.0 (95% CI 9.7-14.9) percentage points (p.p.) of the total population until the end of the year, in Germany 6.2 (2.6-6.9) p.p., and in Italy 9.7 (5.4-12.3) p.p. Based on these estimates, an additional 3979 (3453-4298) deaths in France, 1133 (-312-1358) in Germany, and 1331 (502-1794) in Italy were averted; and gross domestic product (GDP) losses of €6.0 (5.9-6.1) billion in France, €1.4 (1.3-1.5) billion in Germany, and €2.1 (2.0-2.2) billion in Italy were prevented. Notably, in France, the application of COVID certificates averted high intensive care unit occupancy levels where prior lockdowns were instated.


Conflict of interest statement

A.F. is a member of the French COVID-19 Scientific Council and a member of the French COVID-19 Vaccine Strategy Committee. PM chairs the French Council of Economic Analysis, an independent council attached to the Prime Minister. G.B.W. is a member of the G20 High Level Independent Panel on Financing the Global Commons for Pandemic Preparedness and Response. The authors declare no other competing interests.

Figures

Fig. 1
Fig. 1. Estimated vaccine uptake with and without COVID certificates.
For France (a), Germany (b), and Italy (c), cumulative share of the population who received at least one COVID-19 vaccine dose in the actual intervention deployment (blue) and in the no-intervention counterfactual scenario (red). The red shaded area is the 95% confidence interval centred around the main estimate. The black dashed vertical line is the date of the announcement of the COVID certificate.
Fig. 2
Fig. 2. Estimated hospital admissions and deaths with and without COVID certificates.
For France (a and d), Germany (b and e), and Italy (c and f), daily hospital admissions (top row) and deaths (bottom row) per million (7-day rolling average) in the actual intervention deployment (blue) and in the no-intervention counterfactual scenario (red). The red shaded area is the 95% confidence interval centred around the main estimate. The daily death counterfactuals for France and Italy, and the daily hospital admissions counterfactual for France are computed using an age-stratified model. The other counterfactuals are not based on age-stratified models due to unavailable data. The black dashed vertical line is the date of the announcement of the COVID certificate.
Fig. 3
Fig. 3. Estimated weekly GDP with and without COVID certificates.
For France (a), Germany (b), and Italy (c), weekly GDP (3-week rolling average) in the actual intervention deployment (blue) and in the no-intervention counterfactual scenario (red). The red shaded area is the 95% confidence interval centred around the main estimate. The black dashed vertical line is the date of the announcement of the COVID certificate.
Fig. 4
Fig. 4. Estimated ICU patients with and without COVID certificates.
For France (a), Germany (b), and Italy (c), daily COVID-19 patients in intensive care units (ICUs) per million (7-day rolling average) in the actual intervention deployment (blue) and in the no-intervention counterfactual scenario (red). The red shaded area is the 95% confidence interval centred around the main estimate. The counterfactual for France is based on an age-stratified model. The other counterfactuals are not based on age-stratified models due to unavailable data. Green lines indicate levels at which previous lockdowns were instated. The black dotted vertical line is the date of the announcement of the COVID certificate.
Fig. 5
Fig. 5. The OECD weekly tracker.
a OECD Weekly Tracker for France, Germany, and Italy. b Schematic depiction of the OECD Weekly Tracker that is providing a proxy of weekly GDP relative to the pre-crisis trend based on Google Trends search data and machine learning.
Fig. 6
Fig. 6. Realised and counterfactual vaccination rates for the population over age 60.
For France (a) and Italy (b), cumulative proportion of the population over age 60 who received at least one COVID-19 vaccine dose in the actual intervention deployment (blue) and in the no-intervention counterfactual scenario (red). The red shaded area is the 95% confidence interval centred around the main estimate. The counterfactual scenario is estimated via innovation diffusion theory. The black dashed vertical line is the date of the announcement of the COVID certificate.
Fig. 7
Fig. 7. Alternative counterfactual via synthetic control.
a For France, Germany, and Italy, cumulative share of the population who received at least one COVID-19 vaccine dose in the actual intervention deployment (blue), in the no-intervention counterfactual scenario via innovation diffusion theory (red) with 95% confidence interval centred around the main estimate (shaded red), and in the no-intervention synthetic control scenario (green, dashed). The red shaded area is the 95% confidence interval of the counterfactual scenario via innovation diffusion theory, which is centred around the main estimate. Note that the synthetic control scenario ends on 22 September 2021, when the method becomes infeasible. The black dashed vertical line is the date of the announcement of the COVID certificate. b Country weights for synthetic control for France, Germany, and Italy. c Placebos for France, Germany, and Italy in blue and in grey for donor pool countries. d Root mean squared prediction errors (RMSPE) ratios for France, Germany, and Italy (red) and the donor pool countries (blue).
Fig. 8
Fig. 8. Robustness checks for varying lags and time-varying impact of vaccination.
a Main regression coefficients for various lag values. b Time-varying estimate of the impact of vaccination on economic activity. The blue shaded area is the 95% confidence interval obtained from 100 bootstrap samples and centred around the main estimate (blue). The black dashed line indicates the average effect across time.

References

    1. Wu F, et al. A new coronavirus associated with human respiratory disease in China. Nature. 2020;579:265–269. doi: 10.1038/s41586-020-2008-3. - DOI - PMC - PubMed
    1. Hsiang S, et al. The effect of large-scale anti-contagion policies on the COVID-19 pandemic. Nature. 2020;584:262–267. doi: 10.1038/s41586-020-2404-8. - DOI - PubMed
    1. Flaxman S, et al. Estimating the effects of non-pharmaceutical interventions on COVID-19 in Europe. Nature. 2020;584:257–261. doi: 10.1038/s41586-020-2405-7. - DOI - PubMed
    1. Oliu-Barton M, et al. SARS-CoV-2 elimination, not mitigation, creates best outcomes for health, the economy, and civil liberties. Lancet. 2021;397:2234–2236. doi: 10.1016/S0140-6736(21)00978-8. - DOI - PMC - PubMed
    1. Oliu-Barton M, et al. Elimination versus mitigation of SARS-CoV-2 in the presence of effective vaccines. Lancet Glob. Health. 2022;10:142–147. doi: 10.1016/S2214-109X(21)00494-0. - DOI - PMC - PubMed

Publication types