. 2022 Jul 8;13(7):591.
doi: 10.1038/s41419-022-05044-9.

High levels of NRF2 sensitize temozolomide-resistant glioblastoma cells to ferroptosis via ABCC1/MRP1 upregulation

Affiliations

High levels of NRF2 sensitize temozolomide-resistant glioblastoma cells to ferroptosis via ABCC1/MRP1 upregulation

I de Souza et al. Cell Death Dis. .

Abstract

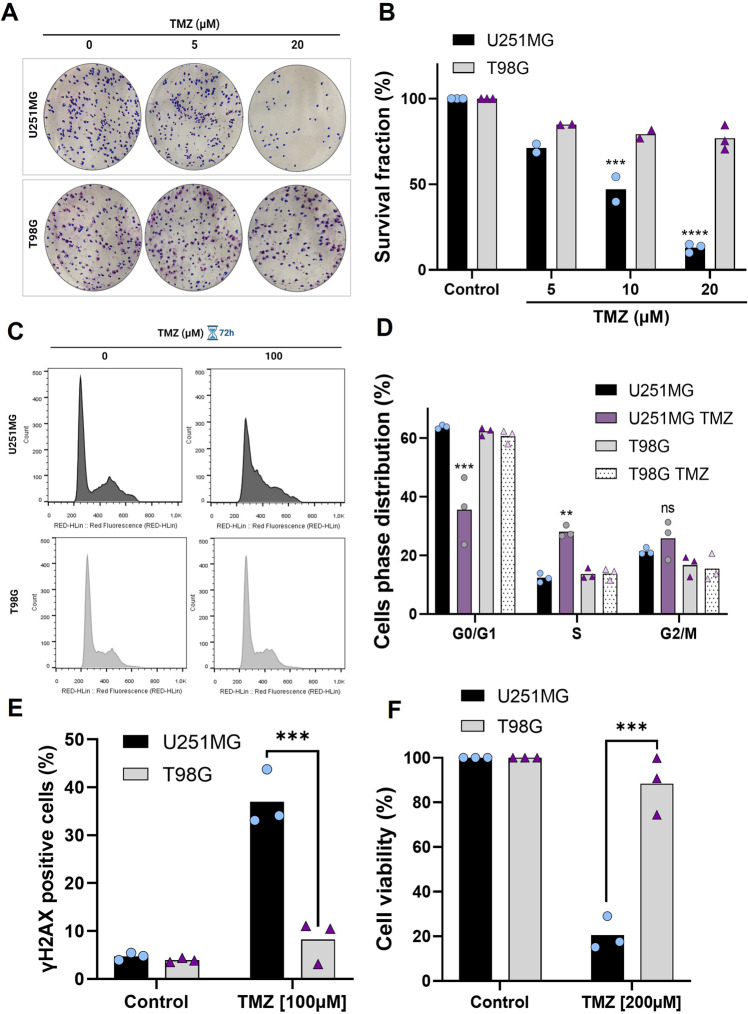
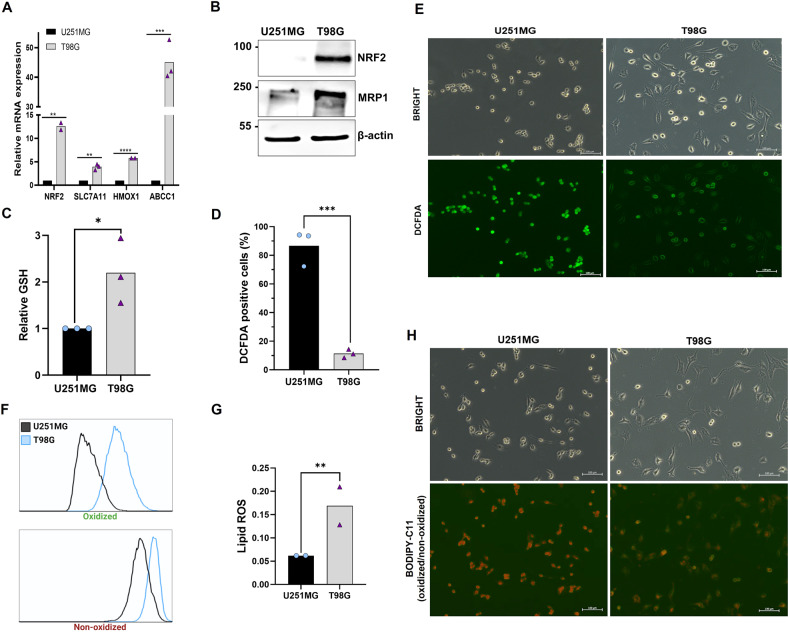
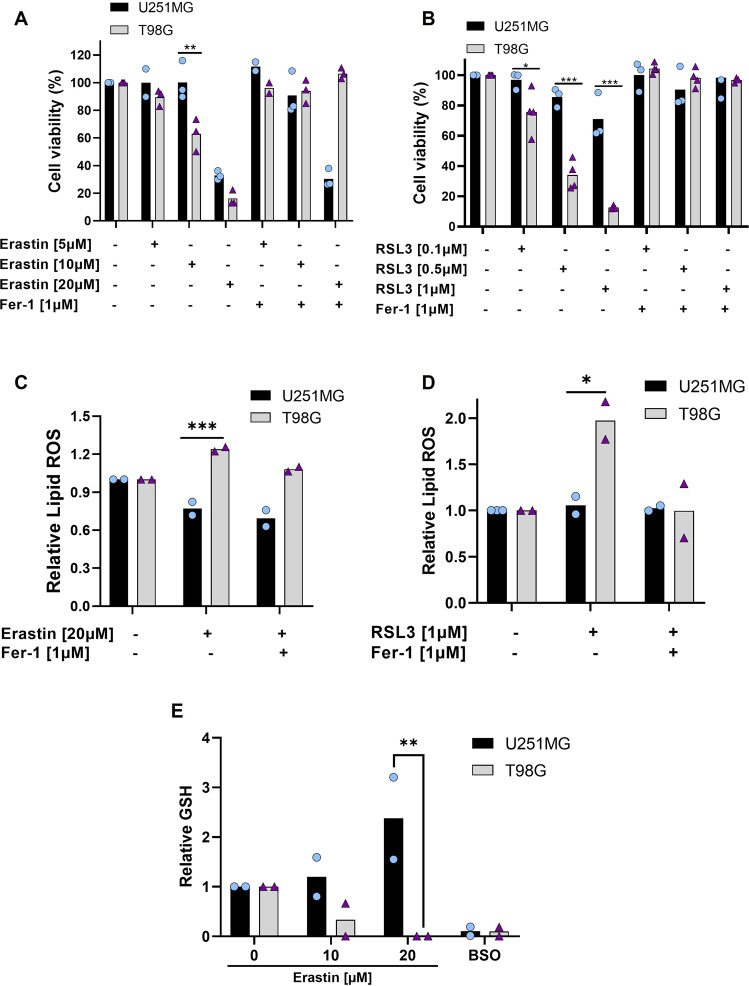
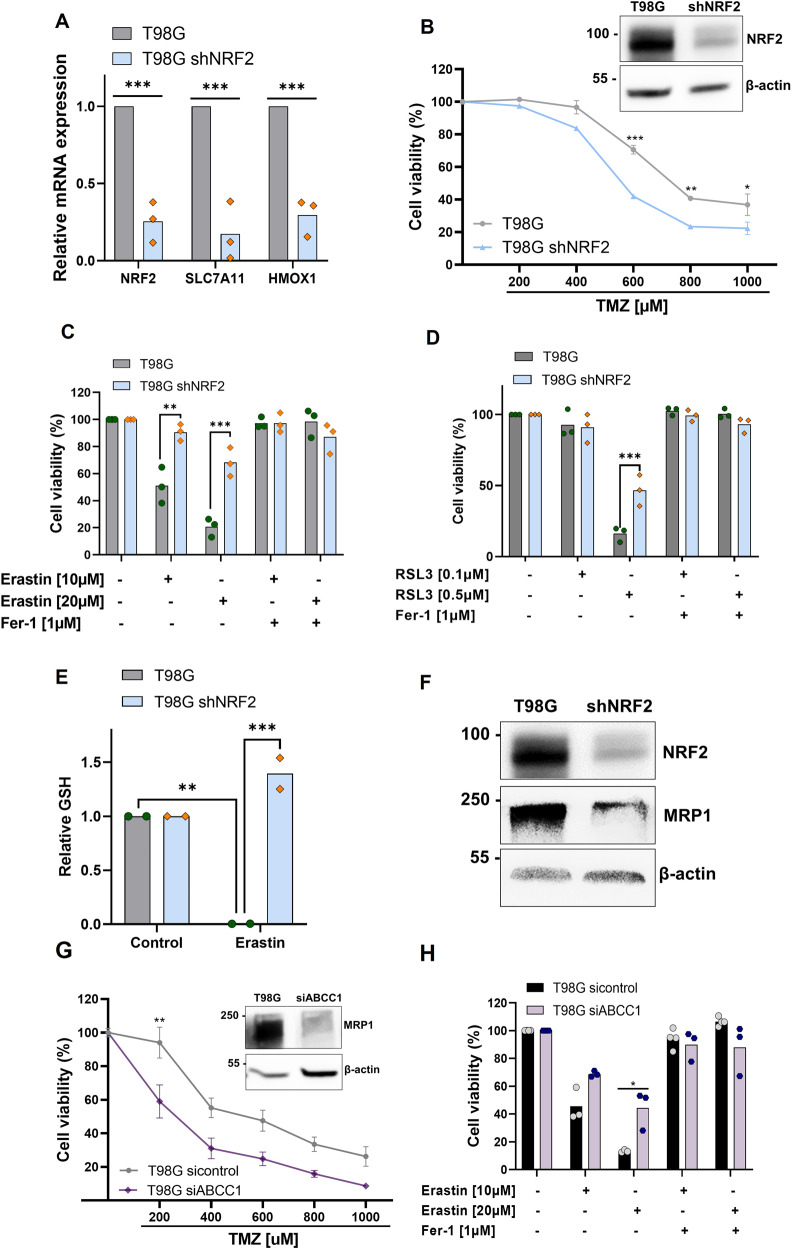
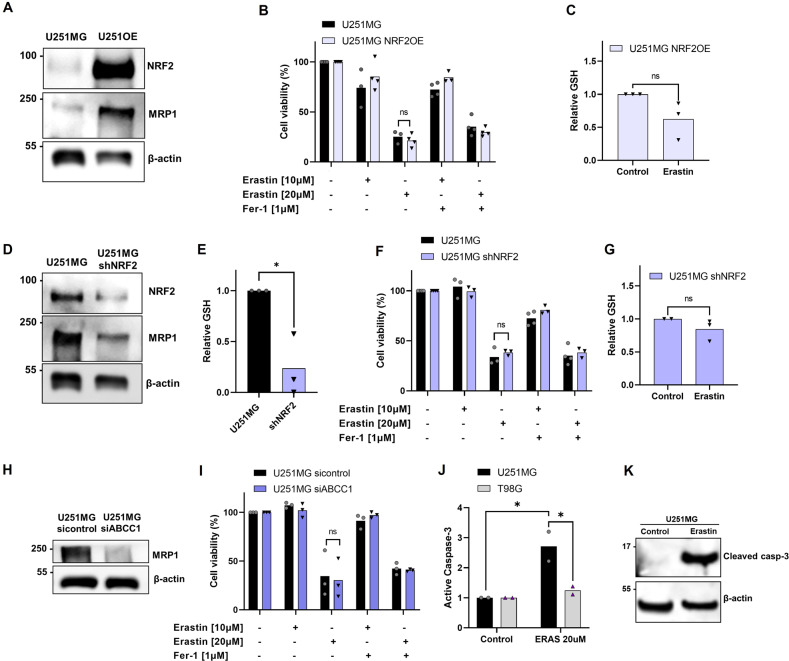
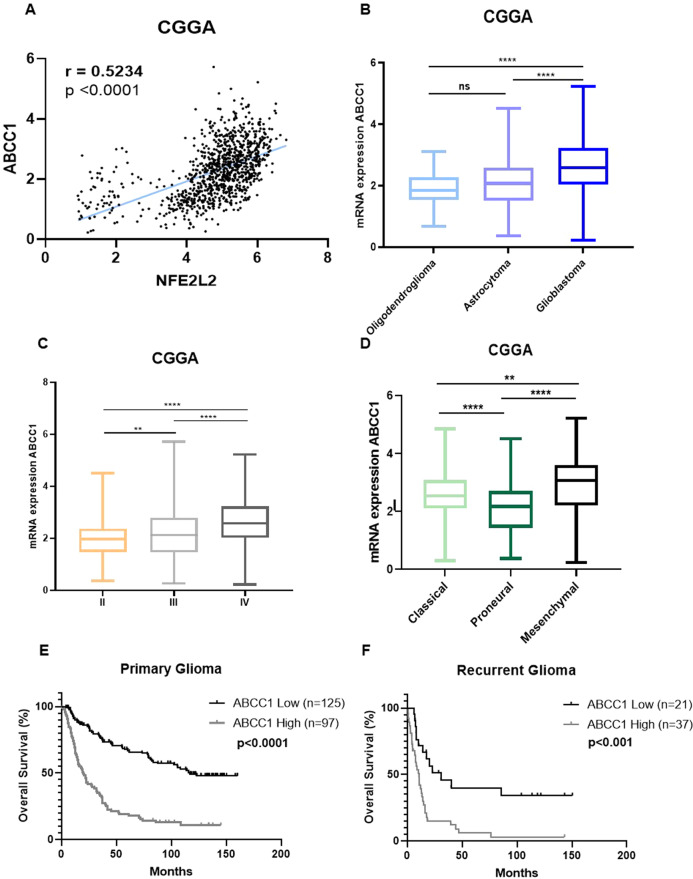
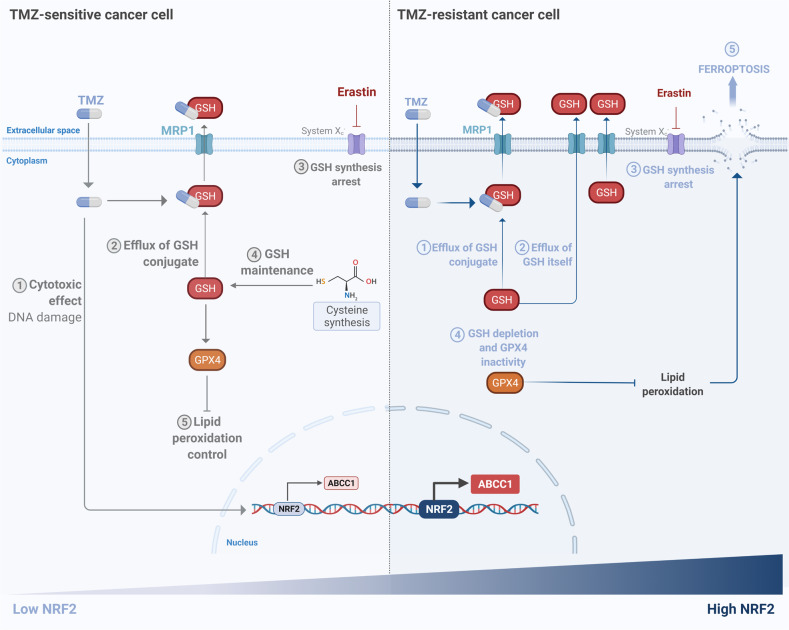
Glioblastoma patients have a poor prognosis mainly due to temozolomide (TMZ) resistance. NRF2 is an important transcript factor involved in chemotherapy resistance due to its protective role in the transcription of genes involved in cellular detoxification and prevention of cell death processes, such as ferroptosis. However, the relation between NRF2 and iron-dependent cell death in glioma is still poorly understood. Therefore, in this study, we analyzed the role of NRF2 in ferroptosis modulation in glioblastoma cells. Two human glioblastoma cell lines (U251MG and T98G) were examined after treatment with TMZ, ferroptosis inducers (Erastin, RSL3), and ferroptosis inhibitor (Ferrostatin-1). Our results demonstrated that T98G was more resistant to chemotherapy compared to U251MG and showed elevated levels of NRF2 expression. Interestingly, T98G revealed higher sensitivity to ferroptosis, and significant GSH depletion upon system xc- blockage. NRF2 silencing in T98G cells (T98G-shNRF2) significantly reduced the viability upon TMZ treatment. On the other hand, T98G-shNRF2 was resistant to ferroptosis and reverted intracellular GSH levels, indicating that NRF2 plays a key role in ferroptosis induction through GSH modulation. Moreover, silencing of ABCC1, a well-known NRF2 target that diminishes GSH levels, has demonstrated a similar collateral sensitivity. T98G-siABCC1 cells were more sensitive to TMZ and resistant to Erastin. Furthermore, we found that NRF2 positively correlates with ABCC1 expression in tumor tissues of glioma patients, which can be associated with tumor aggressiveness, drug resistance, and poor overall survival. Altogether, our data indicate that high levels of NRF2 result in collateral sensitivity on glioblastoma via the expression of its pro-ferroptotic target ABCC1, which contributes to GSH depletion when the system xc- is blocked by Erastin. Thus, ferroptosis induction could be an important therapeutic strategy to reverse drug resistance in gliomas with high NRF2 and ABCC1 expression.


Conflict of interest statement

The authors declare no competing interests.

Figures

Fig. 1
Fig. 1. Differential response of glioma cells to TMZ treatment.
A Representative images of colonies formed in each group treated with 5 and 20 µM TMZ. B Quantification of total colonies after TMZ treatment (5, 10, and 20 µM) in comparison to controls. C Histograms represent cell cycle distribution with TMZ treatment for 72 h. D Cell cycle distribution was conducted by flow cytometer analysis after TMZ treatment (100 μM) for 72 h. E Flow cytometry analysis of the percentage of γH2AX positive cells upon treatment with TMZ (100 μM) for 48 h. F Cell viability was analyzed 120 h after treatment with TMZ (200 μM) and measured by XTT assay. Values are mean ± SEM of three independent experiments, ns = not statistically significant, *P < 0.05, **P < 0.01, ***P < 0.001, ****P < 0.0001. Each dot represents an independent experiment.
Fig. 2
Fig. 2. NRF2 and lipoperoxidation levels in glioblastoma.
A Quantitative real-time PCR analysis of NRF2, SLC7A11, HMOX1, and ABCC1 mRNA levels in glioblastoma cells. B Detection of NRF2 and MRP1 protein by western blot in U251MG and T98G cell lines. C Quantification of basal intracellular GSH in both glioblastoma cells. D Basal level of ROS detected by DCFDA probe and analyzed by flow cytometry. E Fluorescence microscopy representative images of basal DCFDA fluorescence in U251MG and T98G. Scale bar: 100 μm. F Representative histograms of lipid peroxidation in U251MG and T98G. Cellular stress was induced by RSL3 (1 μM) treatment and lipid peroxidation was measured by BODIPY-C11 581/591 probe by flow cytometry (G) and the ratio of oxidized/non-oxidized cells was calculated. H Fluorescence microscopy representative images of basal BODIPY-C11 fluorescence in U251MG and T98G. Scale bar: 100 μm. Values are mean ± SEM of two or three independent experiments, ns = not statistically significant, *P < 0.05, **P < 0.01, ***P < 0.001, ****P < 0.0001. Each dot represents an independent experiment.
Fig. 3
Fig. 3. Differential sensitivity of glioma cells to ferroptosis.
A Cells were treated with Erastin (5, 10, and 20 μM) and Ferrostatin-1 (1 μM) for 72 h, and cell viability was measured by XTT assay. B Cell viability under another ferroptosis inducer, RSL3 (0.1, 0.5, and 1 μM), and Ferrostatin-1 (1 μM) for 72 h was tested by XTT assay. C Cells were treated with Erastin (20 μM) and Ferrostatin-1 (1 μM), after 24 h lipid ROS was detected by BODIPY-C11 probe (ratio oxidized/non-oxidized) and analyzed by flow cytometry. D Lipid ROS also was measured by the BODIPY-C11 probe (ratio oxidized/non-oxidized) after RSL3 (1 μM) and Fer-1 (1 μM) treatment for 24 h. E Intracellular GSH level quantification after treatment with Erastin (10 and 20 μM) and BSO (1 mM) for 24 h. Values are mean ± SEM of two or three independent experiments, ns = not statistically significant, *P < 0.05, **P < 0.01, ***P < 0.001, ****P < 0.0001. Each dot represents an independent experiment.
Fig. 4
Fig. 4. NRF2 high expression promotes ferroptosis sensitivity through MRP1 regulation.
A Quantitative real-time PCR analysis of NRF2, SLC7A11, and HMOX1 mRNA levels in T98G wildtype cell line and T98G transduced with shNRF2 lentivirus. B A dose-response curve of T98G and T98G-shNRF2 cell lines treated with increasing concentrations of TMZ (200–1000 μM) and analyzed 120 h after drug treatment measured by XTT assay/ NRF2 detection protein by western-blot in T98G and T98G-NRF2 silenced cell. C Cells were treated with Erastin (10 and 20 μM) and Ferrostatin-1 (1 μM) for 72 h and viability was measured by XTT assay. D Cells were treated with RSL3 (0.1 and 0.5 μM) and Ferrostatin-1 (1 μM) for 72 h, and viability was measured by XTT assay. E Quantification of GSH intracellular levels after Erastin (20 μM) treatment for 24 h in T98G and T98G-shNRF2. F NRF2 and MRP1 detection protein by western-blot in T98G and T98G-shNRF2. G A dose-response curve of T98G and T98G siABCC1 cell lines treated with increasing concentrations of TMZ (200–1000 μM) and analyzed 120 h after drug treatment measured by XTT assay/ NRF2 and MRP1 detection protein by western-blot in T98G and T98G siABCC1. H Cell viability analysis following Erastin treatment (10 and 20 μM) for 72 h in T98G wildtype and ABCC1 silenced cells measured by XTT assay. Values are mean ± SEM of two or three independent experiments, ns = not statistically significant, *P < 0.05, **P < 0.01, ***P < 0.001, ****P < 0.0001. Each dot represents an independent experiment.
Fig. 5
Fig. 5. U251MG cells are resistant to ferroptosis.
A NRF2 and MRP1 detection protein by western-blot in U251MG and U251MG NRF2 OE. B Cell viability analysis following Erastin treatment (10 and 20 μM) and Ferrostatin-1 (1 μM) for 72 h in U251MG wildtype and NRF2 overexpressed cells measured by XTT assay. C Quantification of GSH intracellular levels after Erastin (20 μM) treatment for 24 h in U251MG NRF2 OE. D NRF2 and MRP1 detection protein by western-blot in U251MG and U251MG shNRF2. E Quantification of basal GSH intracellular levels in U251MG and U251MG shNRF2. F Cell viability analysis following Erastin treatment (10 and 20 μM) and Ferrostatin-1 (1 μM) for 72 h in U251MG wildtype and shNRF2 cells measured by XTT assay. G Quantification of GSH intracellular levels after Erastin (20 μM) treatment for 24 h in U251MG shNRF2. H MRP1 detection protein by western-blot in U251MG sicontrol and U251MG siABCC1 cells. I Cell viability analysis following Erastin treatment (10 and 20 μM) and Ferrostatin-1 (1 μM) for 72 h in U251MG sicontrol and U251MG siABCC1 cells measured by XTT assay. J Flow cytometry analysis of the percentage of active caspase-3. K Western blot detection of cleaved caspase-3 in U251MG cells after treatment with Erastin (20 μM). Values are mean ± SEM of two or three independent experiments, ns = not statistically significant, *P < 0.05, **P < 0.01, ***P < 0.001, ****P < 0.0001. Each dot represents an independent experiment.
Fig. 6
Fig. 6. Gene expression analysis of glioma patients.
A Correlation between NRF2 and its target ABCC1 in glioma patients. B ABCC1 mRNA expression in the CGGA cohort of patients stratified by histology; C grade; D and glioma subtype. E Kaplan–Meier curves showing overall survival of primary and F recurrent glioma patients from the CGGA cohort stratified according to ABBC1 expression. Patients were subgrouped into high ABCC1 expression (above median) and low ABCC1 expression (below median). ns = not statistically significant, *P < 0.05, **P < 0.01, ***P < 0.001, ****P < 0.0001.
Fig. 7
Fig. 7. Schematic view of the mechanism of ferroptosis sensitivity in drug-resistant glioma cells.
TMZ-resistant cells have higher expression of NRF2 and, consequently, higher levels of ABCC1/MRP1. Upon treatment with TMZ, GSH mediates drug efflux by GSH-conjugate through MRP1 channels enhancing chemotherapy tolerance. Simultaneously, higher levels of MRP1 promote GSH efflux. Upon treatment with Erastin, there was a decrease in GSH synthesis, which is accentuated by GSH efflux through MRP1 promoting GPX4 inactivity and sensitizing these cells to ferroptosis. In contrast, TMZ-sensitive cells can obtain cysteine through compensatory mechanisms to generate GSH synthesis, thus they become resistant to ferroptosis. Created with BioRender.com.

References

    1. Louis DN, Perry A, Reifenberger G, Von Deimling A, Figarella-Branger D, Cavenee WK, et al. The 2016 World Health Organization classification of tumors of the central nervous system: A summary. Acta Neuropathologica. 2016;131:803–20. doi: 10.1007/s00401-016-1545-1. - DOI - PubMed
    1. Stupp R, Mason WP, Van Den Bent MJ, Weller M, Fisher B, Taphoorn MJB, et al. Radiotherapy plus concomitant and adjuvant temozolomide for glioblastoma. N Engl J Med. 2015;352:987–96. doi: 10.1056/NEJMoa043330. - DOI - PubMed
    1. Venur VA, Peereboom DM, Ahluwalia MS. Current medical treatment of glioblastoma. Cancer Treat Res. 2015;163:103–15. doi: 10.1007/978-3-319-12048-5_7. - DOI - PubMed
    1. Thomas AA, Brennan CW, DeAngelis LM, Omuro AM. Emerging therapies for glioblastoma. JAMA Neurol. 2014;71:1437–44. doi: 10.1001/jamaneurol.2014.1701. - DOI - PubMed
    1. Arora A, Somasundaram K. Glioblastoma vs temozolomide: Can the red queen race be won? Cancer Biol Ther. 2019;20:1083–90. doi: 10.1080/15384047.2019.1599662. - DOI - PMC - PubMed

Publication types

Substances