. 2022 Jul 8;13(1):3936.
doi: 10.1038/s41467-022-31683-9.

Pro-inflammatory cytokines mediate the epithelial-to-mesenchymal-like transition of pediatric posterior fossa ependymoma

Affiliations

Pro-inflammatory cytokines mediate the epithelial-to-mesenchymal-like transition of pediatric posterior fossa ependymoma

Rachael G Aubin et al. Nat Commun. .

Abstract

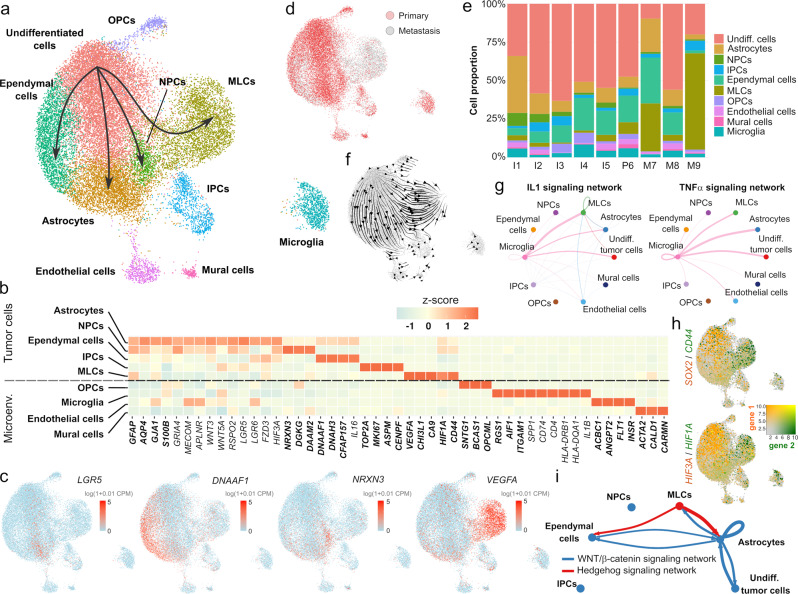
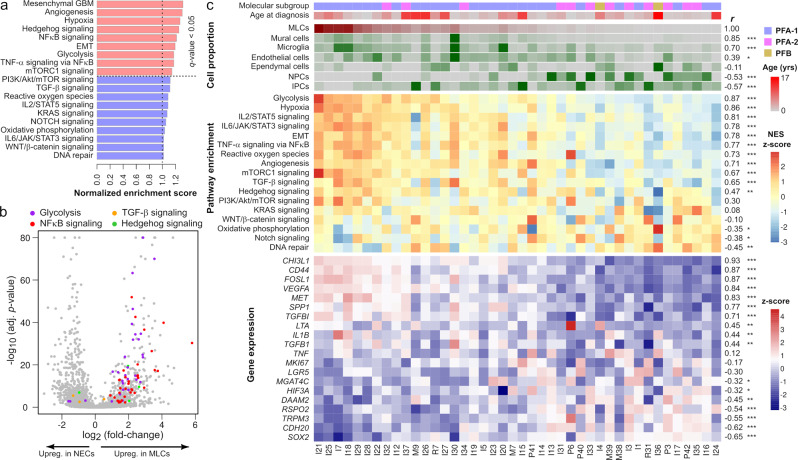
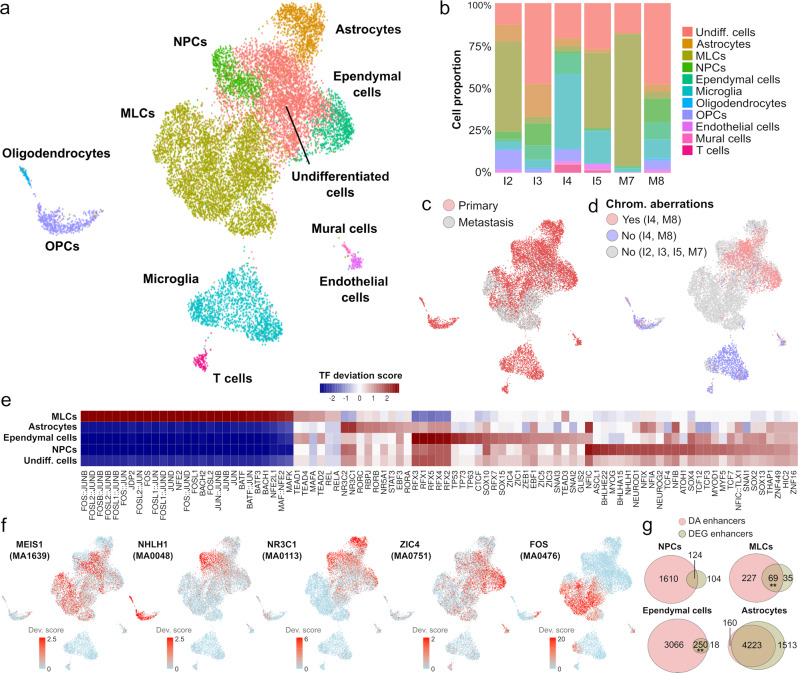
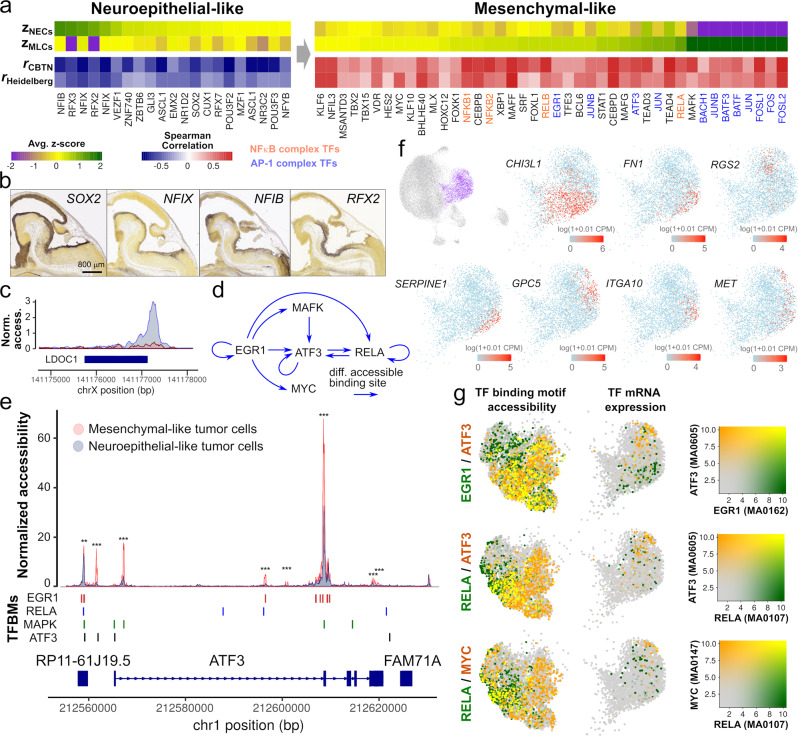
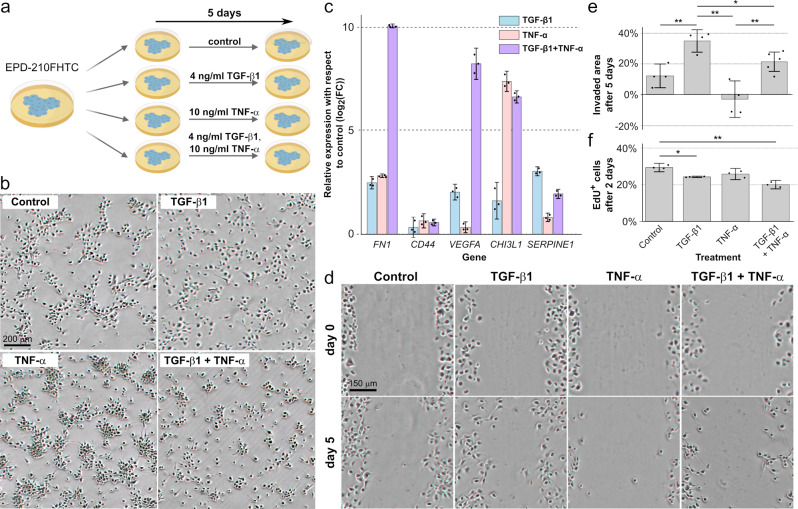
Pediatric ependymoma is a devastating brain cancer marked by its relapsing pattern and lack of effective chemotherapies. This shortage of treatments is due to limited knowledge about ependymoma tumorigenic mechanisms. By means of single-nucleus chromatin accessibility and gene expression profiling of posterior fossa primary tumors and distal metastases, we reveal key transcription factors and enhancers associated with the differentiation of ependymoma tumor cells into tumor-derived cell lineages and their transition into a mesenchymal-like state. We identify NFκB, AP-1, and MYC as mediators of this transition, and show that the gene expression profiles of tumor cells and infiltrating microglia are consistent with abundant pro-inflammatory signaling between these populations. In line with these results, both TGF-β1 and TNF-α induce the expression of mesenchymal genes on a patient-derived cell model, and TGF-β1 leads to an invasive phenotype. Altogether, these data suggest that tumor gliosis induced by inflammatory cytokines and oxidative stress underlies the mesenchymal phenotype of posterior fossa ependymoma.


Conflict of interest statement

The authors declare no competing interests.

Figures

Fig. 1
Fig. 1. Single-nucleus RNA-seq uncovers the gene expression programs of primary and metastatic posterior fossa ependymoma.
a Single-nucleus RNA-seq data of 25,349 cells from nine tumors. The UMAP representation of the data is colored and annotated by the 10 cell populations identified. The four tumor-derived cell lineages are indicated by arrows. b Selected differentially expressed genes for tumor-derived and non-tumor cell populations, including marker genes (bold) that were used to annotate the cell populations, as well as differentially expressed genes discussed in the main text. Neuroepithelial-like tumor cell populations (undifferentiated cells, astrocytes, NPCs, and ependymal cells) express multiple genes coding for components of the WNT signaling pathway, whereas MLCs express high levels of hypoxia- and angiogenesis-related genes, and microglia express pro-inflammatory cytokines. c The UMAP representation is colored by the expression level of several differentially expressed genes that are associated with individual tumor-derived cell populations. d UMAP representation showing the origin (primary/metastasis) of each cell. The mesenchymal-like cell population is mostly associated with metastatic tumors. e Stacked bar chart depicting the proportions of each cell type in each tumor. f RNA velocity stream plot. The inferred cell differentiation trajectories originate in the undifferentiated tumor cell population and are consistent with the four lineages of tumor-derived cells indicated in a. g IL1 (top) and TNF-α (bottom) cell-to-cell signaling networks inferred by CellChat based on differentially expressed genes that code for ligands and receptor/co-receptors. The two networks show abundant pro-inflammatory signaling from microglia onto the tumor cells. h The UMAP representation of the single-nucleus RNA-seq data is colored by the expression level of some of the differentially expressed genes between neuroepithelial- and mesenchymal-like tumor cell populations. The UMAPs depict the expression of SOX2 and CD44 (top), and HIF3A and HIF1A (bottom). i Cell-to-cell WNT and hedgehog signaling networks inferred by CellChat indicating a switch between WNT signaling in neuroepithelial-like tumor cell populations and hedgehog signaling in MLCs. IPCs intermediate progenitor tumor cells, MLCs mesenchymal-like tumor cells, NPCs neural progenitor tumor cells, OPCs oligodendrocyte progenitor cells.
Fig. 2
Fig. 2. The mesenchymal-like tumor cell population of posterior fossa ependymoma is associated with hypoxia, angiogenesis, glycolysis, and NFκB signaling gene expression programs.
a GSEA in the MLC population showing enrichment for hypoxia, angiogenesis, glycolysis, NFκB, and other signaling pathways in this population. Normalized enrichment scores larger or smaller than 1 indicate an enrichment or depletion of the gene set in the MLC population, respectively. b Volcano plot showing differentially expressed genes between neuroepithelial- and mesenchymal-like tumor cells, where genes belonging to glycolysis, NFκB signaling, TGF-β signaling, and hedgehog gene sets are indicated (Fisher’s method combined p value, adjusted for multiple hypothesis testing using Benjamini-Hochberg procedure). c The single-nucleus gene expression data were used to infer cell population abundances in a cohort of 42 pediatric posterior fossa ependymal tumors profiled with bulk RNA-seq by CBTN. Tumors are arranged from left to right by decreasing inferred abundance of MLCs. From top to bottom, the molecular subgroup, age of diagnosis, inferred abundance of distinct cell populations, GSEA scores of various representative signaling pathways, and expression of representative genes are shown. On the right side, the Spearman’s correlation coefficient of each of these features with the inferred abundance of MLCs and its level of significance are indicated (two-sided test of association; *FDR 0.05, **FDR 0.01, ***FDR 0.001). Numeric q values are provided in the Source Data file. IPCs intermediate progenitor tumor cells, MLCs mesenchymal-like tumor cells, NPCs neural progenitor tumor cells, NECs neuroepithelial-like tumor cells.
Fig. 3
Fig. 3. Single-nucleus ATAC-seq of primary and metastatic ependymal tumors uncovers transcription factors and enhancers associated with the differentiation and EMT of posterior fossa ependymoma.
a Single-nucleus ATAC-seq data of 14,461 cells from six primary and metastatic posterior fossa ependymal tumors. The UMAP representation of the data is colored and annotated by the 11 cell populations identified. b Stacked bar chart showing the proportion of each cell type in each of the six tumors. The UMAP representation is labeled according to the origin (primary/metastasis) of each cell (c), and the presence/absence of chromosomal aberrations as inferred from the single-nucleus ATAC-seq data (d). e Transcription factor (TF) binding motif accessibility score for TFs with differentially accessible binding motifs (Wilcoxon rank-sum test; FDR < 0.01) in at least one of the tumor cell populations and z-score fold-change Δz1. f The UMAP representation is colored by the TF binding motif accessibility score of five representative TFs that are significantly associated with individual tumor cell populations and are discussed in the main text. The JASPER database ID for the corresponding motif is indicated in parenthesis. g Venn diagrams showing the overlap between differentially accessible (DA) enhancers and enhancers associated with differentially expressed genes (DEGs) in tumor-derived cell populations. The number of enhancers in each class and the level of significance for the association are indicated (two-sided Fisher’s exact test; **p value 0.01). Numeric p values for MLCs and ependymal cells are 0.0016 and 0.0075, respectively. MLCs mesenchymal-like tumor cells, NPCs neural progenitor tumor cells, OPCs oligodendrocyte progenitor cells.
Fig. 4
Fig. 4. The transition of posterior fossa ependymoma tumor cells into a mesenchymal-like state involves the inhibition of neuroepithelial transcription factors and the activation of the NFκB and AP-1 complexes.
a Differentially expressed transcription factors in the neuroepithelial- or mesenchymal-like tumor cell populations that have differentially accessible binding motifs across the EMT (FDR < 0.1). The heatmap shows the transcription factor binding motif score in the neuroepithelial (zNECs) and mesenchymal-like (zMLCs) cell tumor cell populations according to the single-nucleus ATAC-seq data, and the Spearman’s correlation coefficient between the inferred abundance of MLCs and the expression level of the transcription factor in the CBTN (rCBTN) and Heidelberg (rHeidelberg) bulk RNA-seq cohorts. Transcription factors that are part of the NFκB and AP-1 complexes are indicated in orange and blue, respectively. b Whole-mount RNA in situ hybridization of sagittal sections of E13.5 mouse embryos, showing the expression of neuroepithelial transcription factors in the neuroepithelum of the brainstem and isthmic organizer (Image credit: Allen Institute). c Normalized chromatin accessibility profile at the LDOC1 locus for neuroepithelial-like and MLC populations, showing the inaccessibility of the promoter in MLCs. d Inferred regulatory network between some members of the MAF/BACH, NFκB, and AP-1 complexes. Arrows from one transcription factor into another indicate the presence of at least one differentially accessible binding motif of the first transcription factor in the gene locus of the second transcription factor (Fisher’s exact test, FDR 0.05). This analysis indicates ATF3 integrates signals from the AP-1, ERK, MAF/BACH, and NFκB signaling pathways. e Normalized chromatin accessibility at the ATF3 gene locus for neuroepithelial- and mesenchymal-like tumor cells, where the binding sites of EGR1, RELA, MAPK, and ATF3 are indicated. Transcription factor binding sites are differentially accessible between the neurepithelial- and mesenchymal-like cell populations. (Two-sided Fisher’s exact test; *FDR 0.05, **FDR 0.01, ***FDR 0.001). Numeric q values are provided in the Source Data file. f The part of the UMAP representation corresponding to the MLC population is colored by the expression level of several genes with significantly heterogeneous expression within that cluster (Laplacian score, FDR < 0.01) based on a spectral graph method. g The part of the single-nucleus ATAC-seq and RNA-seq UMAPs that corresponds to the MLC population is colored by the transcription factor binding motif accessibility score and the gene expression level of RELA, ATF3, EGR1, and MYC transcription factors. In the figure, a substantial amount of heterogeneity is observed within the MLC population, and the relative patterns of expression and motif accessibility are consistent between the single-nucleus RNA-seq and ATAC-seq representations. MLCs mesenchymal-like tumor cells, NECs neuroepithelial-like tumor cells, TFBMs transcription factor binding motifs.
Fig. 5
Fig. 5. Pro-inflammatory cytokines induce the expression of mesenchymal-like genes and diverse cellular phenotypes in a patient-derived PFA cell model.
a Experimental design. The PFA primary cell line EPD-210FHTC was cultured in the presence or absence of TGF-β1 and/or TNF-α for 5 days. The experiment was performed in three biological replicates. b Image of the EPD-210FHTC cells after the 5-day culture, for each of the treatments. TGF-β1 is required for the cells to acquire a mesenchymal phenotype, whereas treatment with TNF-α potentiates the formation of 3D colonies. c Average change in the gene expression level of MLC-specific markers with respect to the no-treatment control after 5 days of treatment. Gene expression levels were profiled by RT-qPCR. Both TGF-β1 and TNF-α induce the upregulation of MLC markers, but the relative expression levels of FN1 and CHI3L1 strongly depend on the particular treatment. Error bars indicate 90% confidence intervals. d Cell migration assay. An example of the same gap at day 0 and day 5 is shown for each condition. Treatment with TGF-β1 leads to a substantial increase in the invasive potential of the cells. e Average fraction of the area invaded by the cells after 5 days in the cell migration assay across four biological replicates (two-sided t-test; *p value 0.05, **p value 0.01). Error bars indicate 90% confidence intervals. f Cell proliferation assay by EdU incorporation. The average proportion of EdU+ cells after 2 days of treatment is shown for each of the experimental conditions. The cell proportions in each condition were compared to the cell proportion in the no-treatment control across three biological replicates using a two-sided t-test. Treatment with TGF-β1 and/or TNF-α leads to a small reduction in cell proliferation (**p value 0.01, ***p value 0.001). Error bars indicate 90% confidence intervals. Source data and numeric p values are provided in the Source Data file.

References

    1. Bouffet E, Foreman N. Chemotherapy for intracranial ependymomas. Childs Nerv. Syst. 1999;15:563–570. doi: 10.1007/s003810050544. - DOI - PubMed
    1. Merchant TE, et al. Conformal radiotherapy after surgery for paediatric ependymoma: a prospective study. Lancet Oncol. 2009;10:258–266. doi: 10.1016/S1470-2045(08)70342-5. - DOI - PMC - PubMed
    1. Bouffet E, Perilongo G, Canete A, Massimino M. Intracranial ependymomas in children: a critical review of prognostic factors and a plea for cooperation. Med. Pediatr. Oncol. 1998;30:319–329. doi: 10.1002/(SICI)1096-911X(199806)30:6<319::AID-MPO1>3.0.CO;2-H. - DOI - PubMed
    1. Duffner PK, et al. Prognostic factors in infants and very young children with intracranial ependymomas. Pediatr. Neurosurg. 1998;28:215–222. doi: 10.1159/000028654. - DOI - PubMed
    1. Pajtler KW, et al. Molecular classification of ependymal tumors across all CNS compartments, histopathological grades, and age groups. Cancer Cell. 2015;27:728–743. doi: 10.1016/j.ccell.2015.04.002. - DOI - PMC - PubMed

Publication types

MeSH terms

Supplementary concepts