. 2022 Jul 8;13(1):3944.
doi: 10.1038/s41467-022-31492-0.

dia-PASEF data analysis using FragPipe and DIA-NN for deep proteomics of low sample amounts

Affiliations

dia-PASEF data analysis using FragPipe and DIA-NN for deep proteomics of low sample amounts

Vadim Demichev et al. Nat Commun. .

Abstract

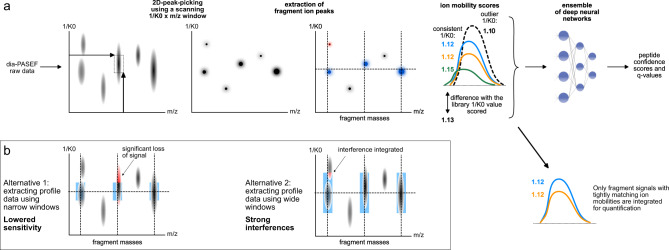
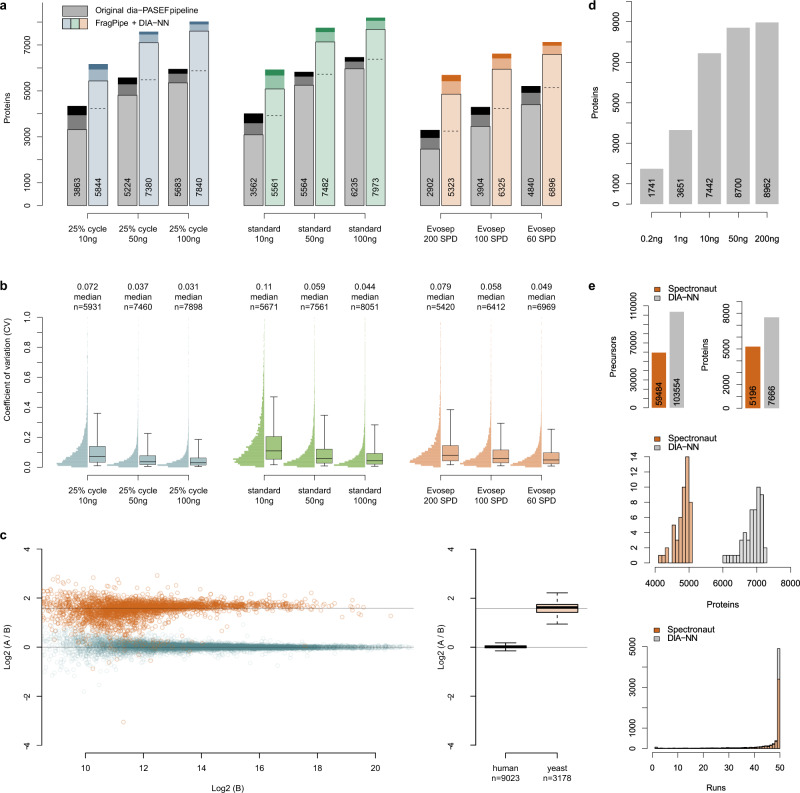
The dia-PASEF technology uses ion mobility separation to reduce signal interferences and increase sensitivity in proteomic experiments. Here we present a two-dimensional peak-picking algorithm and generation of optimized spectral libraries, as well as take advantage of neural network-based processing of dia-PASEF data. Our computational platform boosts proteomic depth by up to 83% compared to previous work, and is specifically beneficial for fast proteomic experiments and those with low sample amounts. It quantifies over 5300 proteins in single injections recorded at 200 samples per day throughput using Evosep One chromatography system on a timsTOF Pro mass spectrometer and almost 9000 proteins in single injections recorded with a 93-min nanoflow gradient on timsTOF Pro 2, from 200 ng of HeLa peptides. A user-friendly implementation is provided through the incorporation of the algorithms in the DIA-NN software and by the FragPipe workflow for spectral library generation.


Conflict of interest statement

J.D. and S.K.-S. are employees of Bruker Daltonics. The remaining authors declare no competing interests.

Figures

Fig. 1
Fig. 1. A concept for processing of proteomic trapped ion mobility data.
a Our dia-PASEF data processing workflow starts with 2D-peak-picking using a narrow scanning window. Chromatogram extraction is then performed, wherein for each precursor or fragment ion, only peaks within certain m/z and ion mobility thresholds from the expected values are used. Expected values are indicated here with dotted lines, peaks discarded due to m/z thresholding are indicated in gray, and a peak discarded due to only ion mobility thresholding is in red. Observed inverse ion mobility values (1/K0) are compared between different fragment ions (extracted chromatographic elution profiles and apex 1/K0 values of which are indicated with different colors) as well as to the reference library 1/K0 value (here: 1.13), to score putative peptide-spectrum matches. Fragments with outlier ion mobility values (here: black—signal from another peptide, green—signal mildly affected by interference) are assigned lower scores. The resulting data are analyzed by an ensemble of deep neural networks, used to distinguish true and false signals. Signals with deviating ion mobility values are also filtered out to increase quantification accuracy. b In contrast to the 2D-peak-picking introduced herein, direct extraction of chromatograms from the profile data could potentially be used. In this case, if extracting profile data with narrow windows (here: in blue), for example, the same size as used by the 2D-peak-picking algorithm, a significant proportion of ion signal can be lost (example highlighted in red) due to an imperfect match between theoretical and empirical m/z or 1/K0 values. If extracting with wide windows, more interfering signals would be integrated (example highlighted in red), increasing the complexity of the data and hampering correct identification and accurate quantification of peptides.
Fig. 2
Fig. 2. Protein detection and quantification performance.
a Number of quantified proteins for different injection amounts and instrument settings. Numbers of proteins detected in 1, 2, or all 3 injection replicates for each dataset (nanoflow 25% duty cycle scheme and standard scheme; Evosep 200, 100, and 60 samples per day (SPD) methods) are shown with different color shades, average numbers are indicated. Numbers reported by the original dia-PASEF workflow are shown in gray. The numbers of proteins detected by both workflows are indicated with dashed horizontal lines. b Coefficients of variation (CV) distributions for the same datasets. The boxes correspond to the interquartile range, with the median indicated, and the whiskers extend to the 5–95% percentiles. c Quantification accuracy of dia-PASEF data analyzed with the new software workflow. We reanalyzed previously recorded data, generated by spiking a yeast digest into a HeLa digest (200 ng) in different proportions (A, 45 ng, and B, 15 ng) and analyzed in triplicates using a 90-min nanoLC gradient. The runs were processed using a spectral library created with FragPipe. Horizontal lines indicate the expected ratios. On the boxplot, the boxes correspond to the interquartile range, with the median indicated, and the whiskers extend by a 1.5× interquartile range. Expected ratios are indicated with gray lines. d Analysis of a dilution series acquired on timsTOF Pro 2, a second-generation dia-PASEF-capable mass spectrometer, using a 93-min 300 nL/min gradient and a pre-column (Methods). Average protein numbers for triplicate injections after filtering at 1% run-specific protein q-value are shown. e Comparison of the performance of DIA-NN (gray) and Spectronaut (orange) on the leukemia dataset. Total numbers of precursors and proteins (top), protein ID numbers distributions, and consistency of protein detection (bottom) are compared. The y-axis on the histograms represents the counts.

References

    1. Venable JD, Dong M-Q, Wohlschlegel J, Dillin A, Yates JR. Automated approach for quantitative analysis of complex peptide mixtures from tandem mass spectra. Nat. Methods. 2004;1:39–45. doi: 10.1038/nmeth705. - DOI - PubMed
    1. Gillet, L. C. et al. Targeted data extraction of the MS/MS spectra generated by data-independent acquisition: a new concept for consistent and accurate proteome analysis. Mol. Cell. Proteomics11, O111.016717 (2012). - PMC - PubMed
    1. Ludwig C, et al. Data-independent acquisition-based SWATH-MS for quantitative proteomics: a tutorial. Mol. Syst. Biol. 2018;14:e8126. doi: 10.15252/msb.20178126. - DOI - PMC - PubMed
    1. Muntel J, et al. Surpassing 10000 identified and quantified proteins in a single run by optimizing current LC-MS instrumentation and data analysis strategy. Mol. Omics. 2019;15:348–360. doi: 10.1039/C9MO00082H. - DOI - PubMed
    1. Vowinckel J, et al. Cost-effective generation of precise label-free quantitative proteomes in high-throughput by microLC and data-independent acquisition. Sci. Rep. 2018;8:4346. doi: 10.1038/s41598-018-22610-4. - DOI - PMC - PubMed

Publication types