. 2022 Jul 8;12(1):11579.
doi: 10.1038/s41598-022-15207-5.

CyberSco.Py an open-source software for event-based, conditional microscopy

Affiliations

CyberSco.Py an open-source software for event-based, conditional microscopy

Lionel Chiron et al. Sci Rep. .

Abstract

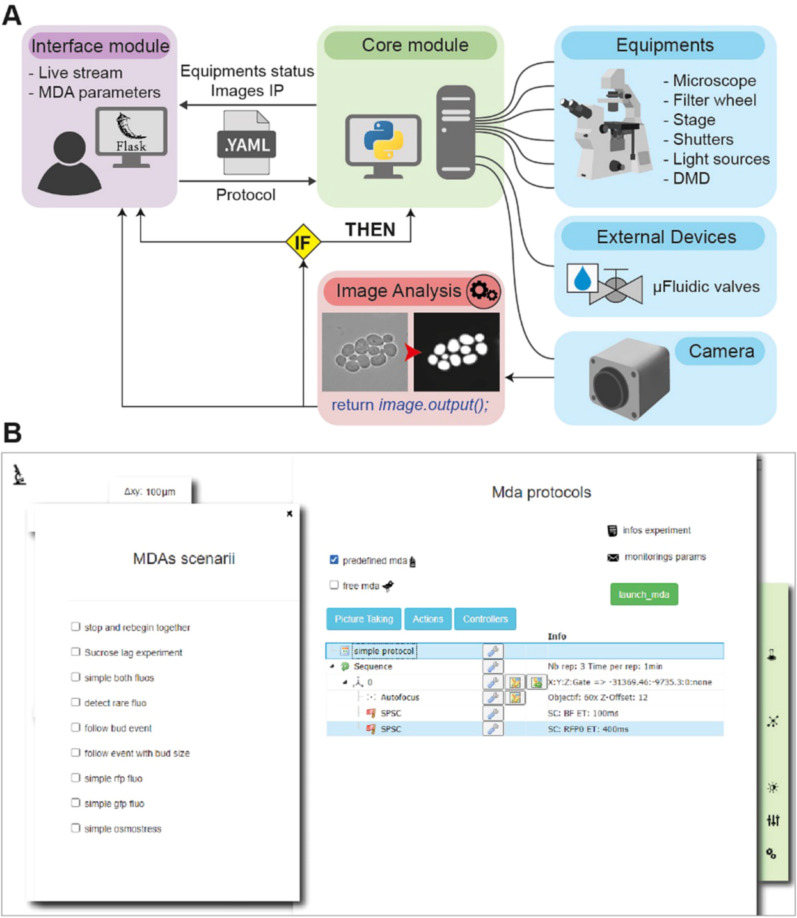
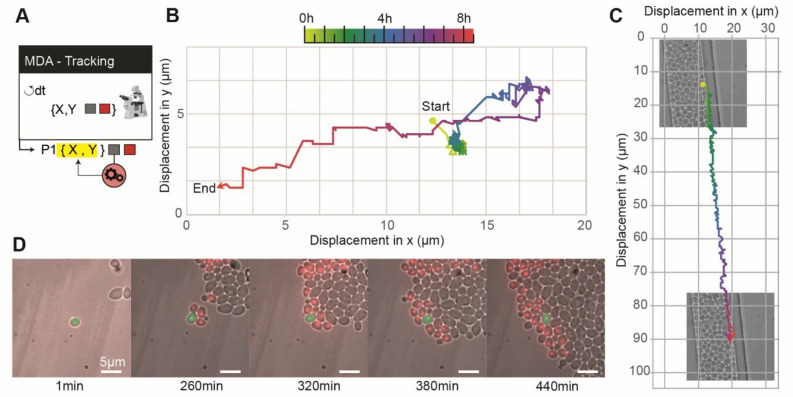
Timelapse fluorescence microscopy imaging is routinely used in quantitative cell biology. However, microscopes could become much more powerful investigation systems if they were endowed with simple unsupervised decision-making algorithms to transform them into fully responsive and automated measurement devices. Here, we report CyberSco.Py, Python software for advanced automated timelapse experiments. We provide proof-of-principle of a user-friendly framework that increases the tunability and flexibility when setting up and running fluorescence timelapse microscopy experiments. Importantly, CyberSco.Py combines real-time image analysis with automation capability, which allows users to create conditional, event-based experiments in which the imaging acquisition parameters and the status of various devices can be changed automatically based on the image analysis. We exemplify the relevance of CyberSco.Py to cell biology using several use case experiments with budding yeast. We anticipate that CyberSco.Py could be used to address the growing need for smart microscopy systems to implement more informative quantitative cell biology experiments.


Conflict of interest statement

The authors declare no competing interests.

Figures

Figure 1
Figure 1
CyberSco.Py framework. (A) Architecture. CyberSco.Py is built in Python and uses the web application library Flask to create a web user interface. Microscopy protocols are written into a YAML (human readable data serialization language) file, which can be interpreted by the Python core module of CyberSco.Py, which drives the various components of a IX81 fully automated microscope. The core module also drives a set of fluidic valves that can be used to switch the media flowing into a microfluidic device. A class in Python is associated to each device. Images obtained from the camera are analyzed in real-time by a U-NET deep learning model to segment yeast cells and/or detect specific events, depending on the pre-trained model selected by the user. The result of the analysis is used by the core module to update the current state of any devices under its control (see “Materials and methods” for more information). (B) Snapshot of the current user interface. The user interface is very simple by design and allows the user to choose between several pre-programmed event-based scenarios, for which the user must define various relevant parameters and condition switches. The simple drag and drop interface can be used to modify a given Multi-Dimensional Acquisition protocol to give more flexibility and to create more advanced protocols. The same interface can be used in “live mode” to view what is currently being imaged and check that the live image analysis is performing correctly. Once the program is launched, the computer takes control of the microscope and will adjust the image acquisition parameters based on the event-based scenario that has been selected. It is possible to code a novel scenario directly in Python and/or to manually adjust the thresholds and parameters used to detect events (e.g., number of cells, size of cells, etc.). The structure of a scenario consists of a list of instructions for the microscope (“make the autofocus”, “take a picture”, etc.) to be serially executed at each iteration, a conditional block, and an initialization block. Each scenario corresponds to a unique Python file with the same consistent structure. The user can also enter information about the projected experiment, as well as selecting modalities for monitoring the experiment remotely via email (selecting where to send the emails and at which frequency) and/or through a discussion channel (e.g., Microsoft Teams or Slack).
Figure 2
Figure 2
From simple to advanced MDA. (A) Example of a classic Multi-Dimensional Acquisition (MDA) protocol to observe yeast proliferation in a microfluidic chamber, with two imaging channels (brightfield and RFP) imaged every 6 min for several hours. The HTB2 protein of the yeast cells is tagged with a mCherry fluorescent reporter. A sketch of the program (nested loops) is shown on the left side: the imaging parameters are identical for every position and timepoint. (B) An advanced MDA, in which the user has defined several positions, but set different illumination settings in the blue channel (LED intensity: 0%, 5%, 10% and 20%). This programming was done without scripts, by just using the drag and drop interface (see Supplementary Materials). Yeast cells bearing an optogenetic gene expression system (pC120-venus) were imaged for 15 h. Each position is exposed to a different level of light stimulation, which alters the expression of a yellow fluorescent reporter both in terms of cell–cell variability, the maximum level of expression and dynamics. Thus, in one experiment, it was possible to quantitatively calibrate the pC120 optogenetic promoter using our settings without any requirement for coding (objective × 20). Fluorescence levels are averaged across the field of view and the error values are the standard deviation of pixel intensity.
Figure 3
Figure 3
Synchronization of the acquisition framerate with dynamic perturbations to capture yeast cell signaling dynamics. (A) Time course of nuclear accumulation of Hog1p in yeast cells growing as a monolayer in a microfluidic chamber subjected to an osmotic stress (1 M sorbitol). The insets show localization of Hog1-GFP before and after the osmotic stress. The acquisition framerate (orange bars) is automatically adjusted from one frame every 5 min to one frame every 25 s (12 times faster) just before the cells are stressed osmotically. The autofocus was turned off during the first 4 min of rapid Hog1 nuclear import. Recovery of the cells was then monitored at one frame every minute for 20 min, and finally the framerate was set back to its initial value (one frame every 5 min) until the next stress. The grey area represents the ± standard deviation of nuclear localization across 13 tracked cells from one microfluidic chamber. (B) The adaptive sampling rate used in (A) was repeated three times to demonstrate that cells exhibit reproducible dynamics in response to every stress. This experiment allowed the timescales of activation (fast) and deactivation (slow) of the HOG cascade to be measured in an unsupervised manner. (C) Sketch of the adaptive sampling MDA, which consists of three MDA experiments: one with a fast acquisition rate (nuclear import dynamics), one with a medium acquisition rate (nuclear export dynamics), and one with a slow acquisition rate (cell division after recovery). The switch from MDA#1 to MDA#2 is synchronized with the activation of an electrofluidic valve that delivers an osmotic stress of 30 min duration (repeated every 60 min). Nuclear localization is computed as the mean of GFP fluorescence in the nucleus normalized to the mean of GFP fluorescence in the entire cell.
Figure 4
Figure 4
Detection and tracking of a cell of interest. (A) Sketch of the “detect and track scenario”. Once a cell of interest is found in the field of view, the field of view is centered on that cell and the stage is periodically moved to maintain this cell in the center of the field of view. (B) We mixed two populations of yeast cells in a microfluidic chamber, one of which express a HTB2-mCherry fluorescent reporter (1:10 cell ratio). The algorithm scans through several positions and when it detects cells with a signal in the RFP channel, picks one such cell randomly and centers it on the field of view. This cell is then tracked using brightfield segmentation, and the stage position is corrected through a feedback loop to compensate for cell displacement. (C) The cell of interest moves because it is pushed by the growth of neighboring cells, traveling approximately 20 µm during the course of the experiment. The real-time stage compensation keeps the cell in the center of the field of view. The duration of the experiment (around 9 h) is long enough to observe the appearance of the progeny of the cell of interest. (D) Tracking a non-fluorescent yeast cell growing in a dead-end narrow microfluidic chamber, leading to global directed motion of all cells. The tracked cell remains in the field of view, even though it travels approximately 80 µm; in contrast, the field of view is only ~ 25 × 25 µm.
Figure 5
Figure 5
Conditional perturbation based on the number of cells. (A) Sketch of the protocol, showing that different positions have a different conditional statement (IF) on the number of cells to trigger the switch from glucose to sucrose independently of each other. (B) Sucrose conversion by yeast. The Suc2p invertase produced by cells is secreted extracellularly and can degrade extracellular sucrose into diffusible hexose. (C) Following a shift from glucose to sucrose, cells need some time to convert sucrose to glucose and restart division. We show here that this time depends on the initial cell density (the higher the number of cells, the shorter the lag phase). The duration of the lag phase was estimated as the time it took the population to reach 130% of its initial size after the switch from glucose to sucrose. Error bars represent ± one standard deviation over three biological replicates (two replicates for the *). (D) Temporal evolution of the number of cells for different initial densities: 100 (1), 500 (2) and 2000 (3) cells (grey arrows). (E) Population growth shifted temporally to the switch time (i.e., switch = t0), demonstrating that the lag time increases as the initial cell density decreases. (F) Cell counting is achieved by real-time segmentation, shown here as an overlay of the brightfield image with single cell masks (in blue) at the time of the valve switch.
Figure 6
Figure 6
Bud detection and high-temporal-resolution imaging of mitosis. (A) Scenario used to detect and “zoom in” on a particular event (in this case, mitosis). Several positions are monitored and when a condition is fulfilled, image acquisition is performed on only this position at an adapted sampling framerate. (B) Cell cycle progression in yeast. The mitosis event to be captured represents a small-time fraction of the cell’s life cycle (~ 10%). (C) In practice, the acquisition of brightfield images of a population of budding yeast leads to a coarse timelapse with an acquisition framerate of 3 min to search for the next mitotic event. Cell segmentation is used to identify buds (size filtering), shown here as a white overlay. When a bud has reached a given size (and has been growing for at least three frames), we consider that a mitotic event is about to occur. (D) Then, the acquisition software “zooms in” on that cell by increasing the framerate to one frame every 30 s for 20 min and RFP imaging is added to image the nucleus (HTB2-mCherry reporter). As shown in panel (D), this scenario allows the complete mitotic event and nuclear separation between the mother and daughter cells (around 10 min, as expected) to be captured at an appropriate framerate. Once this image acquisition sequence is complete, the program resumes its search at the lower framerate for another mitotic event.

References

    1. Almada P, et al. Automating multimodal microscopy with NanoJ-Fluidics. Nat. Commun. 2019;10:1–9. doi: 10.1038/s41467-019-09231-9. - DOI - PMC - PubMed
    1. Hossain Z, et al. Interactive and scalable biology cloud experimentation for scientific inquiry and education. Nat. Biotechnol. 2016;34:1293–1298. doi: 10.1038/nbt.3747. - DOI - PubMed
    1. Pinkard, H., Stuurman, N. & Waller, L. Pycro-manager: Open-source software for integrated microscopy hardware control and image processing. ArXiv200611330 Q-Bio (2020).
    1. Pinkard H, Stuurman N, Corbin K, Vale R, Krummel MF. Micro-Magellan: Open-source, sample-adaptive, acquisition software for optical microscopy. Nat. Methods. 2016;13:807–809. doi: 10.1038/nmeth.3991. - DOI - PMC - PubMed
    1. Conrad C, et al. Micropilot: Automation of fluorescence microscopy-based imaging for systems biology. Nat. Methods. 2011;8:246–249. doi: 10.1038/nmeth.1558. - DOI - PMC - PubMed

Publication types

LinkOut - more resources