. 2022 Oct;23(5):647-664.
doi: 10.1007/s10162-022-00857-z. Epub 2022 Jul 8.

Characterizing the Relationship Between Reflection and Distortion Otoacoustic Emissions in Normal-Hearing Adults

Affiliations

Characterizing the Relationship Between Reflection and Distortion Otoacoustic Emissions in Normal-Hearing Adults

Carolina Abdala et al. J Assoc Res Otolaryngol. 2022 Oct.

Abstract

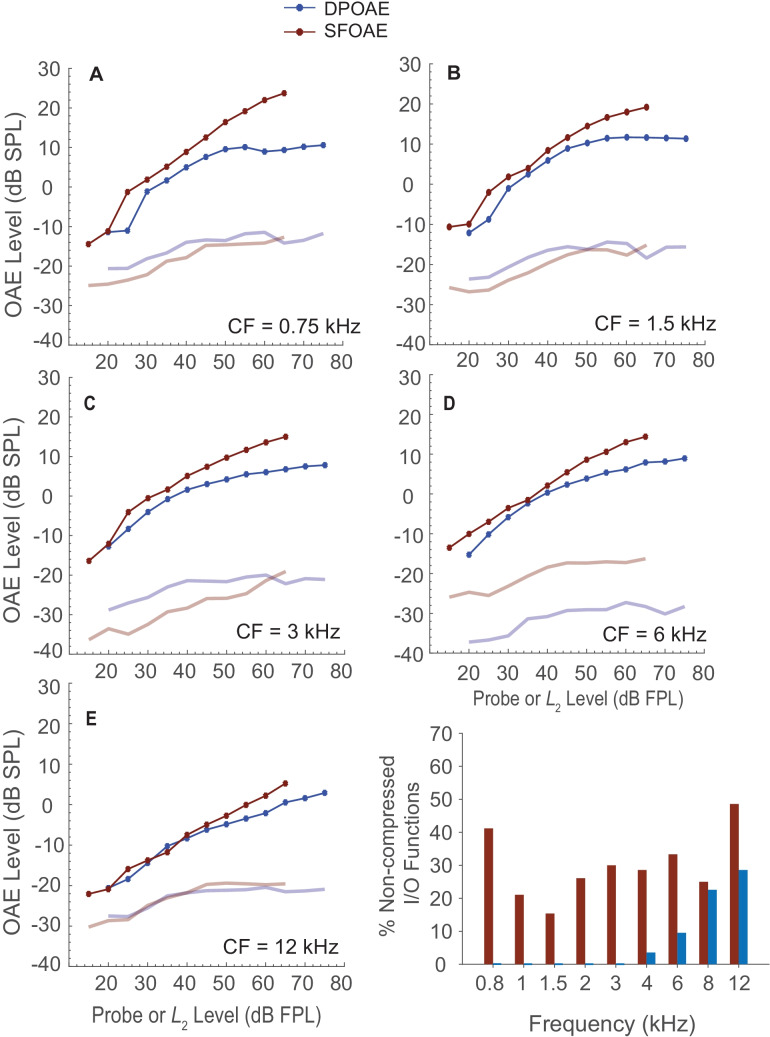
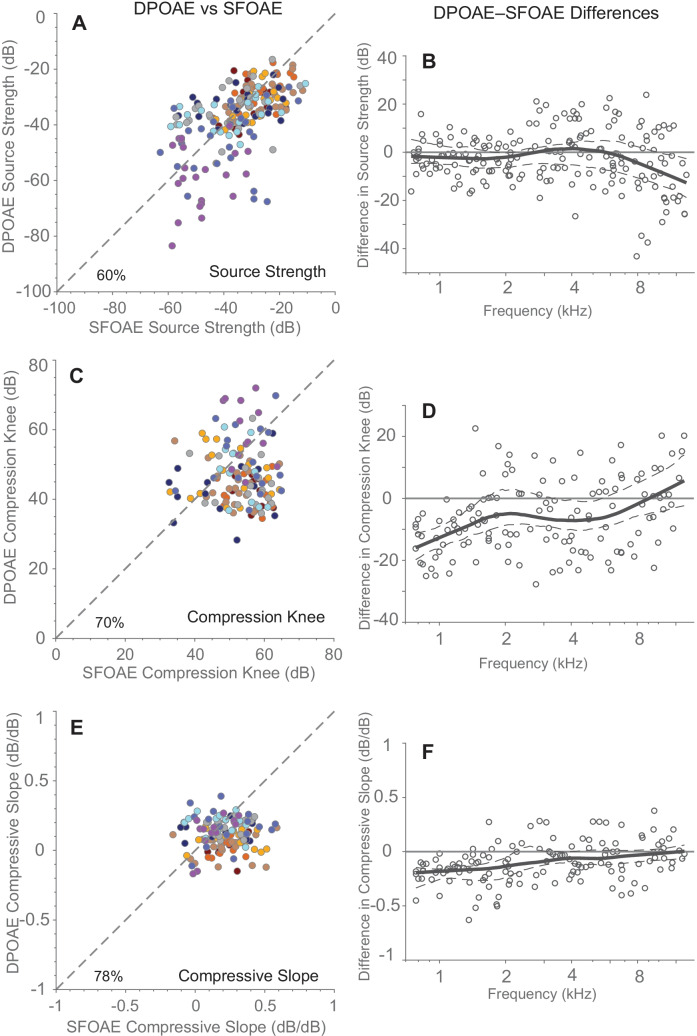
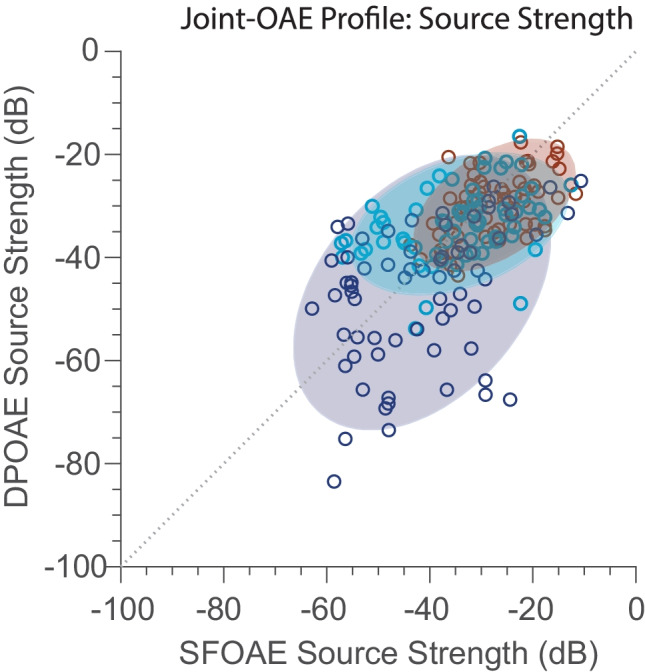
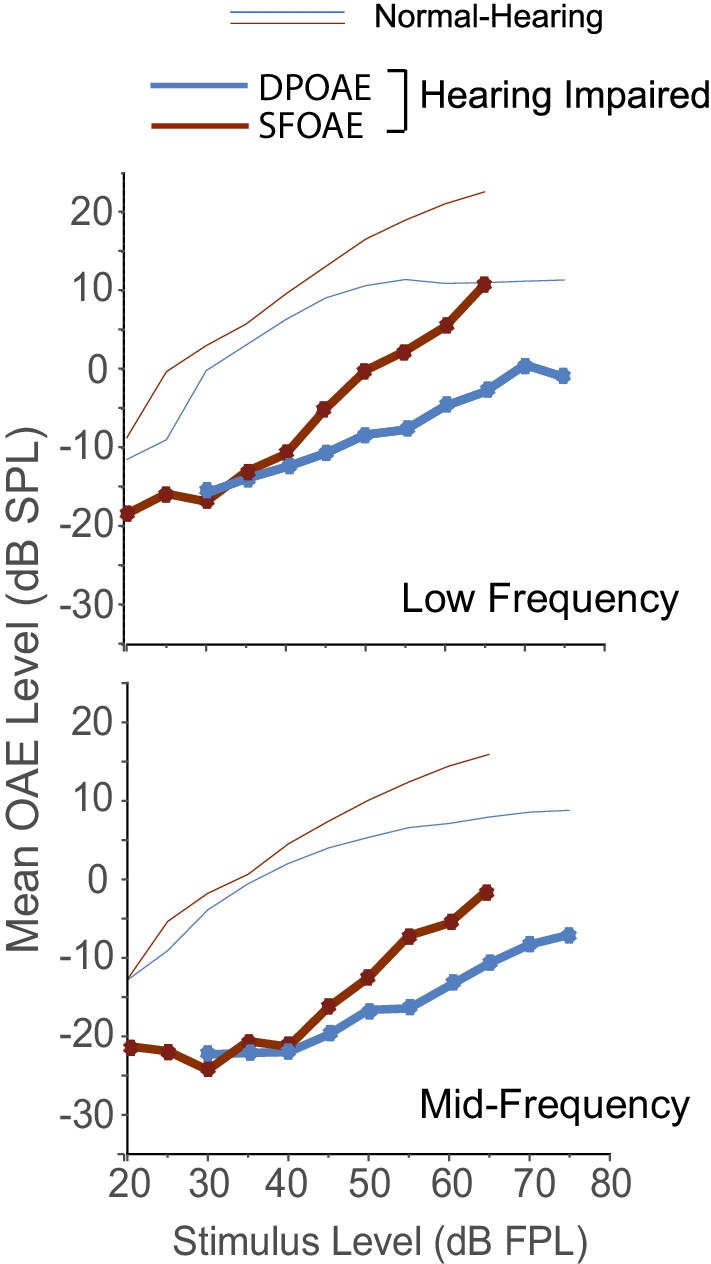
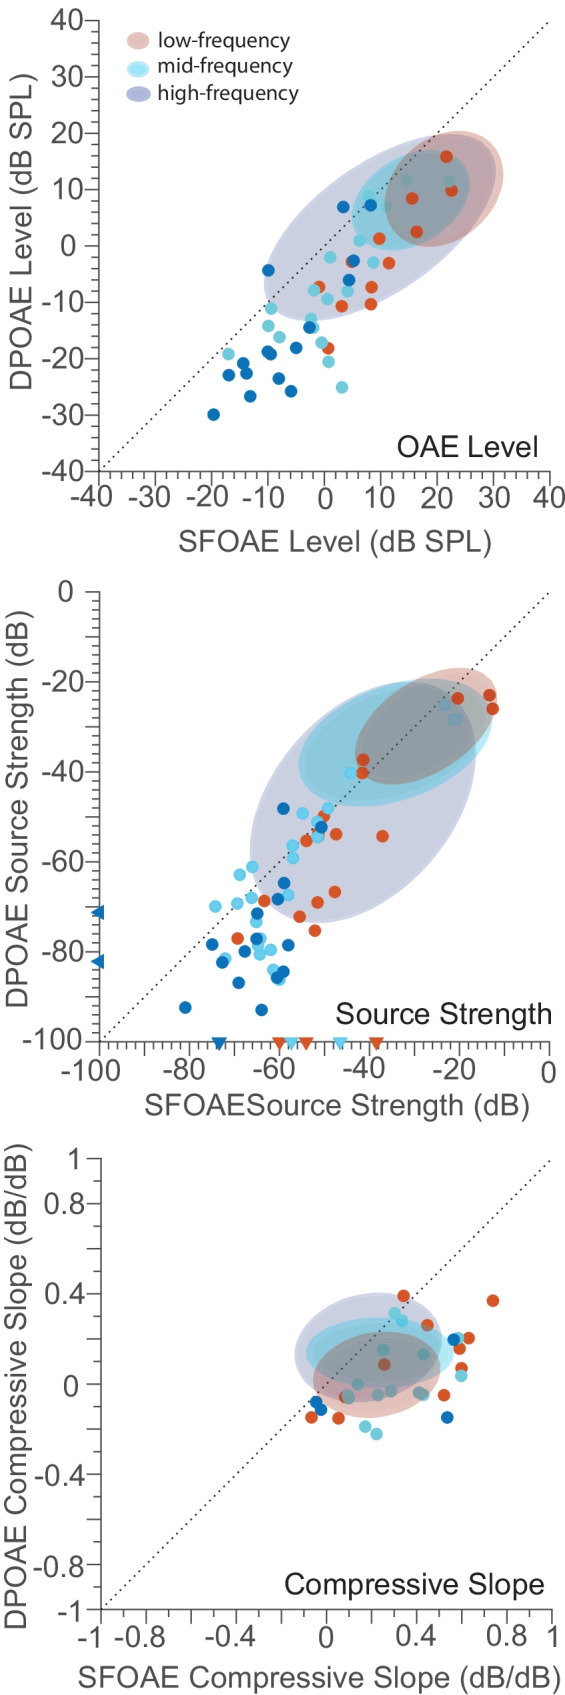
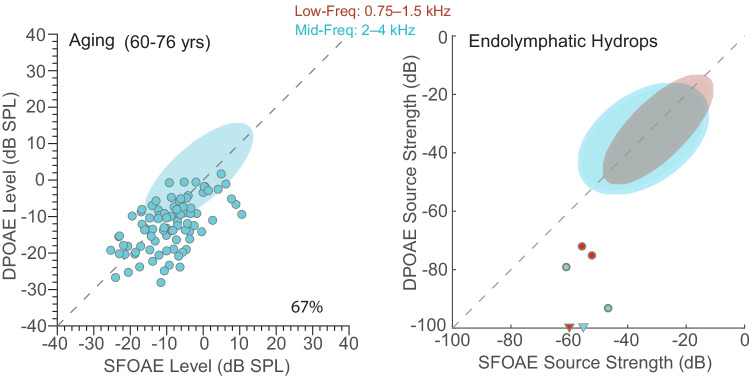
Otoacoustic emissions (OAEs) arise from one (or a combination) of two basic generation mechanisms in the cochlea: nonlinear distortion and linear reflection. As a result of having distinct generation processes, these two classes of emissions may provide non-redundant information about hair-cell integrity and show distinct sensitivities to cochlear pathology. Here, we characterize the relationship between reflection and distortion emissions in normal hearers across a broad frequency and stimulus-level space using novel analysis techniques. Furthermore, we illustrate the promise of this approach in a small group of individuals with mild-moderate hearing loss. A "joint-OAE profile" was created by measuring interleaved swept-tone stimulus-frequency OAEs (SFOAEs) and 2f1-f2 distortion-product OAEs (DPOAEs) in the same ears using well-considered parameters. OAE spectra and input/output functions were calculated across five octaves. Using our specific recording protocol and analysis scheme, SFOAEs in normal hearers had higher levels than did DPOAEs, with the most pronounced differences occurring at the highest stimulus levels. Also, SFOAE compression occurred at higher stimulus levels (than did DPOAE compression) and its growth in the compressed region was steeper. The diagnostic implications of these findings and the influence of the measurement protocol on both OAEs (and on their relationship) are discussed.

Keywords: DPOAE; SFOAE; differential diagnosis; distortion; otoacoustic emissions; reflection.


Conflict of interest statement

The authors declare no competing interests.

Figures

Fig. 1
Fig. 1
Audiogram displays the elevated behavioral thresholds (i.e., those falling between 20 and 50 dB HL) from 12 ears with slight-to-moderate hearing loss. Circle = right ears; X = left. OAE data were collected at only these frequencies in hearing-impaired subjects. Twenty individuals with normal-hearing (15 dB HL or better) were included to generate a normative joint-OAE profile, against which to assess hearing loss (normal thresholds are not shown here)
Fig. 2
Fig. 2
Each input/output (I/O) function was characterized using a least squares fit to Eq. (1), shown here by the blue (DPOAE) and red (SFOAE) lines for one ear at 2 kHz. From these fits, the maximum slope, source strength, and compression knee were derived. The location of maximum slope is identified with dotted lines. The compressive slope was derived using a linear fit (magenta/cyan dashed lines) to all points beyond the compression knee. See “Methods” for fit and parameter details
Fig. 3
Fig. 3
The top panels show a typical series of OAE spectra measured across five octaves and 10–12 stimulus levels from one normal-hearing individual. SFOAEs are shown on the left panel and DPOAEs on the right. The noise floor is shown for only one stimulus level (Lp and L2) in each panel: 40 and 65 dB FPL for the SFOAE and DPOAE, respectively. The bottom panels show loess trend lines fit to all the data from the normal-hearing group. In all illustrations, line color denotes stimulus level. It is evident in both individual and group data that SFOAEs grow relatively linearly as evidenced by the consistent separation between lines, whereas DPOAEs show compression at low-moderate stimulus levels
Fig. 4
Fig. 4
Group mean band-averaged OAE levels for normal hearers at three stimulus levels. The symbols represent the center frequency of half-octave frequency bands into which single data points were binned. The shaded region shows ± 1 standard deviation. Results indicate that SFOAEs are higher in level than DPOAEs, most noticeably at the higher levels. The rightmost panel displays OAE data plotted for a stimulus level referenced to the mean compression knee for each OAE. The corresponding pressure levels for this plot are L2 = 40 dB FPL for the DPOAE and Lp = 50 dB FPL for the SFOAE
Fig. 5
Fig. 5
The joint-OAE profile for level at 40 dB FPL (upper panel) and 65 dB FPL (lower panel) from the normal-hearing group. The center-frequency (of each half-octave frequency band) is denoted by color. Each data point represents paired DPOAE-SFOAE measurements of OAE level from the same ear. The percentage values indicate the distribution of points falling below the diagonal, which indicates that the SFOAE is higher in level than the DPOAE
Fig. 6
Fig. 6
Group mean SFOAE (red) and DPOAE (blue) input/output functions from normal hearers at five octave frequencies: 0.75–12 kHz. The lighter-colored lines depict noise floors. In general, the SFOAE is higher in level than the DPOAE and the divergence becomes more prominent with increasing stimulus levels. The difference between the two OAEs diminishes with increasing frequency (i.e., from A to E). The histogram in the bottom right panel follows the same red/blue color convention and shows that the prevalence of linear, non-compressed functions is greater for SFOAEs compared to DPOAEs. Note that we chose not to plot error bars on these I/O functions because it would obscure trends between the two OAEs. However, we have provided indices of OAE level variability in Fig. 4, and all metrics derived from these I/O functions are shown in Figs. 7 and 8; hence, variability in these mean data can be visualized from other plots
Fig. 7
Fig. 7
Left column: Joint-OAE profiles for A source strength, C compression knee, and E compressive slope from normal hearers. Color denotes frequency (see color key in Fig. 5). The percentage given in the lower right corner of each panel indicates the proportion of points below the diagonal. Right column: These panels (B, D, F) display the corresponding difference values (DPOAE−SFOAE) for each parameter shown in the left column. Each open circle is derived from a pair of DPOAE − SFOAE measurements in the same ear, and the red line is a loess fit (± 95% CI). Overall, SFOAE source strength appears to be roughly equivalent between emissions; compression in the SFOAE occurs at higher stimulus levels (than the DPOAE), and the compressive slope is steeper for SFOAEs beyond the compression knee, most notably at low and mid-frequencies
Fig. 8
Fig. 8
Normative ellipses for the source strength parameter derived from I/O functions. Frequency is represented by three categories: low frequency (red) OAE data at 0.75, 1, and 1.5 kHz; mid-frequency (cyan) at 2, 3, and 4 kHz; and high frequency (blue) at 6, 8, and 12 kHz. The ellipses were generated by computing the region that best encompassed 95% of the normal-hearing data. The individual data points from which the ellipses were created (open circles) are also shown
Fig. 9
Fig. 9
Group mean DPOAE (blue) and SFOAE (red) I/O functions for hearing-impaired (HI) individuals in three frequency categories. The numbers contributing to each mean function ranged from 14 to 21 observations at each stimulus level. The normal-hearing functions for 1 and 3 kHz are shown with thin lines, as a reminder of the relationship between DPOAEs and SFOAEs in the healthy ear. We chose not to plot error bars on these I/O functions because it would obscure trends in the relationship between the two emissions, which is the focus of this figure. Similar to normal hearers, impaired ears showed the most pronounced DPOAE-SFOAE differences at the highest stimulus levels. Also, there I/O functions appear linearized by hearing impairment
Fig. 10
Fig. 10
The normal shaded ellipses for OAE level (at 65 dB FPL), source strength, and compressive slope with individual ear data from the hearing-impaired (HI) subjects superimposed (filled circles). Color denotes the frequency category (low-frequency data are red, mid-frequency data are cyan, and high-frequency data are blue). Most DPOAE-SFOAE paired data points from impaired ears fall outside of the corresponding normal ellipse. However, the relational pattern of DPOAE–SFOAE results may be of greater interest as it could characterize the etiology of a given hearing loss. See Fig. 12 for examples
Fig. 11
Fig. 11
Phase-gradient delay trends from the normal-hearing group for reflection and distortion OAEs vs frequency (fp or f2). Line color denotes stimulus level (see legend). These correspond to the OAE level trends shown in the bottom panels of Fig. 3. The reflection emissions show substantial delays, consistent with a place-fixed mechanism of generation. Also evident is the substantial level-dependence of reflection-OAE delays in contrast to distortion-emission delays, which do not show this feature
Fig. 12
Fig. 12
The left panel shows newly plotted OAE level data measured from 32 elderly adults originally tested as part of Abdala et al. (2018b). The elliptical analysis for mid-frequency OAEs indicates that DPOAEs are more reduced (than SFOAEs) in aging ears as noted by the majority of data points below the diagonal and ellipse. This pattern appears to characterize aging ears. The right panel shows results from one individual diagnosed with endolymphatic hydrops. In this ear, low- and mid-frequency DPOAEs were either not measurable or drastically reduced in source strength and OAE level (not shown), while SFOAEs were near normal at these same frequencies. These patterns of OAE disruption may eventually form the basis for characterizing hearing loss and distinguishing among etiology

References

    1. Abdala C, Luo P, Shera CA. Optimizing swept-tone protocols for recording distortion-product otoacoustic emissions in adults and newborns. J Acoust Soc Am. 2015;138:3785–3799. - PMC - PubMed
    1. Abdala C, Kalluri R. Towards a joint reflection-distortion otoacoustic emission profile: Results in normal and impaired ears. J Acoust Soc Am. 2017;142:812–824. - PMC - PubMed
    1. Abdala C, Guardia YC, Shera CA. Swept-tone stimulus-frequency otoacoustic emissions: Normative data and methodological considerations. J Acoust Soc Am. 2018;143:181–192. - PMC - PubMed
    1. Abdala C, Ortmann AJ, Shera CA. Reflection- and distortion-source otoacoustic emissions: Evidence for increased irregularity in the human cochlea during aging. J Assoc Res Otolaryngol. 2018;19:493–510. - PMC - PubMed
    1. Abdala C, Ortmann AJ, Guardia YC. Weakened Cochlear nonlinearity during human aging and perceptual correlates. Ear Hear. 2021;42:832–845. - PMC - PubMed

Publication types