

Testing Two Somatic Cell Count Cutoff Values for Bovine Subclinical Mastitis Detection Based on Milk Microbiota and Peripheral Blood Leukocyte Transcriptome Profile
- PMID: 35804592
- PMCID: PMC9264859
- DOI: 10.3390/ani12131694
Testing Two Somatic Cell Count Cutoff Values for Bovine Subclinical Mastitis Detection Based on Milk Microbiota and Peripheral Blood Leukocyte Transcriptome Profile
Abstract
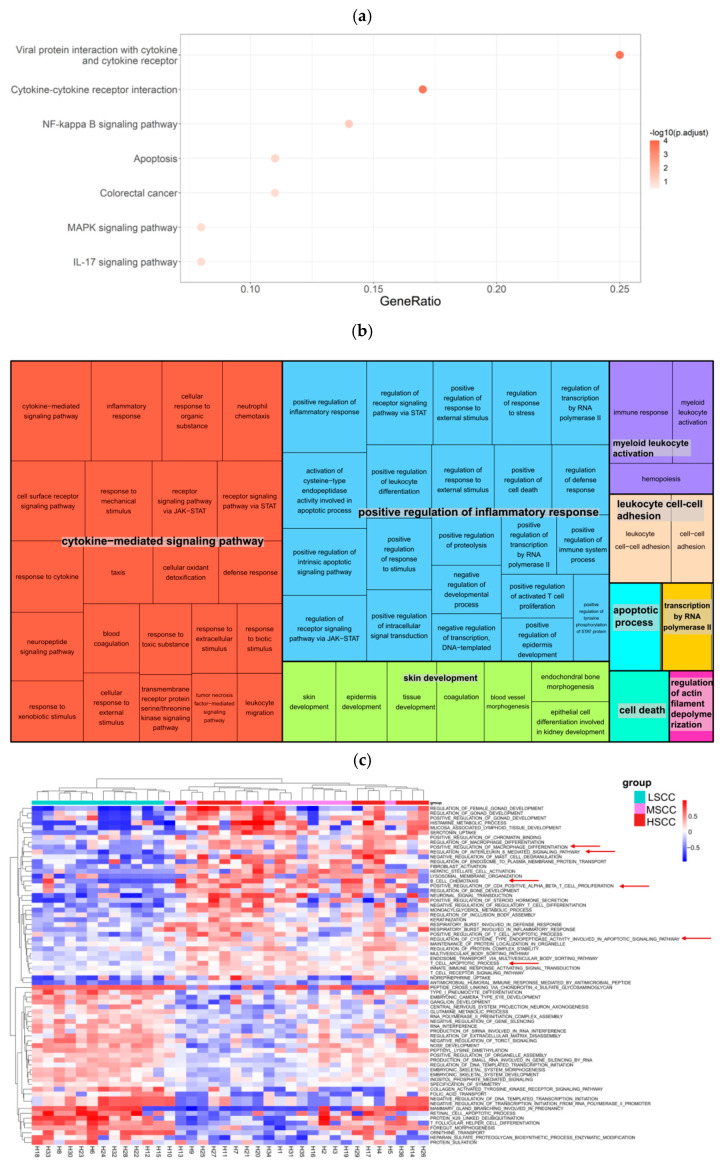
Somatic cell count (SCC) is an important indicator of the health state of bovine udders. However, the exact cut-off value used for differentiating the cows with healthy quarters from the cows with subclinical mastitis remains controversial. Here, we collected composite milk (milk from four udder quarters) and peripheral blood samples from individual cows in two different dairy farms and used 16S rRNA gene sequencing combined with RNA-seq to explore the differences in the milk microbial composition and transcriptome of cows with three different SCC levels (LSCC: <100,000 cells/mL, MSCC: 100,000−200,000 cells/mL, HSCC: >200,000 cells/mL). Results showed that the milk microbial profiles and gene expression profiles of samples derived from cows in the MSCC group were indeed relatively easily discriminated from those from cows in the LSCC group. Discriminative analysis also uncovered some differentially abundant microbiota at the genus level, such as Bifidobacterium and Lachnospiraceae_AC2044_group, which were more abundant in milk samples from cows with SCC below 100,000 cells/mL. As for the transcriptome profiling, 79 differentially expressed genes (DEGs) were found to have the same direction of regulation in two sites, and functional analyses also showed that biological processes involved in inflammatory responses were more active in MSCC and HSCC cows. Overall, these results showed a similarity between the milk microbiota and gene expression profiles of MSCC and HSCC cows, which presented further evidence that 100,000 cells/ml is a more optimal cut-off value than 200,000 cells/mL for intramammary infection detection at the cow level.
Keywords: dairy cows; milk microbiota; somatic cell count; subclinical mastitis; transcriptome.
Conflict of interest statement
The authors declare no conflict of interest.
Figures


Similar articles
-
Investigation of dairy cow performance in different udder health groups defined based on a combination of somatic cell count and differential somatic cell count.Prev Vet Med. 2020 Oct;183:105123. doi: 10.1016/j.prevetmed.2020.105123. Epub 2020 Aug 27. Prev Vet Med. 2020. PMID: 32928552
-
Evaluation of the new differential somatic cell count parameter as a rapid and inexpensive supplementary tool for udder health management through regular milk recording.Prev Vet Med. 2020 Aug;181:105079. doi: 10.1016/j.prevetmed.2020.105079. Epub 2020 Jul 3. Prev Vet Med. 2020. PMID: 32653488
-
Evaluation of test-day milk somatic cell count information to predict intramammary infection with major pathogens in dairy cattle at drying off.J Dairy Sci. 2019 May;102(5):4309-4321. doi: 10.3168/jds.2018-15642. Epub 2019 Mar 1. J Dairy Sci. 2019. PMID: 30827542
-
Evaluation of quality changes in udder quarter milk from cows with low-to-moderate somatic cell counts.Animal. 2010 Apr;4(4):617-26. doi: 10.1017/S1751731109991467. Animal. 2010. PMID: 22444049
-
Effects of bovine casein hydrolysate as a dry cow therapy on prevention and cure of bovine intramammary infection, milk production, and somatic cell count in the subsequent lactation.J Dairy Sci. 2022 May;105(5):4354-4369. doi: 10.3168/jds.2021-20703. Epub 2022 Mar 10. J Dairy Sci. 2022. PMID: 35282906
Cited by
-
Exosomes in Mastitis-Research Status, Opportunities, and Challenges.Animals (Basel). 2022 Oct 21;12(20):2881. doi: 10.3390/ani12202881. Animals (Basel). 2022. PMID: 36290266 Free PMC article. Review.
-
Metabolomic Analysis of Multiple Biological Specimens (Feces, Serum, and Urine) by 1H-NMR Spectroscopy from Dairy Cows with Clinical Mastitis.Animals (Basel). 2023 Feb 19;13(4):741. doi: 10.3390/ani13040741. Animals (Basel). 2023. PMID: 36830529 Free PMC article.
-
Antimicrobial therapy approaches in the mastitis control driven by one health insights.Braz J Vet Med. 2024 Jul 17;46:e002624. doi: 10.29374/2527-2179.bjvm002624. eCollection 2024. Braz J Vet Med. 2024. PMID: 39104804 Free PMC article.
References
-
- Wang Y., Nan X., Zhao Y., Wang H., Wang M., Jiang L., Zhang F., Xue F., Hua D., Li K., et al. Coupling 16S rDNA Sequencing and Untargeted Mass Spectrometry for Milk Microbial Composition and Metabolites from Dairy Cows with Clinical and Subclinical Mastitis. J. Agric. Food Chem. 2020;68:8496–8508. doi: 10.1021/acs.jafc.0c03738. - DOI - PubMed
-
- Ma P., Yu Y., Zhang Y., Zhang Q., Wang Y., Sun D., Zhang Y. The Distribution of SCC and Its Correlation with Milk Production Traits in Chinese Holsteins. Acta Vet. Zootech. Sin. 2010;12:1529–1535.
Grants and funding
LinkOut - more resources
Full Text Sources
Research Materials
