. 2022 Jul 5;11(13):1984.
doi: 10.3390/foods11131984.

Consumption of Grapes Modulates Gene Expression, Reduces Non-Alcoholic Fatty Liver Disease, and Extends Longevity in Female C57BL/6J Mice Provided with a High-Fat Western-Pattern Diet

Affiliations

Consumption of Grapes Modulates Gene Expression, Reduces Non-Alcoholic Fatty Liver Disease, and Extends Longevity in Female C57BL/6J Mice Provided with a High-Fat Western-Pattern Diet

Asim Dave et al. Foods. .

Abstract

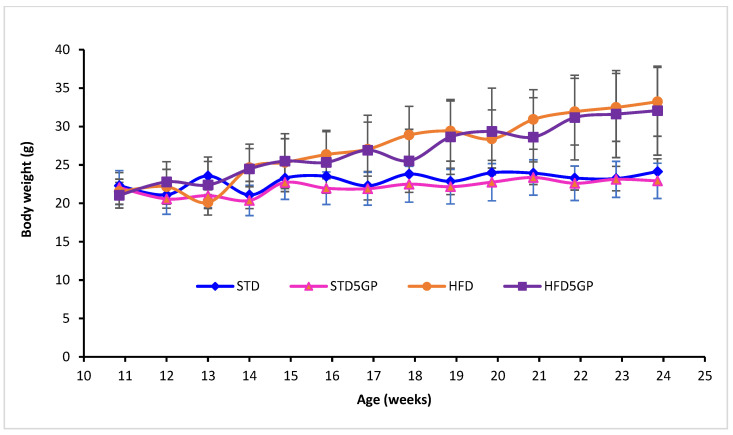
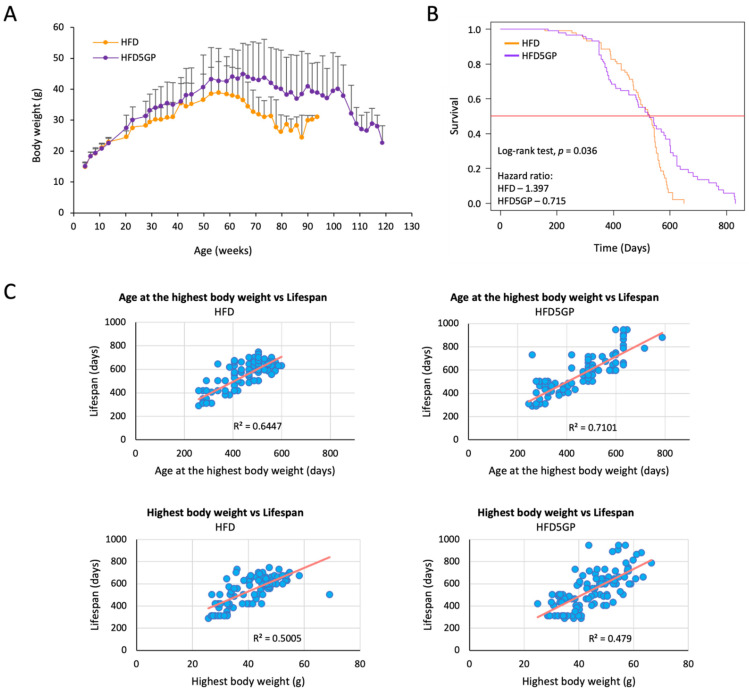
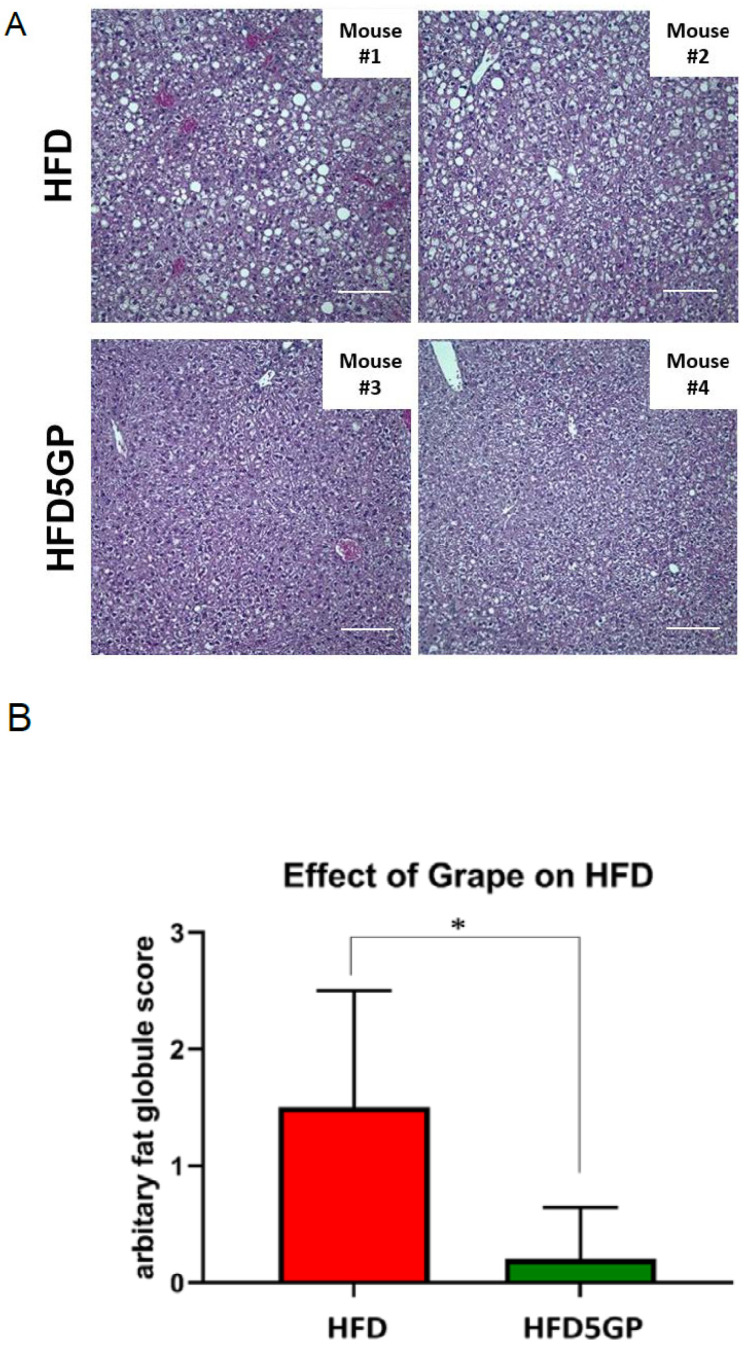
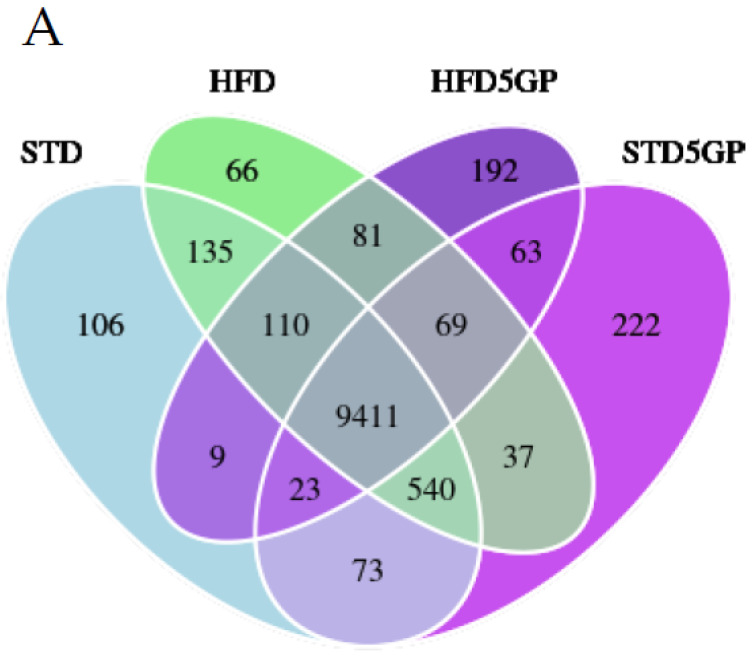
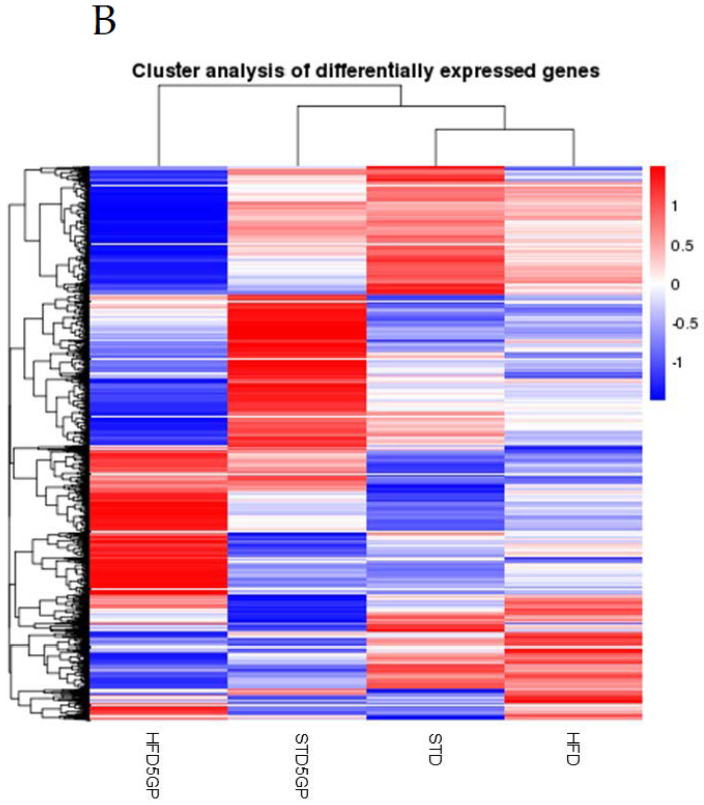
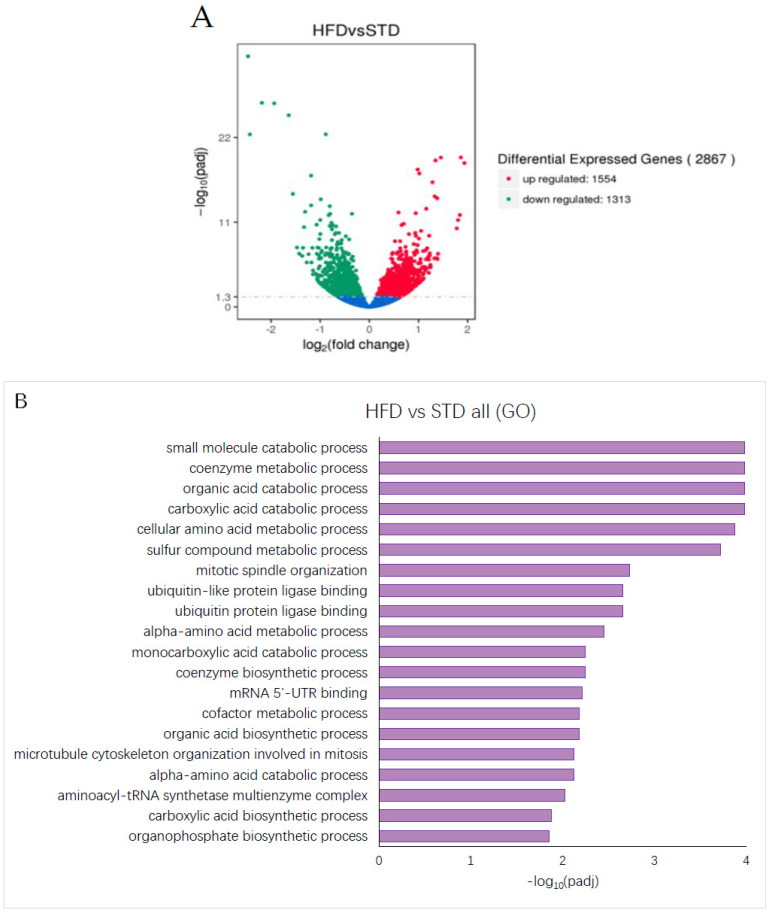
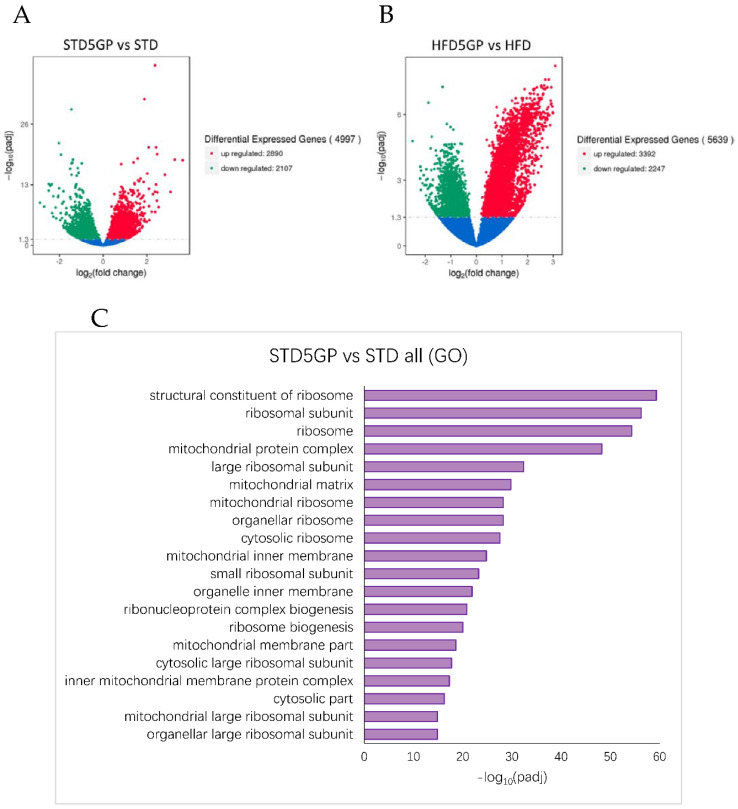
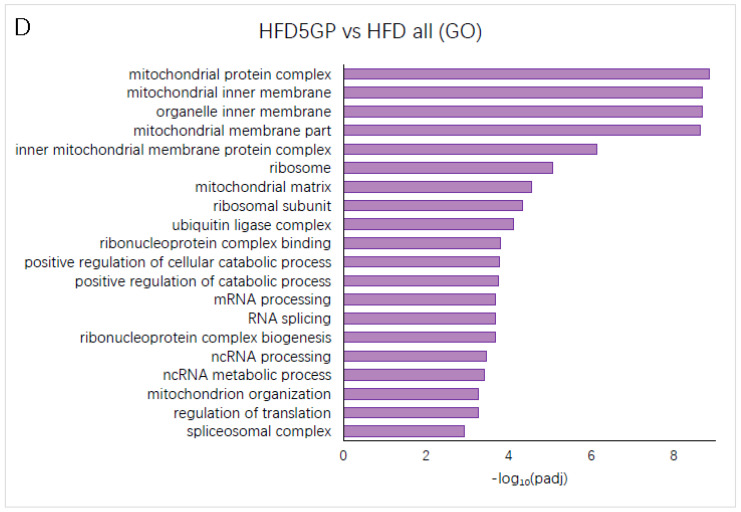
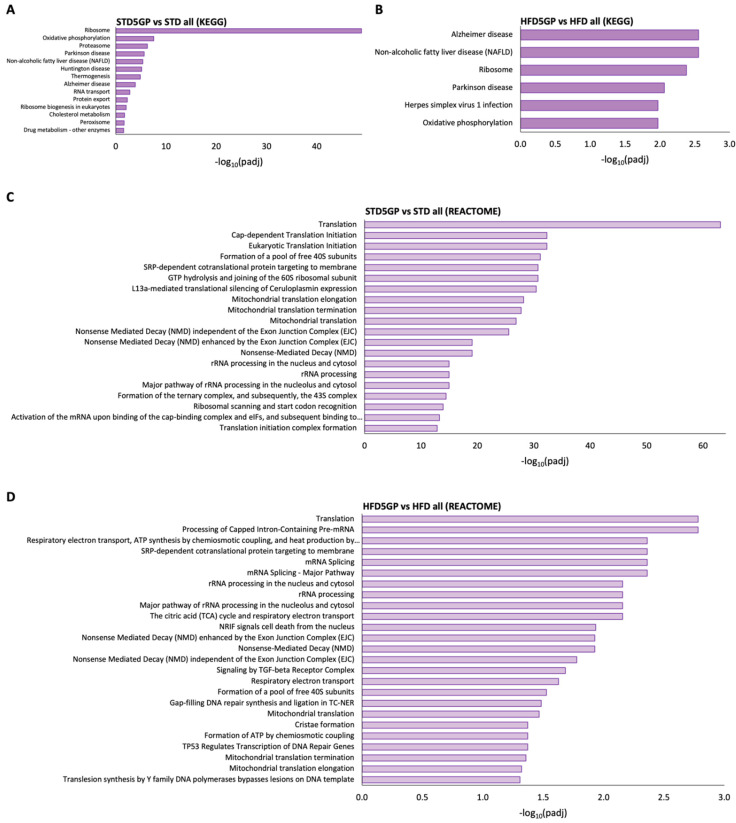
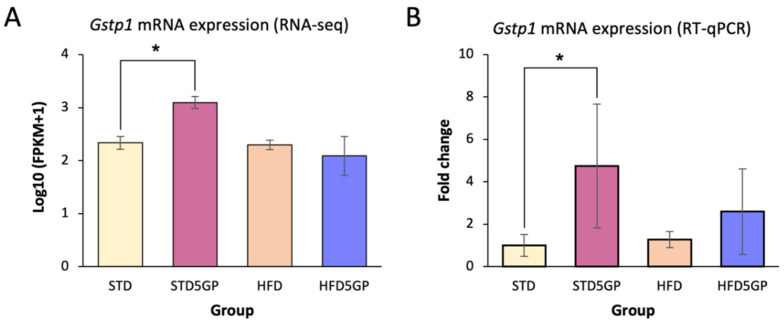
A key objective of this study was to explore the potential of dietary grape consumption to modulate adverse effects caused by a high-fat (western-pattern) diet. Female C57BL/6J mice were purchased at six-weeks-of-age and placed on a standard (semi-synthetic) diet (STD). At 11 weeks-of-age, the mice were continued on the STD or placed on the STD supplemented with 5% standardized grape powder (STD5GP), a high-fat diet (HFD), or an HFD supplemented with 5% standardized grape powder (HFD5GP). After being provided with the respective diets for 13 additional weeks, the mice were euthanized, and liver was collected for biomarker analysis, determination of genetic expression (RNA-Seq), and histopathological examination. All four dietary groups demonstrated unique genetic expression patterns. Using pathway analysis tools (GO, KEGG and Reactome), relative to the STD group, differentially expressed genes of the STD5GP group were significantly enriched in RNA, mitochondria, and protein translation related pathways, as well as drug metabolism, glutathione, detoxification, and oxidative stress associated pathways. The expression of Gstp1 was confirmed to be upregulated by about five-fold (RT-qPCR), and, based on RNA-Seq data, the expression of additional genes associated with the reduction of oxidative stress and detoxification (Gpx4 and 8, Gss, Gpx7, Sod1) were enhanced by dietary grape supplementation. Cluster analysis of genetic expression patterns revealed the greatest divergence between the HFD5GP and HFD groups. In the HFD5GP group, relative to the HFD group, 14 genes responsible for the metabolism, transportation, hydrolysis, and sequestration of fatty acids were upregulated. Conversely, genes responsible for lipid content and cholesterol synthesis (Plin4, Acaa1b, Slc27a1) were downregulated. The two top classifications emerging as enriched in the HFD5GP group vs. the HFD group (KEGG pathway analysis) were Alzheimer's disease and nonalcoholic fatty liver disease (NAFLD), both of which have been reported in the literature to bear a causal relationship. In the current study, nonalcoholic steatohepatitis was indicated by histological observations that revealed archetype markers of fatty liver induced by the HFD. The adverse response was diminished by grape intervention. In addition to these studies, life-long survival was assessed with C57BL/6J mice. C57BL/6J mice were received at four-weeks-of-age and placed on the STD. At 14-weeks-of-age, the mice were divided into two groups (100 per group) and provided with the HFD or the HFD5GP. Relative to the HFD group, the survival time of the HFD5GP group was enhanced (log-rank test, p = 0.036). The respective hazard ratios were 0.715 (HFD5GP) and 1.397 (HFD). Greater body weight positively correlated with longevity; the highest body weight of the HFD5GP group was attained later in life than the HFD group (p = 0.141). These results suggest the potential of dietary grapes to modulate hepatic gene expression, prevent oxidative damage, induce fatty acid metabolism, ameliorate NAFLD, and increase longevity when co-administered with a high-fat diet.

Keywords: C57BL/6J mice; RNA sequencing; grapes; high-fat diet; metabolic diseases; nutrigenomics.


Conflict of interest statement

The authors declare no conflict of interest.

Figures

Figure 1
Figure 1
Dietary fat content but not grape supplementation affects mouse body weight. Body weights of mice from the beginning of the diet schedule (11 weeks-of-age) for the next 13 weeks (24-weeks-of-age) on standard diet (STD) (n = 10), standard diet supplemented with 5% grape powder (STD5GP) (n = 10), high-fat diet (HFD) (n = 10), or high-fat diet supplemented with 5% grape powder (HFD5GP) (n = 10). Prior to 11 weeks of age, all mice were provided with the STD. Mouse body weights were monitored weekly. The body weight of the high-fat diet groups was greater than that of the standard diet groups [two-way ANOVA: F (1, 36) = 53.91, p < 0.001]. Within the respective groups, grape supplementation did not significantly alter body weight. Additional details are presented in the text and in Table 2.
Figure 2
Figure 2
Grape powder supplementation of a high-fat diet affects temporal weight loss and increases the lifespan of C57BL/6J mice. (A) At 14-weeks-of-age, mice were divided into two groups (n = 100 per group), and diet was changed from the STD to either the high-fat diet (HFD) or the high-fat diet supplemented with 5% grape powder (HFD5GP) for the remainder of their lifespan. Body weight was recorded every two weeks and recorded as mean ± SD. (B) Kaplan-Meier plot showing the survival of mice provided with the HFD or the HFD5GP. Survival was enhanced with the group provided with the HFD5GP (p = 0.036; log-rank test). The hazard ratio of the HFD group was 1.397 (95% CI, 0.99–1.96), whereas the hazard ratio for the HFD5GP group was 0.715 (95% CI, 0.507–1.009). (C) Correlation plots showing the age at highest body weight versus lifespan for individual mice (upper panels), and the highest body weight attained by individual mice versus lifespan (lower panels).
Figure 3
Figure 3
Effect of grape on hepatic steatosis. (A) Representative H&E images of liver from mice provided with the HFD (1 and 2) and the HFD5GP (3 and 4) (image magnification, 20X). (B) Quantitation of the number of fat vacuoles in the liver from mice provided with the HFD (n = 5) or the HFD5GP (n = 5). Values are presented as mean ± SD. * p = 0.032 and U = 2.0 (Mann-Whitney U test).
Figure 4
Figure 4
Dietary fat content and grape powder supplementation alters gene expression profiles in mouse liver. (A) Venn diagram of genes expressed by the four groups of mice illustrating genes co-expressed (overlapping regions) and uniquely expressed (non-overlapping regions) among all groups. The default threshold of FPKM value is set to 1 for the selection of the genes for each group. (B) Heat map and cluster analysis showing unique gene expression profiles for each of the four groups of mice. Clustering analysis was carried out by Novogene Corporation Inc. (Sacramento, CA, USA) using a build-in R package, heatmap. Focus is placed on data (Union_for_cluster.xls) which is the union gene set of all comparison groups. Relative gene expression levels and −log2(ratios) are used for clustering. The clustering calculates the distance between each gene and evaluates the relative gene distance through iteration. Finally, genes are divided into several subgroups according to gene distance. H-cluster, K-means and SOM are the main clustering methods used, implemented in R language (Version 1.0.12).
Figure 4
Figure 4
Dietary fat content and grape powder supplementation alters gene expression profiles in mouse liver. (A) Venn diagram of genes expressed by the four groups of mice illustrating genes co-expressed (overlapping regions) and uniquely expressed (non-overlapping regions) among all groups. The default threshold of FPKM value is set to 1 for the selection of the genes for each group. (B) Heat map and cluster analysis showing unique gene expression profiles for each of the four groups of mice. Clustering analysis was carried out by Novogene Corporation Inc. (Sacramento, CA, USA) using a build-in R package, heatmap. Focus is placed on data (Union_for_cluster.xls) which is the union gene set of all comparison groups. Relative gene expression levels and −log2(ratios) are used for clustering. The clustering calculates the distance between each gene and evaluates the relative gene distance through iteration. Finally, genes are divided into several subgroups according to gene distance. H-cluster, K-means and SOM are the main clustering methods used, implemented in R language (Version 1.0.12).
Figure 5
Figure 5
HFD alters gene expression in mouse liver. (A) Volcano plot showing upregulated (red dots) (1554), downregulated (green dots) (1313) and unaltered (blue dots) genes in liver derived from the HFD group compared to the STD group. The threshold for differentially expressed genes was set as |log2(fold-change)| > 1 and −log10(Padj) > 1.3 (Padj < 0.05). The plot illustrates the upregulation of 1554 genes and the downregulation of 1313 genes. (B) GO analysis showing significantly enriched terms for the gene set differentially expressed in the liver of mice from the HFD group compared to the STD group. −log10(Padj) > 1.3 (Padj < 0.05) was considered as significant enrichment.
Figure 6
Figure 6
Grape powder supplementation of diet alters gene expression in mouse liver irrespective of fat content. (A) Volcano plot showing upregulated (red dots) (2890), downregulated (green dots) (2107), and unaltered (blue dots) genes in the liver of mice provided with STD5GP compared with that of mice provided with STD. The threshold for differentially expressed genes was set as |log2(fold-change)| > 1 and −log10(Padj) > 1.3 (Padj < 0.05). (B) Volcano plot showing upregulated (red dots) (3392), downregulated (green dots) (2247), and unaltered (blue dots) genes in the liver of mice provided with HFD5GP compared with that of mice provided with HFD. The threshold for differentially expressed genes was set as |log2(fold-change)| > 1 and −log10(Padj) > 1.3 (Padj < 0.05). (C) GO enrichment analysis showing the top significantly enriched terms for the gene set differentially expressed in the liver of the STD5GPgroup compared with the STD group. (D) GO enrichment analysis showing the top significantly enriched terms for the gene set differentially expressed in the liver of the HFD5GP group compared to the HFD group. −log10(Padj) > 1.3 (Padj < 0.05) was considered as statistically significant enrichment.
Figure 6
Figure 6
Grape powder supplementation of diet alters gene expression in mouse liver irrespective of fat content. (A) Volcano plot showing upregulated (red dots) (2890), downregulated (green dots) (2107), and unaltered (blue dots) genes in the liver of mice provided with STD5GP compared with that of mice provided with STD. The threshold for differentially expressed genes was set as |log2(fold-change)| > 1 and −log10(Padj) > 1.3 (Padj < 0.05). (B) Volcano plot showing upregulated (red dots) (3392), downregulated (green dots) (2247), and unaltered (blue dots) genes in the liver of mice provided with HFD5GP compared with that of mice provided with HFD. The threshold for differentially expressed genes was set as |log2(fold-change)| > 1 and −log10(Padj) > 1.3 (Padj < 0.05). (C) GO enrichment analysis showing the top significantly enriched terms for the gene set differentially expressed in the liver of the STD5GPgroup compared with the STD group. (D) GO enrichment analysis showing the top significantly enriched terms for the gene set differentially expressed in the liver of the HFD5GP group compared to the HFD group. −log10(Padj) > 1.3 (Padj < 0.05) was considered as statistically significant enrichment.
Figure 7
Figure 7
Dietary grape powder supplementation shows enrichment for terms/pathways associated with translation in mouse liver irrespective of fat content. (A) KEGG pathway analysis showing the top significantly enriched terms for the gene set differentially expressed in the liver of the STD5GP group compared with the STD group. (B) KEGG pathway analysis showing the top significantly enriched terms for the gene set differentially expressed in the liver of the HFD5GP group compared with the HFD group. −log10(Padj) > 1.3 (Padj < 0.05) was considered as statistically significant enrichment. (C) Reactome pathway analysis showing the top significantly enriched terms for the gene set differentially expressed in the liver of the STD5GP group compared with the STD group. (D) Reactome pathway analysis showing the top significantly enriched terms for the gene set differentially expressed in the liver of the HFD5GP group compared with the HFD group. −log10(Padj) > 1.3 (Padj < 0.05) was considered as statistically significant enrichment.
Figure 8
Figure 8
Grape powder supplementation enhances Gstp1 expression in mouse liver. (A) Log10 (FPKM+1) values for Gstp1 expression derived from RNA-Seq data obtained with the liver of mice from the STD5GP group compared with liver of mice from the STD group (* p < 0.0001; two-sample two-tailed t-test). Comparison of the HFD and HFD5GP groups revealed no difference (Padj = 0.782). (B) RT-qPCR analysis of Gstp1 expression in the liver of mice from the STD5GP group compared to liver of mice from the STD group (* p = 0.001; two-sample two-tailed t-test), and from liver of mice from the HFD5GP group compared with liver of mice from the HFD group (p = 0.068). Data are presented as mean ± SD of three independent experiments.

References

    1. Doll R. An epidemiological perspective of the biology of cancer. Cancer Res. 1978;38:3573–3583. - PubMed
    1. Phillips R.L. Role of life-style and dietary habits in risk of cancer among Seventh-day Adventists. Cancer Res. 1975;35:3513–3522. - PubMed
    1. Buell P., Dunn J.E. Cancer mortality among Japanese issei and nisei of California. Cancer. 1965;18:656–664. doi: 10.1002/1097-0142(196505)18:5<656::AID-CNCR2820180515>3.0.CO;2-3. - DOI - PubMed
    1. Cordain L., Eaton S.B., Sebastian A., Mann N., Lindeberg S., Watkins B.A., O’Keefe J.H., Brand-Miller J. Origins and evolution of the Western diet: Health implications for the 21st century. Am. J. Clin. Nutr. 2005;81:341–354. doi: 10.1093/ajcn.81.2.341. - DOI - PubMed
    1. Healthy Diet. [(accessed on 14 January 2022)]. Available online: https://www.who.int/news-room/fact-sheets/detail/healthy-diet.