. 2022 Jun 26;14(13):3130.
doi: 10.3390/cancers14133130.

CD73 Promotes Chronic Lymphocytic Leukemia

Affiliations

CD73 Promotes Chronic Lymphocytic Leukemia

David Allard et al. Cancers (Basel). .

Abstract

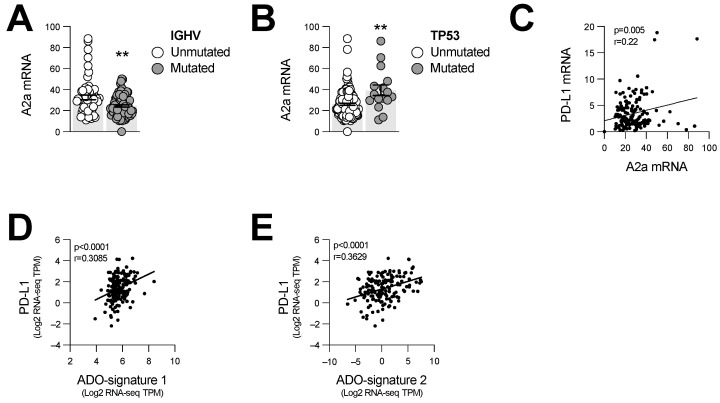
The ecto-nucleotidase CD73 is an important immune checkpoint in tumor immunity that cooperates with CD39 to hydrolyze pro-inflammatory extracellular ATP into immunosuppressive adenosine. While the role of CD73 in immune evasion of solid cancers is well established, its role in leukemia remains unclear. To investigate the role of CD73 in the pathogenesis of chronic lymphocytic leukemia (CLL), Eµ-TCL1 transgenic mice that spontaneously develop CLL were crossed with CD73-/- mice. Disease progression in peripheral blood and spleen, and CLL markers were evaluated by flow cytometry and survival was compared to CD73-proficient Eµ-TCL1 transgenic mice. We observed that CD73 deficiency significantly delayed CLL progression and prolonged survival in Eµ-TCL1 transgenic mice, and was associated with increased accumulation of IFN-γ+ T cells and effector-memory CD8+ T cells. Neutralizing IFN-γ abrogated the survival advantage of CD73-deficient Eµ-TCL1 mice. Intriguingly, the beneficial effects of CD73 deletion were restricted to male mice. In females, CD73 deficiency was uniquely associated with the upregulation of CD39 in normal lymphocytes and sustained high PD-L1 expression on CLL cells. In vitro studies revealed that adenosine signaling via the A2a receptor enhanced PD-L1 expression on Eµ-TCL1-derived CLL cells, and a genomic analysis of human CLL samples found that PD-L1 correlated with adenosine signaling. Our study, thus, identified CD73 as a pro-leukemic immune checkpoint in CLL and uncovered a previously unknown sex bias for the CD73-adenosine pathway.

Keywords: CD73; PD-L1; adenosine; chronic lymphocytic leukemia.


Conflict of interest statement

J.S. is permanent member of the Scientific Advisory Board and owns stocks of Surface Oncology, is member of the Scientific Advisory Board of Tarus Therapeutics, and is a member of the Scientific Advisory Board of Domain Therapeutics.

Figures

Figure 1
Figure 1
CD73 and CD39 expression is upregulated on non-leukemic lymphocytes upon disease progression. Peripheral blood (PB) cells of male (M) and female (F) Eµ-TCL1tg/wt mice were analyzed at 6 months old (Mo) (early stage; n = 25 F and n = 11 M) and 12 months old (Mo) (advanced stage; n = 11 F and n = 6 M). CD73 (left) and CD39 (right) expression levels are shown by mean fluorescence intensity (MFI). (A) CD73 and CD39 expression is compared between 6-month-old PB leukemic cells (CLL; CD5int B220int) and normal B cells (nB; CD5neg B220hi) from Eµ-TCL1tg/wt and hWT mice (n = 5 M and 5 F). (BD) CD73 and CD39 expression is compared between 6- and 12-month-old (B) normal B cells (nB), (C) pan-T cells (T; CD5hi B220neg) and (D) leukemic cells (CLL) of Eµ-TCL1tg/wt mice. Means +/− SEM are shown (* p < 0.05; *** p < 0.001 by 2-way ANOVA). MO, months; PB, peripheral blood; n.s., non-significant; nB, normal B cells; MFI, mean fluorescence intensity; hWT, healthy WT.
Figure 2
Figure 2
CD73 deficiency prolongs survival of Eµ-TCL1tg/wt males. Eµ-TCL1tg/wt mice were crossed with CD73−/− mice and leukemia progression was analyzed. (A,B) Survival of Eµ-TCL1tg/wt (n = 14 M and 25 F) and Eµ-TCL1tg/wt CD73/− (n = 13 M and 22 F) (a) males and (B) females. (C,D) Fold change in peripheral disease burden of Eµ-TCL1tg/wt and Eµ-TCL1tg/wt CD73−/− (C) 8- and 12-month-old male and (D) female mice relative to 8-month-old hWT mice (hWT n = 5 M and 5 F; hCD73−/− n = 7 M and 5 F). Means +/− SEM are shown (** p < 0.01 by log-rank (A,B) or Mann–Whitney test (C,D)). F, female; M, male; tg, transgenic; n.s., non-significant.
Figure 3
Figure 3
CD73-deficient Eµ-TCL1tg/wt males fail to upregulate CD39 in peripheral blood. Peripheral blood (PB) cells of male (M) and female (F) CD73−/− Eµ-TCL1tg/wt mice were analyzed at 6 (n = 22 F and n = 13 M) and 12 (n = 12 F and n = 10 M) months old (MO). CD39 expression levels shown by mean fluorescence intensity (MFI) on PB (A,B), normal B cells (nB; CD5neg B220hi) and (C,D) pan-T cells (T; CD5hi B220neg). Six-month-old hCD73−/− littermates were used as control. Means +/− SEM are shown (* p < 0.05; ** p < 0.01; *** p < 0.001 by 2-way ANOVA). FMO, fluorescence minus one; MO, months; hCD73−/−, healthy CD73−/−; nB, normal B cells; n.s., non-significant; MFI, mean fluorescence intensity.
Figure 4
Figure 4
CD73−/− Eµ-TCL1tg/wt males display increased antitumor immunity and IFN-γ neutralization abrogates their prolonged survival. Spleens’ compositions of 8-month-old Eµ-TCL1tg/wt and Eµ-TCL1tg/wt CD73−/− male and female mice were analyzed by cytometry. (A) Analysis of PD-L1 expression levels (MFI) on splenic leukemic CLL (CD5int B220int) cells (M Eµ-TCL1tg/wt n = 7; M Eµ-TCL1tg/wt CD73−/− n = 8; F Eµ-TCL1tg/wt n = 8; F Eµ-TCL1tg/wt CD73−/− n = 7). (B) Fold change in ratios of effector memory (Em: CD44+CD62L-) to central memory (Cm: CD44+CD62L+) CD4+ and CD8+ (gated on live CD3+) splenic T cells in Eµ-TCL1tg/wt and Eµ-TCL1tg/wt CD73−/− (M Eµ-TCL1tg/wt n = 17; M Eµ-TCL1tg/wt CD73−/− n = 19; F Eµ-TCL1tg/wt n = 9; F Eµ-TCL1tg/wt CD73−/− n = 10). (C) Percentages of IFN-γ+ CD4 and CD8 T cells from 8-month-old Eµ-TCL1tg/wt and Eµ-TCL1tg/wt CD73−/− splenocytes stimulated in vitro with PMA/ionomycin for 6h (M Eµ-TCL1tg/wt n = 5; M Eµ-TCL1tg/wt CD73−/− n = 5; F Eµ-TCL1tg/wt n = 6; F Eµ-TCL1tg/wt CD73−/− n = 6). (D) Fold change in peripheral disease burden relative to untreated Eµ-TCL1tg/wt mice and (E) survival of Eµ-TCL1tg/wt CD73−/− males treated with anti-interferon gamma (αIFNγ; n = 10) compared to historical untreated (unt.) Eµ-TCL1tg/wt (n = 14) and Eµ-TCL1tg/wt CD73−/− (n = 13) controls. Means +/− SEM are shown (* p < 0.05; ** p < 0.01 by Mann–Whitney test (AC), 1-way ANOVA (D) and log-rank (E)). FMO, fluorescence minus one; F, female; M, male; Em, effector memory; Cm, central memory; unt., untreated; n.s., non-significant.
Figure 5
Figure 5
A2a adenosine receptor signaling potentiates PD-L1 expression on Eµ-TCL1-derived CLL cells. CD73-deficient Eµ-TCL1-derived CLL cells were cultured in vitro for 48 h and PD-L1 expression was analyzed by FACS. (A,B) MFI and fold change in PD-L1 expression of CD73-deficient Eµ-TCL1 (male)-derived CLL cells upon exposition to NECA (1µM; n = 3) +/− SCH58261 (1µM; n = 2) in presence or not of (A) mouse recombinant IL-10 (100 ng/mL) or (B) mouse recombinant IFN-γ (10 ng/mL). (C) MFI and fold change in PD-L1 expression of CLL cells derived from 3 Eµ-TCL1tg/wt CD73−/− male mice exposed to CGS 21680 (1 µM; n = 2). Means +/− SEM are shown (* p < 0.05; ** p < 0.01; *** p < 0.001 by 1-way ANOVA).
Figure 6
Figure 6
ADORA2A gene expression is associated with PD-L1 levels and increased risk stratification. Gene expression profile and mutation information data from 156 CLL patients, publicly available through the cBio Cancer Genomics Portal, were used to compared mRNA levels (RNA-seq TPM) of A2a (ADORA2A) between high- and low-risk patients. (A) A2a gene expression levels in IGHV-mutated (low risk; n = 92) and -unmutated (high risk; n = 59) patients. (B) A2a gene expression levels in TP53-mutated (high risk; n = 16) and -unmutated (low risk; n = 140) patients. (C) Correlation between A2a and PD-L1 gene expression. (D,E) Correlations between PD-L1 mRNA and adenosine gene signatures published by (D) Sidders et al. [26] (ADO-signature 1) and (E) Fong et al. [27] (ADO-signature 2). Means +/− SEM are shown (** p < 0.01; by Mann–Whitney test (A,B) and Pearson correlation (CE)). TPM, transcript per million.

Similar articles

Cited by

References

    1. Dong Y., Shi O., Zeng Q., Lu X., Wang W., Li Y., Wang Q. Leukemia incidence trends at the global, regional, and national level between 1990 and 2017. Exp. Hematol. Oncol. 2020;9:14. doi: 10.1186/s40164-020-00170-6. - DOI - PMC - PubMed
    1. Catovsky D., Wade R., Else M. The clinical significance of patients’ sex in chronic lymphocytic leukemia. Haematologica. 2014;99:1088–1094. doi: 10.3324/haematol.2013.101378. - DOI - PMC - PubMed
    1. Ramsay A.G., Clear A.J., Fatah R., Gribben J.G. Multiple inhibitory ligands induce impaired T-cell immunologic synapse function in chronic lymphocytic leukemia that can be blocked with lenalidomide: Establishing a reversible immune evasion mechanism in human cancer. Blood. 2012;120:1412–1421. doi: 10.1182/blood-2012-02-411678. - DOI - PMC - PubMed
    1. Riches J.C., Davies J.K., McClanahan F., Fatah R., Iqbal S., Agrawal S., Ramsay A.G., Gribben J.G. T cells from CLL patients exhibit features of T-cell exhaustion but retain capacity for cytokine production. Blood. 2013;121:1612–1621. doi: 10.1182/blood-2012-09-457531. - DOI - PMC - PubMed
    1. McClanahan F., Hanna B., Miller S., Clear A.J., Lichter P., Gribben J.G., Seiffert M. PD-L1 checkpoint blockade prevents immune dysfunction and leukemia development in a mouse model of chronic lymphocytic leukemia. Blood. 2015;126:203–211. doi: 10.1182/blood-2015-01-622936. - DOI - PMC - PubMed

LinkOut - more resources