

Artificial Intelligence-Based Prognostic Model for Urologic Cancers: A SEER-Based Study
- PMID: 35804904
- PMCID: PMC9264864
- DOI: 10.3390/cancers14133135
Artificial Intelligence-Based Prognostic Model for Urologic Cancers: A SEER-Based Study
Abstract
Background: Prognostication is essential to determine the risk profile of patients with urologic cancers.
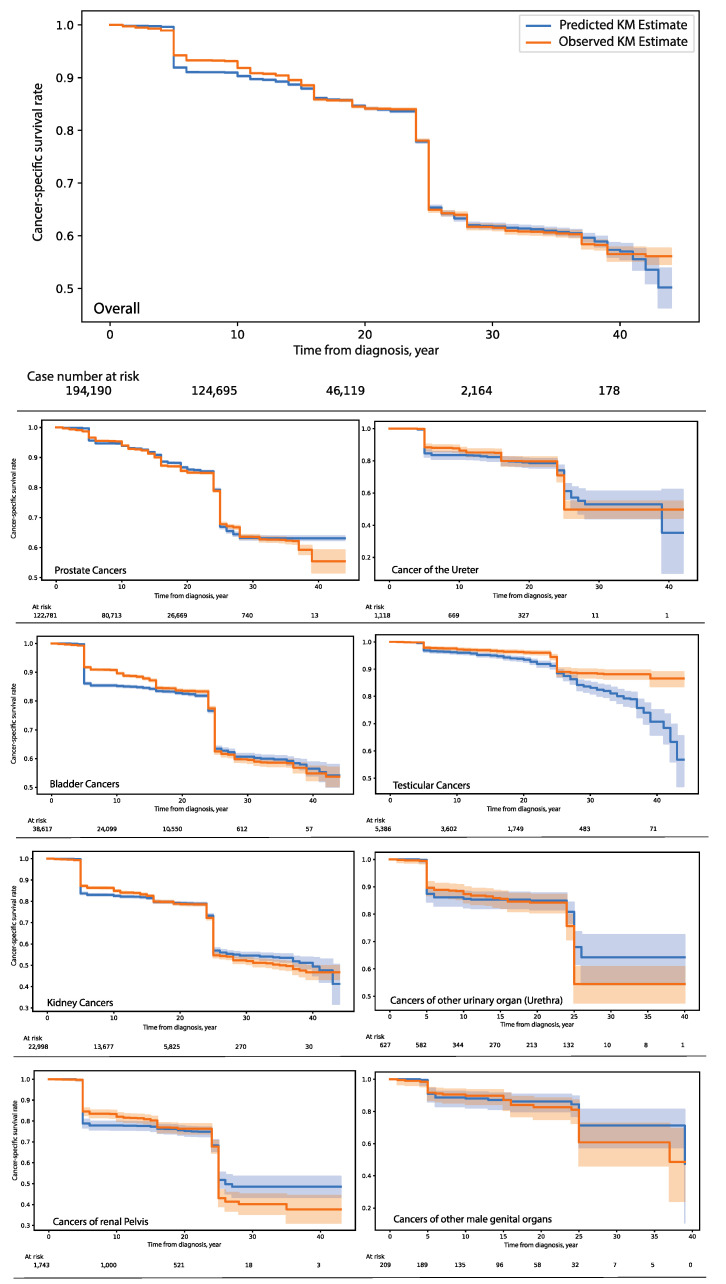
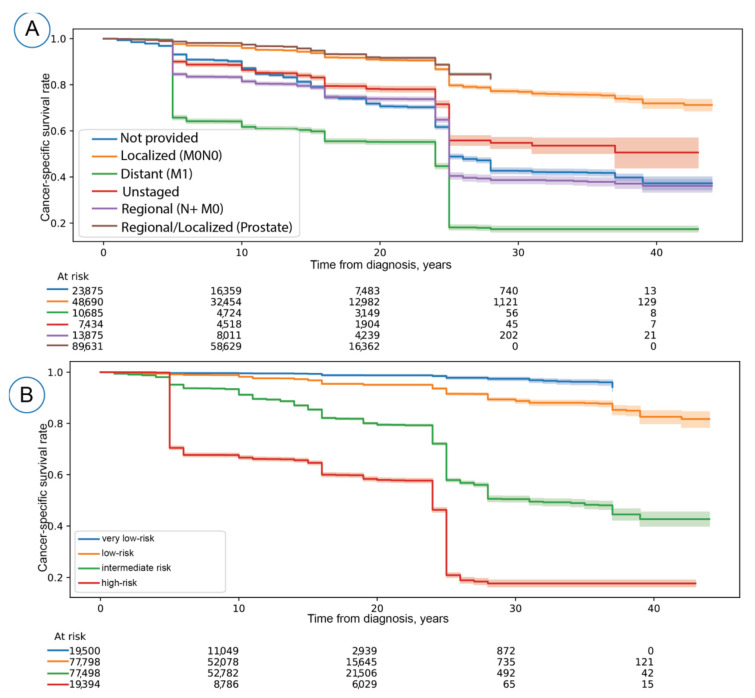
Methods: We utilized the SEER national cancer registry database with approximately 2 million patients diagnosed with urologic cancers (penile, testicular, prostate, bladder, ureter, and kidney). The cohort was randomly divided into the development set (90%) and the out-held test set (10%). Modeling algorithms and clinically relevant parameters were utilized for cancer-specific mortality prognosis. The model fitness for the survival estimation was assessed using the differences between the predicted and observed Kaplan-Meier estimates on the out-held test set. The overall concordance index (c-index) score estimated the discriminative accuracy of the survival model on the test set. A simulation study assessed the estimated minimum follow-up duration and time points with the risk stability.
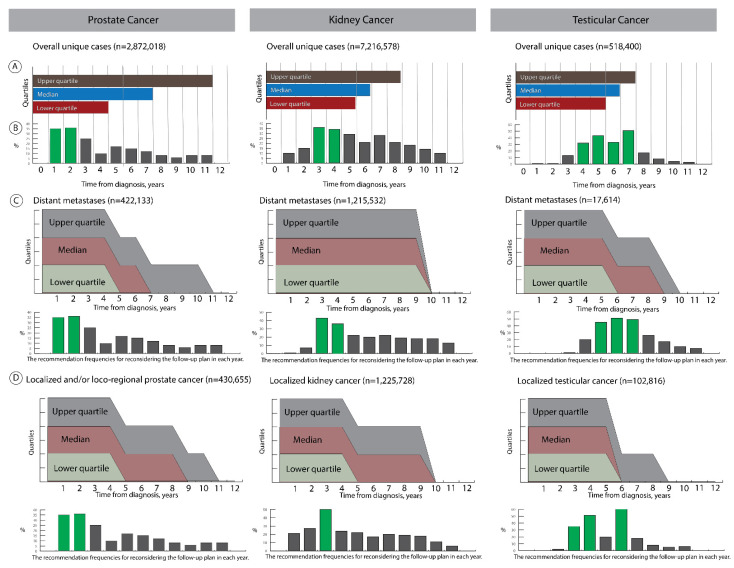
Results: We achieved a well-calibrated prognostic model with an overall c-index score of 0.800 (95% CI: 0.795-0.805) on the representative out-held test set. The simulation study revealed that the suggestions for the follow-up duration covered the minimum duration and differed by the tumor dissemination stages and affected organs. Time points with a high likelihood for risk stability were identifiable.
Conclusions: A personalized temporal survival estimation is feasible using artificial intelligence and has potential application in clinical settings, including surveillance management.
Keywords: artificial intelligence; data-driven solution; machine learning; surveillance management; survival modeling; urologic cancers.
Conflict of interest statement
The authors declare no conflict of interest.
Figures
Similar articles
-
Application of a novel machine learning framework for predicting non-metastatic prostate cancer-specific mortality in men using the Surveillance, Epidemiology, and End Results (SEER) database.Lancet Digit Health. 2021 Mar;3(3):e158-e165. doi: 10.1016/S2589-7500(20)30314-9. Epub 2021 Feb 3. Lancet Digit Health. 2021. PMID: 33549512
-
Does the SORG Algorithm Predict 5-year Survival in Patients with Chondrosarcoma? An External Validation.Clin Orthop Relat Res. 2019 Oct;477(10):2296-2303. doi: 10.1097/CORR.0000000000000748. Clin Orthop Relat Res. 2019. PMID: 31107338 Free PMC article.
-
Development and Validation of a Clinical Prognostic Stage Group System for Nonmetastatic Prostate Cancer Using Disease-Specific Mortality Results From the International Staging Collaboration for Cancer of the Prostate.JAMA Oncol. 2020 Dec 1;6(12):1912-1920. doi: 10.1001/jamaoncol.2020.4922. JAMA Oncol. 2020. PMID: 33090219 Free PMC article.
-
20-Year Comparative Survival and Mortality of Cancer of the Stomach by Age, Sex, Race, Stage, Grade, Cohort Entry Time-Period, Disease Duration & Selected ICD-O-3 Oncologic Phenotypes: A Systematic Review of 157,258 Cases for Diagnosis Years 1973-2014: (SEER*Stat 8.3.4).J Insur Med. 2019;48(1):5-23. doi: 10.17849/insm-48-1-1-19.1. Epub 2019 Oct 14. J Insur Med. 2019. PMID: 31609640
-
Updates in the Eighth Edition of the Tumor-Node-Metastasis Staging Classification for Urologic Cancers.Eur Urol. 2018 Apr;73(4):560-569. doi: 10.1016/j.eururo.2017.12.018. Epub 2018 Jan 9. Eur Urol. 2018. PMID: 29325693 Review.
Cited by
-
Using machine learning for predicting cancer-specific mortality in bladder cancer patients undergoing radical cystectomy: a SEER-based study.BMC Cancer. 2025 Mar 21;25(1):523. doi: 10.1186/s12885-025-13942-2. BMC Cancer. 2025. PMID: 40119324 Free PMC article.
-
A Scoping Review on Calibration Methods for Cancer Simulation Models.Med Decis Making. 2025 Aug 11:272989X251353211. doi: 10.1177/0272989X251353211. Online ahead of print. Med Decis Making. 2025. PMID: 40790869 Free PMC article. Review.
-
Personalized Biopsy Schedules Using an Interval-Censored Cause-Specific Joint Model.Stat Med. 2025 May;44(10-12):e70134. doi: 10.1002/sim.70134. Stat Med. 2025. PMID: 40415587 Free PMC article.
-
An Artificial Intelligence-Based Tool for Data Analysis and Prognosis in Cancer Patients: Results from the Clarify Study.Cancers (Basel). 2022 Aug 22;14(16):4041. doi: 10.3390/cancers14164041. Cancers (Basel). 2022. PMID: 36011034 Free PMC article.
-
The Present and Future of Artificial Intelligence in Urological Cancer.J Clin Med. 2023 Jul 29;12(15):4995. doi: 10.3390/jcm12154995. J Clin Med. 2023. PMID: 37568397 Free PMC article. Review.
References
-
- Colombel M., Soloway M., Akaza H., Böhle A., Palou J., Buckley R., Lamm D., Brausi M., Witjes J.A., Persad R. Epidemiology, staging, grading, and risk stratification of bladder cancer. Eur. Urol. Suppl. 2008;7:618–626. doi: 10.1016/j.eursup.2008.08.002. - DOI
LinkOut - more resources
Full Text Sources
