Review
. 2022 Jun 28;14(13):3170.
doi: 10.3390/cancers14133170.

Multiplex Tissue Imaging: Spatial Revelations in the Tumor Microenvironment

Affiliations
Review

Multiplex Tissue Imaging: Spatial Revelations in the Tumor Microenvironment

Stephanie van Dam et al. Cancers (Basel). .

Abstract

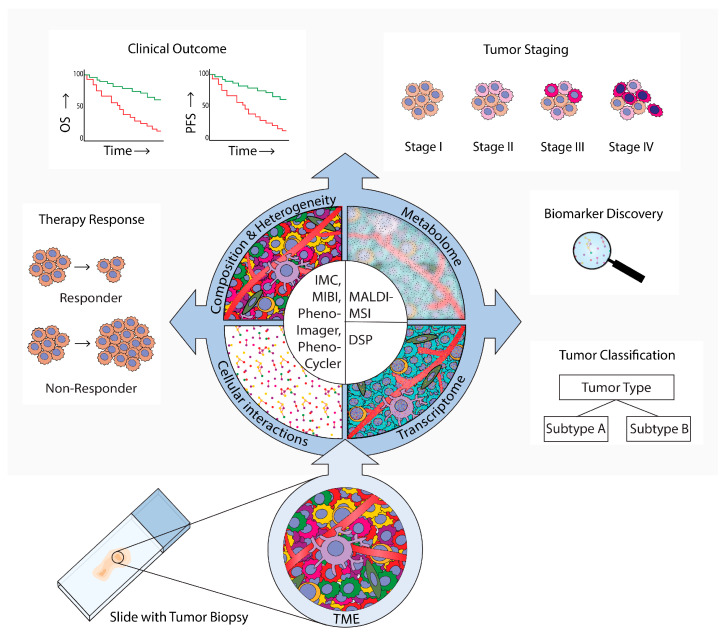
The tumor microenvironment is a complex ecosystem containing various cell types, such as immune cells, fibroblasts, and endothelial cells, which interact with the tumor cells. In recent decades, the cancer research field has gained insight into the cellular subtypes that are involved in tumor microenvironment heterogeneity. Moreover, it has become evident that cellular interactions in the tumor microenvironment can either promote or inhibit tumor development, progression, and drug resistance, depending on the context. Multiplex spatial analysis methods have recently been developed; these have offered insight into how cellular crosstalk dynamics and heterogeneity affect cancer prognoses and responses to treatment. Multiplex (imaging) technologies and computational analysis methods allow for the spatial visualization and quantification of cell-cell interactions and properties. These technological advances allow for the discovery of cellular interactions within the tumor microenvironment and provide detailed single-cell information on properties that define cellular behavior. Such analyses give insights into the prognosis and mechanisms of therapy resistance, which is still an urgent problem in the treatment of multiple types of cancer. Here, we provide an overview of multiplex imaging technologies and concepts of downstream analysis methods to investigate cell-cell interactions, how these studies have advanced cancer research, and their potential clinical implications.

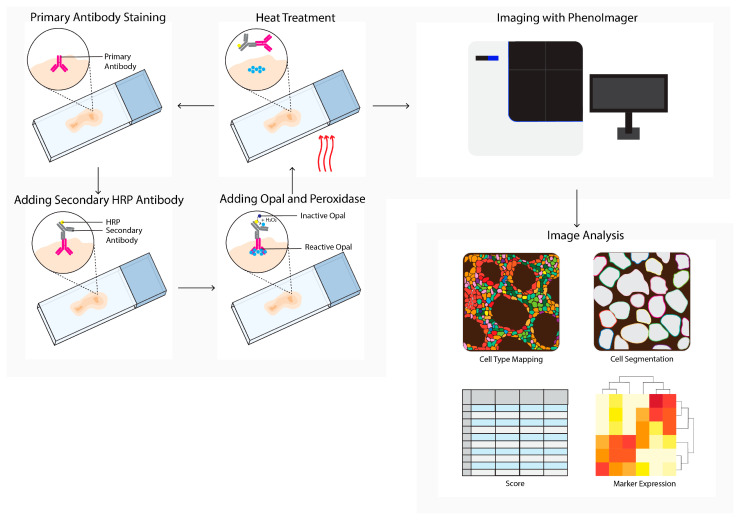
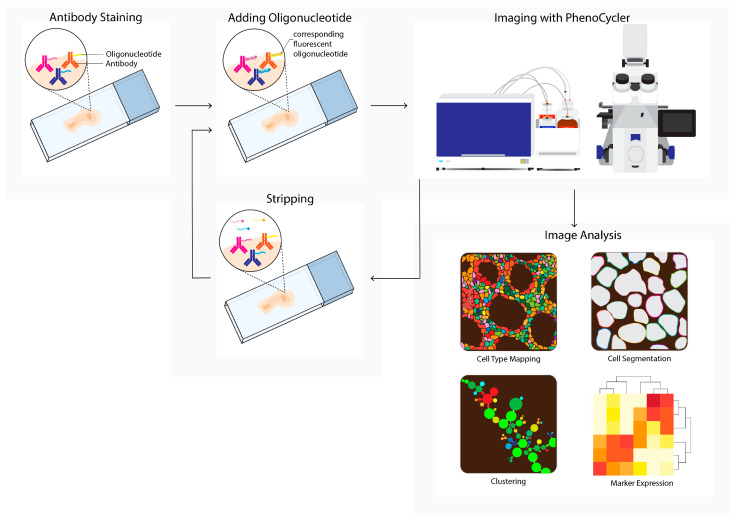
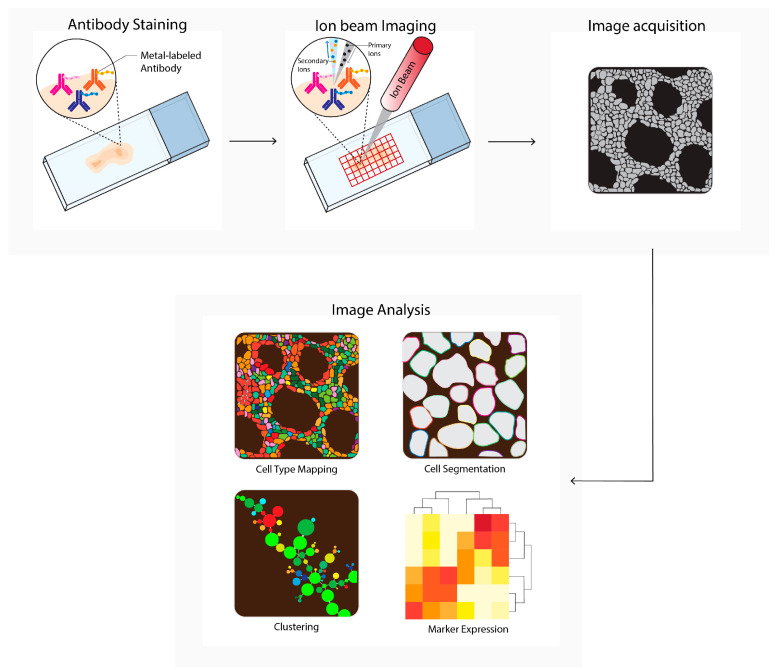
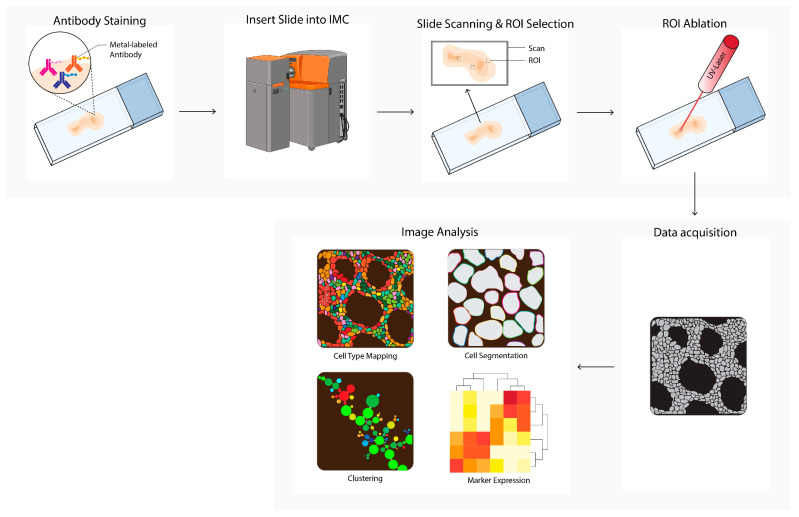
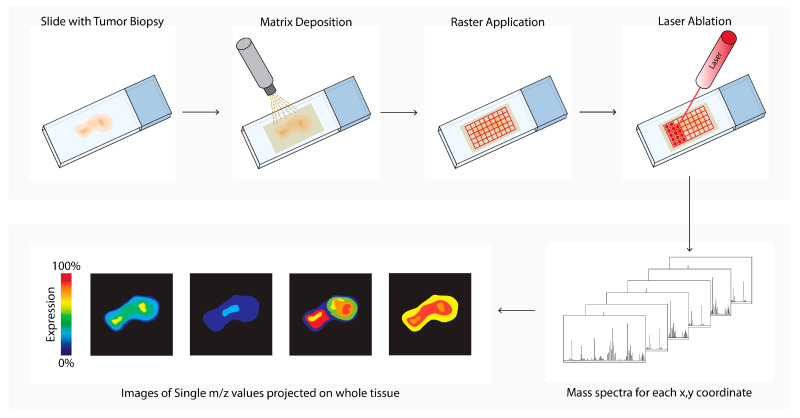
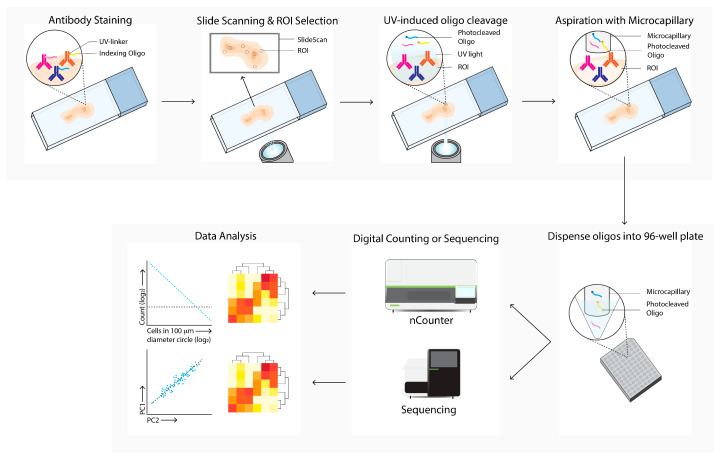
Keywords: MALDI-MSI; MIBI; PhenoCycler; PhenoImager; cancer; imaging mass cytometry; multiplex imaging; single-cell data analysis; spatial analysis; tumor microenvironment.


Conflict of interest statement

The authors declare no conflict of interest.

Figures

Figure 2
Figure 2
PhenoImager (Vectra) workflow. PhenoImager allows for the use of up to six primary antibodies (or eight in case of the high throughput version) and a nuclear stain. Antibody staining is performed in repetitive cycles of one primary antibody, a secondary horseradish peroxidase (HRP)-labeled antibody, followed by the addition of an opal polymer. HRP converts the opal fluorophore when peroxidase is present. Next, the primary and secondary antibodies are stripped by heat treatment, followed by the next staining cycle, and finally the tissue slide is analyzed using the PhenoImager microscopy system, resulting in data images. Cells in these images can be segmented and downstream analysis can be performed (e.g., cell type mapping and marker expression).
Figure 3
Figure 3
PhenoCycler (CODEX) workflow. Tissue is labeled using oligonucleotide-conjugated antibodies to detect up to one hundred markers simultaneously. Initial antibody staining is followed by hybridization cycles with three reporter oligonucleotides containing spectrum-separable fluorophores, which hybridize with the unique antisense oligonucleotide conjugated to the primary antibody (left). After each cycle, a microscopy image is acquired (imaging with PhenoCycler). Next, reporters are removed; this is followed by the next reporter hybridization cycle. Images from all cycles are compiled and registered to generate multiplex data images. During imaging analysis, these images can be processed into single-cell expression data and downstream analysis is performed (e.g., cell type mapping, clustering, marker expression).
Figure 4
Figure 4
Multiplexed ion beam imaging by time-of-flight (MIBI-TOF) workflow. Tissues are first labeled with a multiplex panel of antibodies conjugated with heavy metals containing polymers. Next, these are directly ionized to generate secondary ions. Ions are filtered and detected by time-of flight mass spectrometry. Next, multiplex images are generated, containing images depicting expressions for each separate antibody–metal conjugate. These images can be processed into single-cell expression data. During imaging analysis, these images can be processed into single-cell expression data and downstream analysis is performed (e.g., cell type mapping, clustering, marker expression).
Figure 5
Figure 5
Imaging mass cytometry (IMC) workflow. Tissues are first labeled with a multiplex panel of antibodies conjugated with heavy metal containing polymers. Next, the slide is inserted into the imaging mass cytometer (IMC) and regions of interest (ROI) are selected. Small pieces of 1 uM2 of labeled tissue are consecutively ablated with a UV-laser and ionized. Ions are filtered and detected by time-of flight mass spectrometry. Next, multiplex images are generated, containing images depicting expressions for each separate antibody–metal conjugate. During imaging analysis, these images can be processed into single-cell expression data and downstream analysis is performed (e.g., cell type mapping, clustering, marker expression). The Hyperion cartoon was acquired from BioRender.
Figure 6
Figure 6
Matrix-assisted laser desorption ionization mass spectrometry imaging (MALDI-MSI) workflow. Tissue sections are processed, and a matrix is applied (matrix deposition). Next, a laser in the MALDI-MSI creates a 10–150 micrometer raster (Raster Application). The laser beam ionizes a spot in each raster (laser ablation), and the ionized analytes from the raster are transferred into the mass spectrometer for compound identification (mass spectra). In parallel, an image is created by combining the data of the spot location with the corresponding measured mass spectrum (images of single m/z values).
Figure 7
Figure 7
Digital Spatial Profiling (DSP) workflow. Tissue sections are labeled with antibodies and/or in situ hybridization with mRNA probes, which are linked with UV-cleavable oligo-tags. Slides are labeled with fluorescence-conjugated antibodies to determine cell subsets and select regions of interests and masks for bulk cell subsets for directed UV-cleavage of the oligo-tags. The cleaved oligos are collected with a microcapillary and transferred to a 96-well plate. Next, the oligos are quantified by digital counting (nCounter) or next-generation sequencing. Differential expression of specific mRNA or proteins between ROIs and cell subsets are next analyzed (data analysis).
Figure 1
Figure 1
Spatial analysis of the tumor microenvironment (TME). Methods, results, and implications in cancer research. This review provides an overview of technologies that are used for TME spatial analyses in cancer research. These technologies employ microscopy (PhenoImager, PhenoCycler), mass-spectrometry (imaging mass cytometry (IMC)), multiplexed ion beam imaging by time-of-flight (MIBI), and (matrix-assisted laser desorption ionization mass spectrometry imaging (MALDI-MS)), or digital spatial profiling (DSP). PhenoImager, PhenoCycler, IMC, and MIBI can be used to investigate single cells and to explore the cellular composition, heterogeneity, and cellular interactions of the TME. MALDI-MSI can be employed to investigate the TME metabolome in specific regions, and DSP can be used to explore the transcriptome in bulk cells of up to three different subsets. These multiplex spatial methods have provided novel insights into specific biomarkers and TME spatial hallmarks that can be used for tumor subtype classification. Moreover, these methods have uncovered which TME characteristics are related to tumor evolution and progression to advanced stages, clinical prognosis parameters such as overall survival (OS) and progression-free survival (PFS), and prediction of therapy responses.

References

    1. Elaldi R., Hemon P., Petti L., Cosson E., Desrues B., Sudaka A., Poissonnet G., Van Obberghen-Schilling E., Pers J.-O., Braud V.M., et al. High Dimensional Imaging Mass Cytometry Panel to Visualize the Tumor Immune Microenvironment Contexture. Front. Immunol. 2021;12:666233. doi: 10.3389/fimmu.2021.666233. - DOI - PMC - PubMed
    1. Chappell L., Russell A.J., Voet T. Single-Cell (Multi)omics Technologies. Annu. Rev. Genom. Hum. Genet. 2018;19:15–41. doi: 10.1146/annurev-genom-091416-035324. - DOI - PubMed
    1. Ramazzotti D., Lal A., Wang B., Batzoglou S., Sidow A. Multiomic tumor data reveal diversity of molecular mechanisms that correlate with survival. Nat. Commun. 2018;9:1–14. doi: 10.1038/s41467-018-06921-8. - DOI - PMC - PubMed
    1. Tirosh I., Izar B., Prakadan S.M., Wadsworth M.H., Treacy D., Trombetta J.J., Rotem A., Rodman C., Lian C., Murphy G., et al. Dissecting the multicellular ecosystem of metastatic melanoma by single-cell RNA-seq. Science. 2016;352:189–196. doi: 10.1126/science.aad0501. - DOI - PMC - PubMed
    1. Li H., van der Leun A.M., Yofe I., Lubling Y., Gelbard-Solodkin D., van Akkooi A.C., van den Braber M., Rozeman E.A., Haanen J.B., Blank C.U., et al. Dysfunctional CD8 T Cells Form a Proliferative, Dynamically Regulated Compartment within Human Melanoma. Cell. 2020;181:747. doi: 10.1016/j.cell.2020.04.017. - DOI - PubMed

LinkOut - more resources