

Circulating and Tumor-Infiltrating Immune Checkpoint-Expressing CD8+ Treg/T Cell Subsets and Their Associations with Disease-Free Survival in Colorectal Cancer Patients
- PMID: 35804964
- PMCID: PMC9265020
- DOI: 10.3390/cancers14133194
Circulating and Tumor-Infiltrating Immune Checkpoint-Expressing CD8+ Treg/T Cell Subsets and Their Associations with Disease-Free Survival in Colorectal Cancer Patients
Abstract
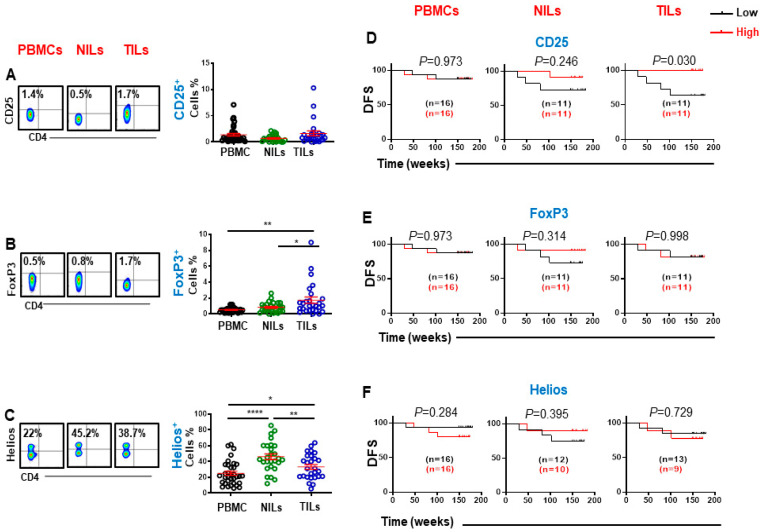
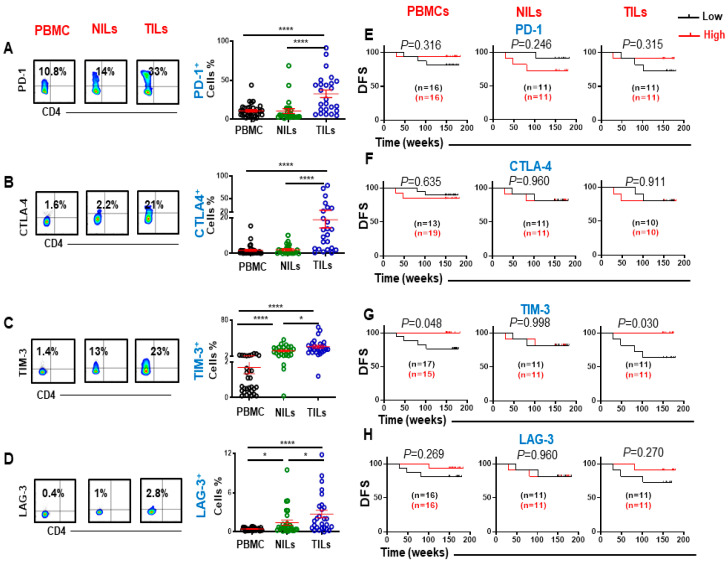
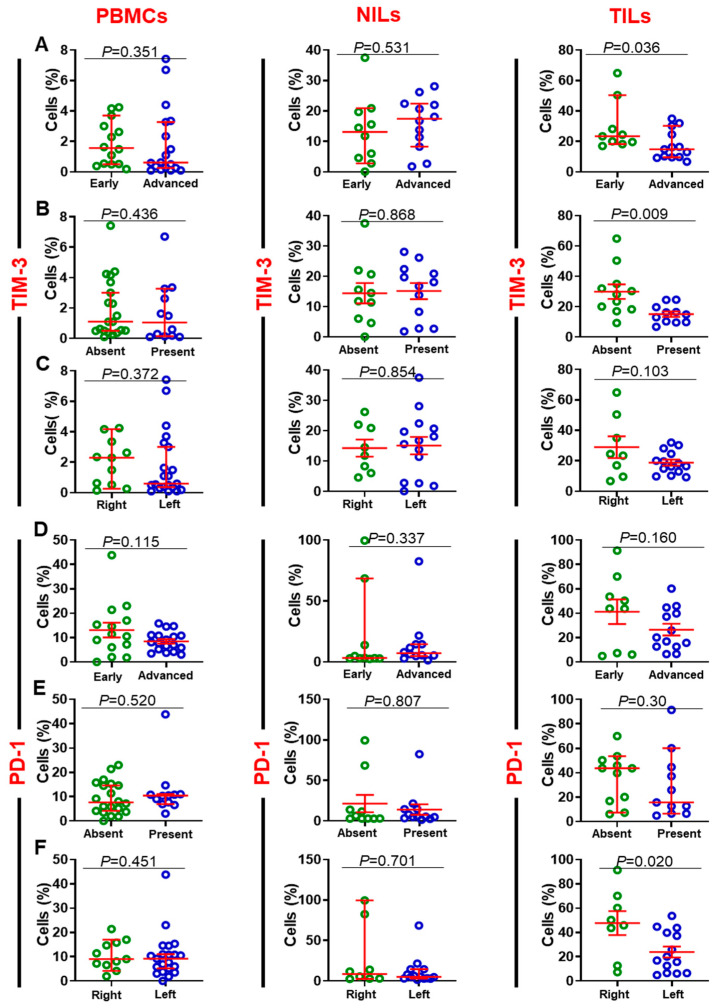
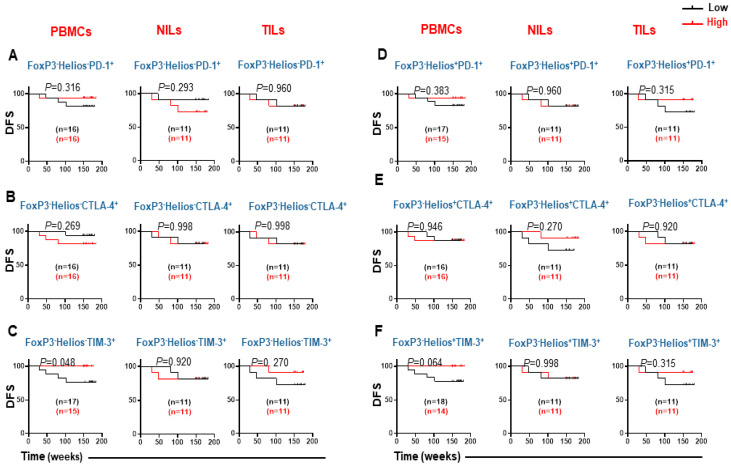
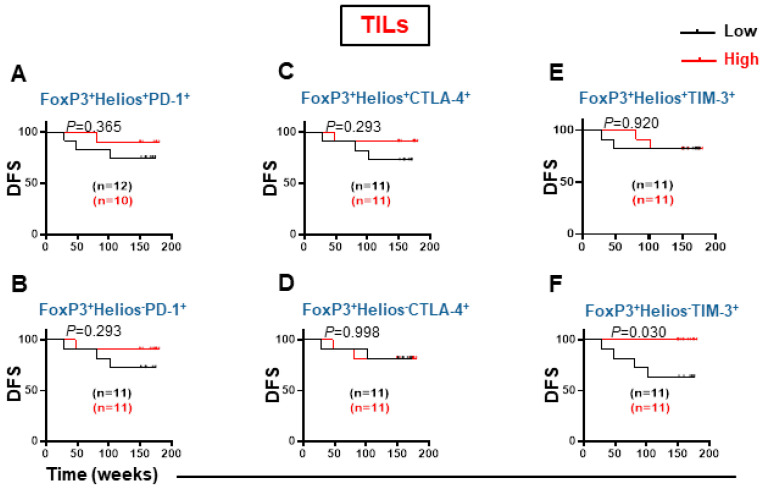
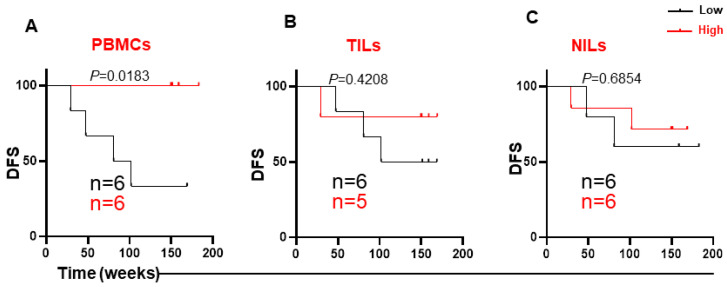
T cells in the tumor microenvironment (TME) have diverse roles in anti-tumor immunity, including orchestration of immune responses and anti-tumor cytotoxic attack. However, different T cell subsets may have opposing roles in tumor progression, especially in inflammation-related cancers such as colorectal cancer (CRC). In this study, we phenotypically characterized CD3+CD4- (CD8+) T cells in colorectal tumor tissues (TT), normal colon tissues (NT) and in circulation of CRC patients. We investigated the expression levels of key immune checkpoints (ICs) and Treg-related markers in CD8+ T cells. Importantly, we investigated associations between different tumor-infiltrating CD8+ T cell subpopulations and disease-free survival (DFS) in CRC patients. We found that FoxP3 expression and ICs including PD-1, CTLA-4, TIM-3, and LAG-3 were significantly increased in tumor-infiltrating CD8+ T cells compared with NT and peripheral blood. In the TME, we found that TIM-3 expression was significantly increased in patients with early stages and absent lymphovascular invasion (LVI) compared to patients with advanced stages and LVI. Importantly, we report that high levels of certain circulating CD8+ T cell subsets (TIM-3-expressing, FoxP3-Helios-TIM-3+ and FoxP3-Helios+TIM-3+ cells) in CRC patients were associated with better DFS. Moreover, in the TME, we report that elevated levels of CD25+ and TIM-3+ T cells, and FoxP3+Helios-TIM-3+ Tregs were associated with better DFS.
Keywords: CD8+ T cells; PBMCs; Progression-Free Survival; TILs; Tregs; immune checkpoints.
Conflict of interest statement
The authors declare that the research was conducted in the absence of any commercial or financial relationships that could be construed as a potential conflict of interest.
Figures
Similar articles
-
Immune Checkpoints in Circulating and Tumor-Infiltrating CD4+ T Cell Subsets in Colorectal Cancer Patients.Front Immunol. 2019 Dec 17;10:2936. doi: 10.3389/fimmu.2019.02936. eCollection 2019. Front Immunol. 2019. PMID: 31921188 Free PMC article. Clinical Trial.
-
Associations of different immune checkpoints-expressing CD4+ Treg/ T cell subsets with disease-free survival in colorectal cancer patients.BMC Cancer. 2022 Jun 2;22(1):601. doi: 10.1186/s12885-022-09710-1. BMC Cancer. 2022. PMID: 35655158 Free PMC article.
-
Correlations between Circulating and Tumor-Infiltrating CD4+ T Cell Subsets with Immune Checkpoints in Colorectal Cancer.Vaccines (Basel). 2022 Mar 30;10(4):538. doi: 10.3390/vaccines10040538. Vaccines (Basel). 2022. PMID: 35455287 Free PMC article.
-
Colorectal Cancer-Infiltrating Regulatory T Cells: Functional Heterogeneity, Metabolic Adaptation, and Therapeutic Targeting.Front Immunol. 2022 Jul 8;13:903564. doi: 10.3389/fimmu.2022.903564. eCollection 2022. Front Immunol. 2022. PMID: 35874729 Free PMC article. Review.
-
Immune checkpoint inhibitors in cancer therapy: a focus on T-regulatory cells.Immunol Cell Biol. 2018 Jan;96(1):21-33. doi: 10.1111/imcb.1003. Epub 2017 Nov 17. Immunol Cell Biol. 2018. PMID: 29359507 Review.
Cited by
-
Cuproptosis, ferroptosis and PANoptosis in tumor immune microenvironment remodeling and immunotherapy: culprits or new hope.Mol Cancer. 2024 Nov 15;23(1):255. doi: 10.1186/s12943-024-02130-8. Mol Cancer. 2024. PMID: 39543600 Free PMC article. Review.
-
Tumor-immune hybrid cells evade the immune response and potentiate colorectal cancer metastasis through CTLA4.Clin Exp Med. 2024 Nov 5;25(1):2. doi: 10.1007/s10238-024-01515-9. Clin Exp Med. 2024. PMID: 39499374 Free PMC article.
-
Reprogramming of Treg cells in the inflammatory microenvironment during immunotherapy: a literature review.Front Immunol. 2023 Sep 11;14:1268188. doi: 10.3389/fimmu.2023.1268188. eCollection 2023. Front Immunol. 2023. PMID: 37753092 Free PMC article. Review.
-
Immune-related gene-based prognostic index for predicting survival and immunotherapy outcomes in colorectal carcinoma.Front Immunol. 2022 Dec 13;13:944286. doi: 10.3389/fimmu.2022.944286. eCollection 2022. Front Immunol. 2022. PMID: 36591255 Free PMC article.
-
The pathogenic response of cytotoxic T‑lymphocytes, a common therapeutic target for cancer, has a direct impact on treatment outcomes (Review).Oncol Rep. 2024 Jul;52(1):98. doi: 10.3892/or.2024.8757. Epub 2024 Jun 21. Oncol Rep. 2024. PMID: 38904200 Free PMC article. Review.
References
-
- Ferlay J. GLOBOCAN 2002. IARC Press; Lyon, France: 2004. Cancer incidence, mortality and prevalence worldwide.
LinkOut - more resources
Full Text Sources
Research Materials
