. 2022 Jun 30;11(13):2079.
doi: 10.3390/cells11132079.

Mitoribosomal Deregulation Drives Senescence via TPP1-Mediated Telomere Deprotection

Affiliations

Mitoribosomal Deregulation Drives Senescence via TPP1-Mediated Telomere Deprotection

Seongki Min et al. Cells. .

Abstract

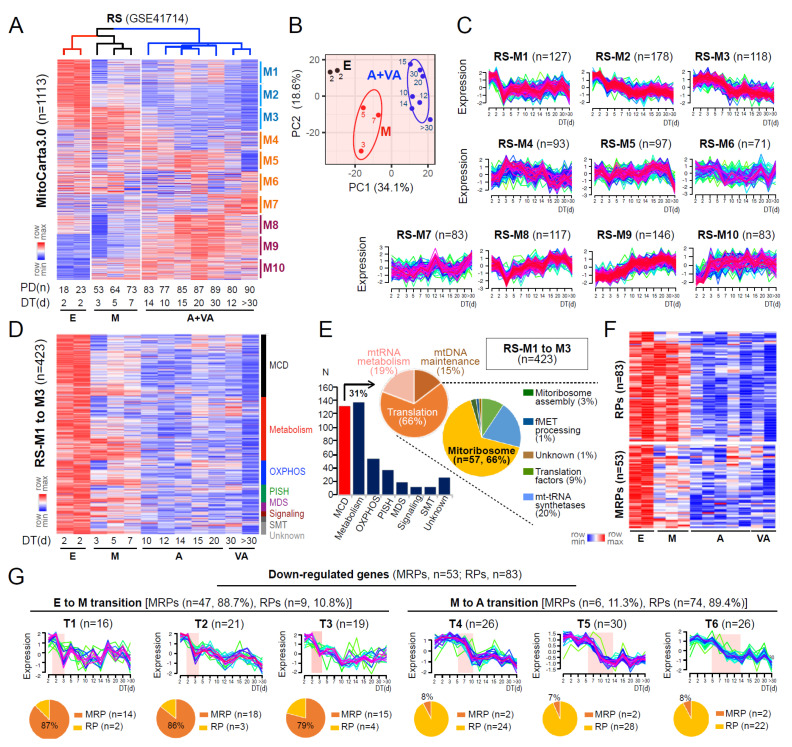
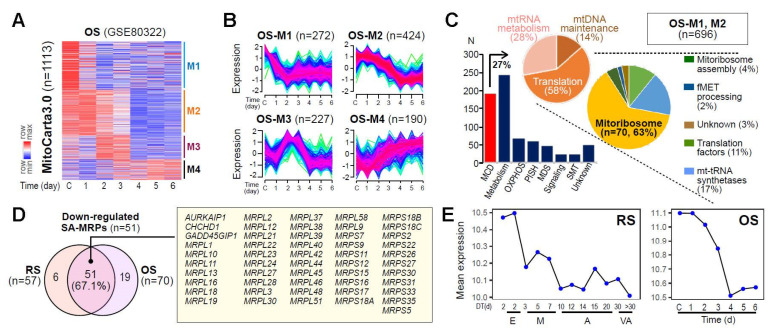
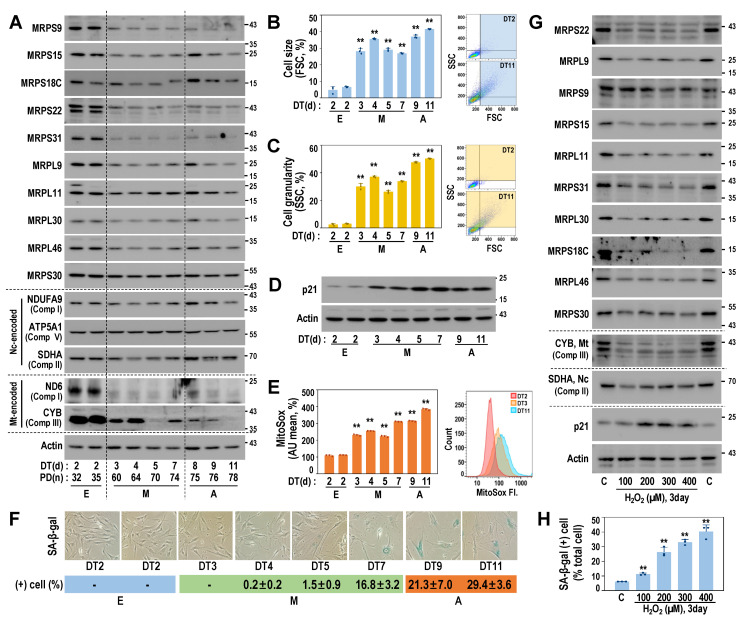
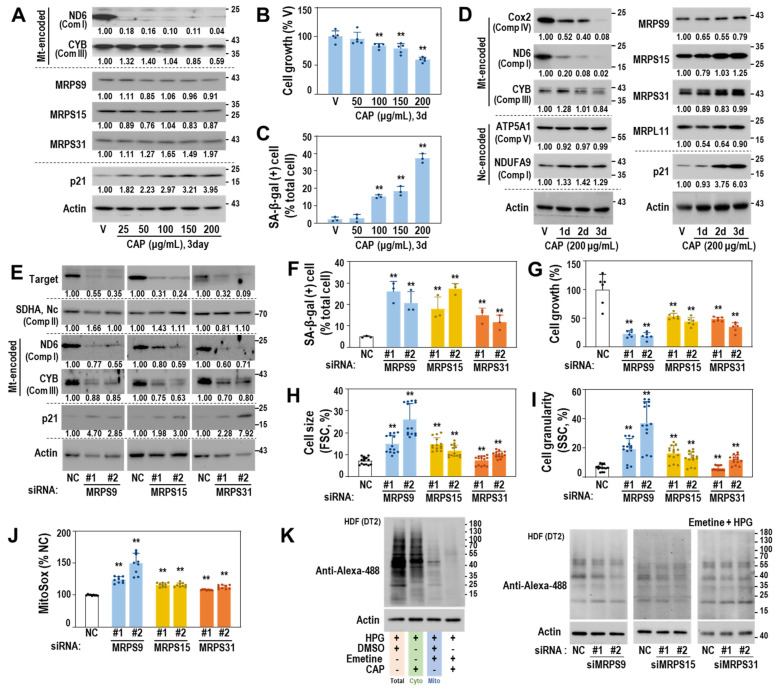
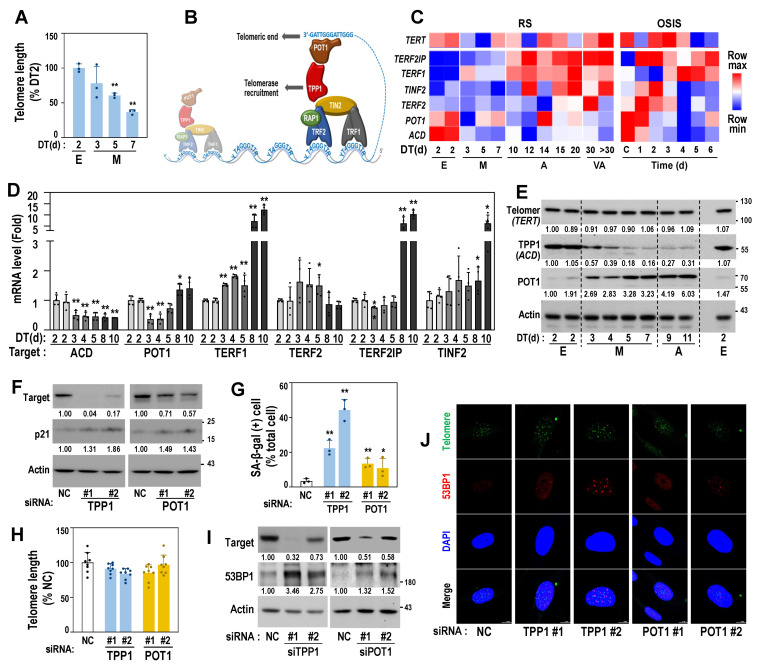
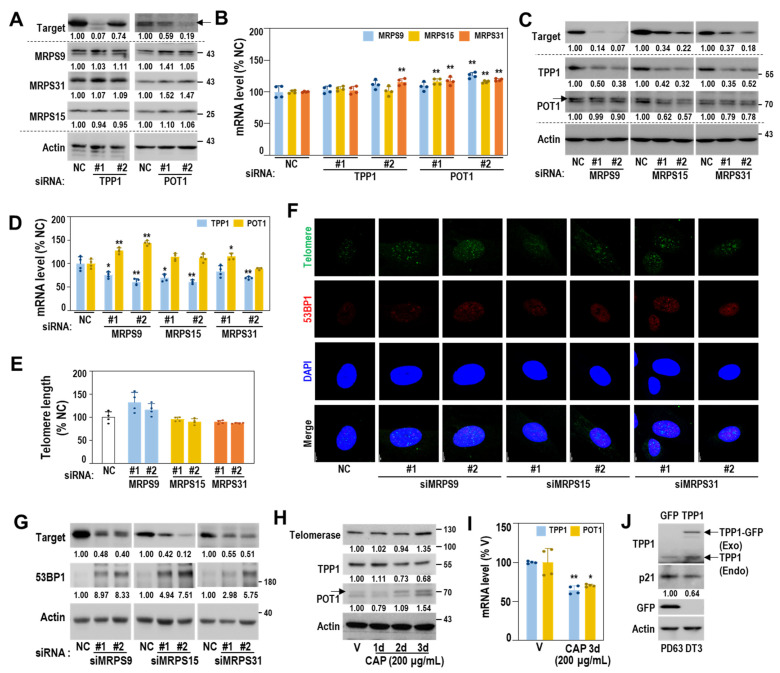
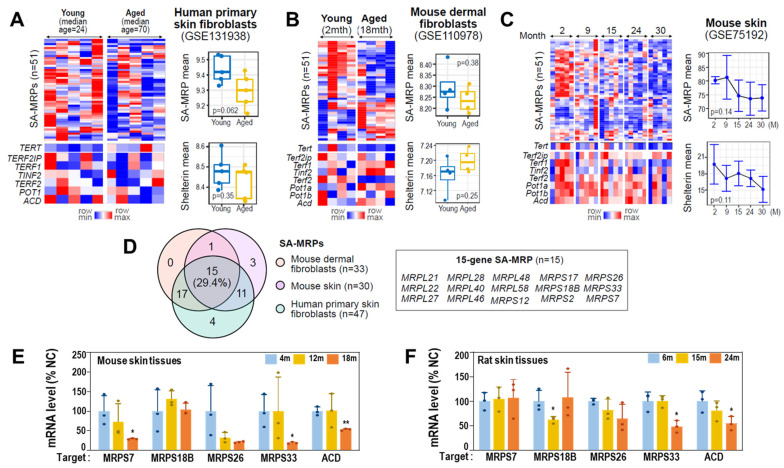
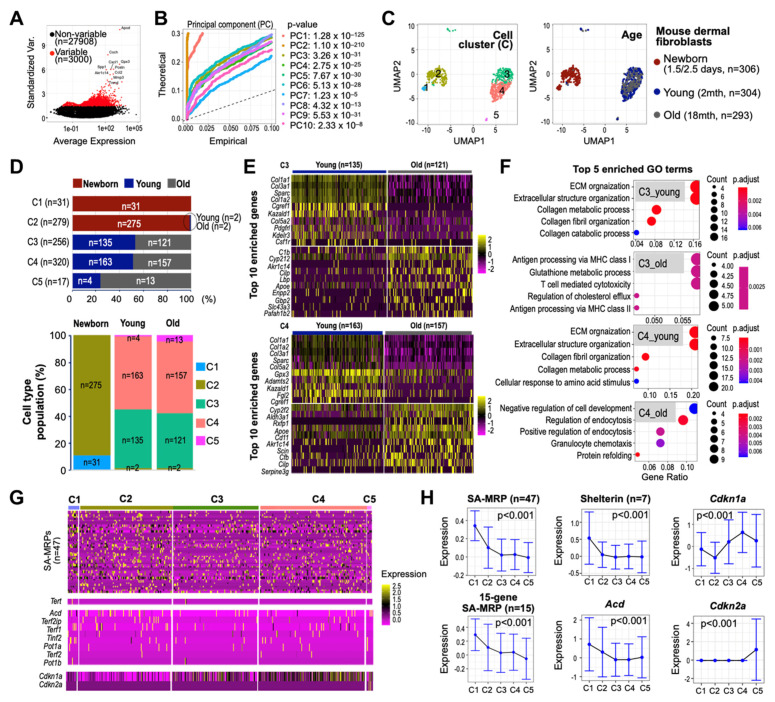
While mitochondrial bioenergetic deregulation has long been implicated in cellular senescence, its mechanistic involvement remains unclear. By leveraging diverse mitochondria-related gene expression profiles derived from two different cellular senescence models of human diploid fibroblasts, we found that the expression of mitoribosomal proteins (MRPs) was generally decreased during the early-to-middle transition prior to the exhibition of noticeable SA-β-gal activity. Suppressed expression patterns of the identified senescence-associated MRP signatures (SA-MRPs) were validated in aged human cells and rat and mouse skin tissues and in aging mouse fibroblasts at single-cell resolution. TIN2- and POT1-interaction protein (TPP1) was concurrently suppressed, which induced senescence, accompanied by telomere DNA damage. Lastly, we show that SA-MRP deregulation could be a potential upstream regulator of TPP1 suppression. Our results indicate that mitoribosomal deregulation could represent an early event initiating mitochondrial dysfunction and serve as a primary driver of cellular senescence and an upstream regulator of shelterin-mediated telomere deprotection.

Keywords: mitoribosome; replicative senescence; shelterin; telomere maintenance.


Conflict of interest statement

The authors declare no conflict of interest.

Figures

Figure 1
Figure 1
MRP deregulation is a key event occurring during the initial E-to-M transition of replicative senescence. (A) Expression heatmap and unsupervised hierarchical clustering (metric = one minus Pearson correleation, linkage method = average) of genes from MitoCarta3.0 in RS of HDFs. DT and PT refer to the doubling time (days) and the number of population doublings to reach the cell condition, respectively. E, M, A, and VA refer to cells at early, middle, advanced, and very advanced stages of senescence, respectively. (B) Principal components (PC) plot of RS showing a clear separation between samples at different stages of senescence. (C) Expression patterns of M1 to M10 gene clusters identified by fuzzy c-means clustering over DT. Ellipses represent one standard deviation away from the mean of the Gaussian fitted to samples. n refers to the number of genes assigned in each cluster. (D) Expression heatmap of RS-M1 to M3 gene clusters. MCD = mitochondrial central dogma; OXPHOS = oxidative phosphorylation; PISH = protein import, sorting and homeostasis; MDS = mitochondrial dynamics and surveillance; SMT = small molecule transport. (E) Bar chart and pie charts showing the number and proportion of genes assigned to each category defined by MitoCarta3.0. (F) Expression heatmap and (G) expression patterns of cytosolic ribosomal proteins (RPs, n = 83) and mitochondrial ribosomal proteins (MRPs, n = 53) showing progressive downregulation over DT, as identified by fuzzy c-means clustering. Pie charts (bottom) depict the proportion of MRP or RP genes present in each gene cluster.
Figure 2
Figure 2
Identification of the SA-MPRs commonly downregulated in cellular senescence. (A) Expression heatmap of genes from MitoCarta 3.0 in OS of HDFs. (B) Fuzzy c-means clustering of genes from MitoCarta 3.0 identified four gene clusters, termed M1 to M4. (C) Bar chart and pie charts showing the number and proportion of genes assigned to each category defined by MitoCarta 3.0. (D) Venn diagram showing the number of the identified MRPs with downregulated expression patterns over time in each cellular senescence model. Gene symbols of commonly downregulated MRPs in both models are shown in the yellow-colored box. (E) Mean gene expression of commonly downregulated MRPs are shown for RS (left) and OS (right).
Figure 3
Figure 3
Early MRP downregulation is associated with mitochondrial dysfunction and gain of early senescence phenotypes. (AF) RS was developed using primary HDFs, as described in Materials and Methods. (A) Time-series Western blot analysis of HDF-RS. Quantifications of three independent experiments are presented in Supplementary Figure S2. Representative blot images are shown. (B) Cell size increase in suspended cells was estimated by flowcytometric analysis of forward scattering (FSC). Representative FSC patterns are shown in the right panel. (C) Cell granularity increase was estimated by side scattering (SSC) analysis. Representative SSC patterns are shown in the right panel. (D) Western blots of time-series RS of primary HDF. (E) Mitochondrial ROS levels of the cells were monitored by MitoSox staining followed by flow cytometric analysis. Representative fluorescence shift is shown (right panel). **, p < 0.01 vs. DT2 by Student’s t-test in (B,C,E). (F) SA-β-gal activity. Representative image (upper) and quantification (lower). (G,H) HDF-OS model was developed by H2O2 treatment, as described in Materials and Methods. Cellular responses to different doses of H2O2 are shown. (G) Western blots of the HDF-OS model. Quantifications of three independent experiments are presented in Supplementary Figure S3. Representative blot images are shown. (H) SA-β-gal activity. **, p < 0.01 vs. C by Student’s t-test.
Figure 4
Figure 4
Mitoribosome perturbation induces mitochondrial ROS generation and senescence. (AD) HDF (DT2) was treated with the indicated doses of chloramphenicol (CAP), a specific mitoribosome inhibitor. DMSO was used as a vehicle (V) for CAP. (A) Western blots. Representative blot images and their quantified values are shown. (B) Cell growth. (C) SA-β-gal activity. **, p < 0.01 vs. V (0.4%) by Student’s t-test in (B,C). (D) Western blots. Representative blot images and their quantified values are shown. (EK) HDF (DT2) was individually transfected with siRNAs for the indicated MRPs for 4 days. For the negative control (NC), a siRNA with a random sequence was used. (E) Western blots. Representative blot images and their quantified values are shown. (F) SA-β-gal activity. (G) Cell growth. (H) Cell size (FSC). (I) Cell granularity (SSC). (J) Mitochondrial ROS (MitoSOX staining). **, p < 0.01 vs. NC by Student’s t-test in (FJ). (K) Mitochondrial translation activity. To selectively monitor mitochondrial translation activity, emetine (a cytosolic translation inhibitor) and homopropargylglycine (HPG—a tracer of nascent protein synthesis) were used as described in Materials and Methods. A representative image of protein translation activities for total, cytosol (Cyto), and mitochondria (Mito) is shown in the left panel and selective mitochondrial translation activities after the individual knockdown of the three MRPs are shown in the right panel.
Figure 5
Figure 5
TPP1 expression decreases from the M stage of RS and its suppression induces senescence, accompanied by telomere DNA damage. (A) Relative telomere length of HDFs at early (E) and middle (M) stages of HDF-RS was estimated, as described in Materials and Methods. **, p < 0.01 vs. DT2 by Student’s t-test. (B) Schematic structure of shelterin complex. (C) Expression heatmap of TERT (telomerase) and shelterin complex genes in RS and OSIS was obtained from our previous time-series transcriptomic data (GSE41714 and GSE80322). (D) Messenger RNA levels of HDFs at the indicated DT of RS model by qPCR analysis. HDFs with two different cell population doubling (PD32 and PD35) were used for DT2. **, p < 0.01 and *, p < 0.05 vs. DT2 (PD32) by Student’s t-test. (E) Western blots of time-series HDF-RS. Representative blot images and their quantified values are shown. (FJ) HDF (DT2) was individually transfected with siRNAs for the target genes for 4 days. (F) Western blot. Representative blot images and their quantified values are shown. (G) SA-β-gal activity. **, p < 0.01 and *, p < 0.05 vs. NC by Student’s t-test. (H) Telomere length analysis. (I) Western blot. Representative blot images and their quantified values are shown. (J) Telomere dysfunction-induced focus (TIF), a co-localized focus of telomere (green), and 53BP1 (red) were visualized by IF–FISH, as described in Materials and Methods. DAPI (blue) staining was used to visualize nuclei. Quantifications of the TIFs are presented in Supplementary Figure S4A.
Figure 6
Figure 6
SA-MRP deregulation plays a role as an upstream regulator of TPP1 suppression. (A,B) HDFs (DT2) were transfected with siRNAs against targets (TPP1 and POT1) for 4 days. (A) Western blots. Representative blot images and their quantified values are shown. (B) Messenger RNA levels by qPCR 4 days after individual knockdown of TPP1 and POT1. **, p < 0.01 vs. NC by Student’s t-test. (CG) HDFs (DT2) were transfected with siRNAs against target MRPs for 4 days. (C) Western blots. Representative blot images and their quantified values are shown. (D) Messenger RNA levels (qPCR) 4 days after individual knockdown of MRPS9, MRPS15, and MRPS31. **, p < 0.01 and *, p < 0.05 vs. NC by Student’s t-test. (E) Relative telomere length. (F) Telomere dysfunction-induced focus (TIF), a co-localized focus of telomere (green) and 53BP1 (red) was visualized by IF–FISH, as described in Materials and Methods. DAPI (blue) staining was used to visualize nuclei. Quantifications of the merged images are presented in Supplementary Figure S4B. (G) Western blot. Representative blot images and their quantified values are shown. (H,I) HDF (DT2) was exposed to CAP (200 μg/mL) for the indicated periods. (H) Western blots. Representative blot images and their quantified values are shown. (I) Quantitative RT-PCR. **, p < 0.01 and *, p < 0.05 vs. NC by Student’s t-test. (J) Western blot analysis after HDF (M stage, PD63 and DT3) was transfected with the pCMV6-ACD-AC-GFP plasmid for 2 days. Representative blot images and their quantified values are shown. (A,C,H) arrow indicated POT1 band.
Figure 7
Figure 7
Validation of SA-MRP deregulation in aged human cells and aging mouse/rat skin tissues. (AC) Expression heatmaps of SA-MRPs and shelterin genes in human primary (A) skin fibroblasts, and mouse (B) dermal fibroblasts and (C) skin tissues. The mouse genome has two POT1 orthologs, Pot1a and pot1b. The Welch t-test p-values are shown in each right panel. (D) Venn diagram showing the number of identified MRPs with downregulated expression patterns in aged samples in each analyzed dataset. Gene symbols of the 15 shared SA-MRPs in all human and mouse cells and tissues employed in this study are shown in the box. (E) Messenger RNA levels (qPCR) of target genes using aging mouse skin tissues. **, p < 0.01 and *, p < 0.05 vs. 4 m by Student’s t-test. (F) Messenger RNA levels (qPCR) of target genes using aging rat skin tissues. *, p < 0.05 vs. 6 m by Student’s t-test.
Figure 8
Figure 8
Single-cell RNA-seq analysis identifies distinct cell clusters with unique expression profiles of MRPs and shleterin genes associated with senescence. (A) Identification of highly variable features in scRNA-seq data derived from aging mouse dermal fibroblasts (GSE111136). (B) Distribution of p-values for each PC with a uniform distribution (dashed line) showing significant PCs. (C) Uniform manifold approximation and projection (UMAP) plots depicting cells of different Seurat-defined cell clusters (left) and ages (right). (D) Stacked bar charts showing the number and proportion of cells assigned to Seurat-defined cell clusters. (E) Expression heatmaps of the top 10 genes for each sample (young and old) in C3 (top) and C4 cells (bottom) only. (F) Dot plot showing top GO terms enriched in each cell group. (G) Expression heatmaps and (H) mean expression (±SD) of the 47 mouse SA-MRPs, 15 SA-MRP genes, shelterin complex, Acd, and senescence markers (Cdkn1a for p21 and Cdkn2a for p16). Kruskal–Wallis chi-squared p-values (p) are shown. N refers to the number of genes analyzed. Of the 51 SA-MRPs, Mrps16, Mrps37, Mrps30, and Mrps27 are missing in the filtered dataset.

Similar articles

Cited by

References

    1. Harman D. The Free Radical Theory of Aging: Effect of Age on Serum Copper Levels. J. Gerontol. 1965;20:151–153. doi: 10.1093/geronj/20.2.151. - DOI - PubMed
    1. Raha S., Robinson B.H. Mitochondria, oxygen free radicals, disease and ageing. Trends Biochem. Sci. 2000;25:502–508. doi: 10.1016/S0968-0004(00)01674-1. - DOI - PubMed
    1. Green D.R., Galluzzi L., Kroemer G. Mitochondria and the autophagy-inflammation-cell death axis in organismal aging. Science. 2011;333:1109–1112. doi: 10.1126/science.1201940. - DOI - PMC - PubMed
    1. Wallace D.C. Mitochondria and cancer. Nat. Rev. Cancer. 2012;12:685–698. doi: 10.1038/nrc3365. - DOI - PMC - PubMed
    1. Rath S., Sharma R., Gupta R., Ast T., Chan C., Durham T.J., Goodman R.P., Grabarek Z., Haas M.E., Hung W.H.W., et al. MitoCarta3.0: An updated mitochondrial proteome now with sub-organelle localization and pathway annotations. Nucleic Acids Res. 2021;49:D1541–D1547. doi: 10.1093/nar/gkaa1011. - DOI - PMC - PubMed

Publication types

Substances

LinkOut - more resources