. 2022 Jun 21;23(13):6883.
doi: 10.3390/ijms23136883.

A Novel Mouse Model of TGFβ2-Induced Ocular Hypertension Using Lentiviral Gene Delivery

Affiliations

A Novel Mouse Model of TGFβ2-Induced Ocular Hypertension Using Lentiviral Gene Delivery

Shruti V Patil et al. Int J Mol Sci. .

Abstract

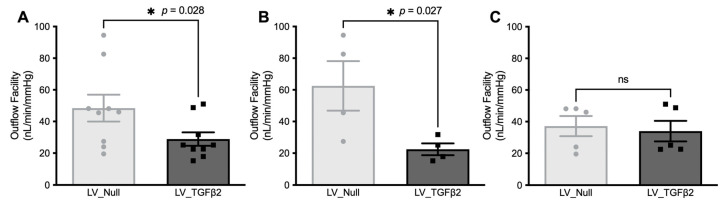
Glaucoma is a multifactorial disease leading to irreversible blindness. Primary open-angle glaucoma (POAG) is the most common form and is associated with the elevation of intraocular pressure (IOP). Reduced aqueous humor (AH) outflow due to trabecular meshwork (TM) dysfunction is responsible for IOP elevation in POAG. Extracellular matrix (ECM) accumulation, actin cytoskeletal reorganization, and stiffening of the TM are associated with increased outflow resistance. Transforming growth factor (TGF) β2, a profibrotic cytokine, is known to play an important role in the development of ocular hypertension (OHT) in POAG. An appropriate mouse model is critical in understanding the underlying molecular mechanism of TGFβ2-induced OHT. To achieve this, TM can be targeted with recombinant viral vectors to express a gene of interest. Lentiviruses (LV) are known for their tropism towards TM with stable transgene expression and low immunogenicity. We, therefore, developed a novel mouse model of IOP elevation using LV gene transfer of active human TGFβ2 in the TM. We developed an LV vector-encoding active hTGFβ2C226,228S under the control of a cytomegalovirus (CMV) promoter. Adult C57BL/6J mice were injected intravitreally with LV expressing null or hTGFβ2C226,228S. We observed a significant increase in IOP 3 weeks post-injection compared to control eyes with an average delta change of 3.3 mmHg. IOP stayed elevated up to 7 weeks post-injection, which correlated with a significant drop in the AH outflow facility (40.36%). Increased expression of active TGFβ2 was observed in both AH and anterior segment samples of injected mice. The morphological assessment of the mouse TM region via hematoxylin and eosin (H&E) staining and direct ophthalmoscopy examination revealed no visible signs of inflammation or other ocular abnormalities in the injected eyes. Furthermore, transduction of primary human TM cells with LV_hTGFβ2C226,228S exhibited alterations in actin cytoskeleton structures, including the formation of F-actin stress fibers and crossed-linked actin networks (CLANs), which are signature arrangements of actin cytoskeleton observed in the stiffer fibrotic-like TM. Our study demonstrated a mouse model of sustained IOP elevation via lentiviral gene delivery of active hTGFβ2C226,228S that induces TM dysfunction and outflow resistance.

Keywords: TGFβ2; intraocular pressure; lentiviruses; rodent mouse models of ocular hypertension; trabecular meshwork.


Conflict of interest statement

The authors declare no conflict of interest.

Figures

Figure 1
Figure 1
Schematic representation of experimental design for intravitreal injections of LV_TGFβ2. Baseline IOP was measured in 4 months old C57BL/6J mice, and a single intravitreal injection of LV_TGFβ2 in one eye and LV_Null in the contralateral eyes were performed. IOPs were monitored weekly, and the outflow facility was measured 8 weeks post-injection. After 7 to 8 weeks of injections, the PERG was measured, and mice were sacrificed to analyze RGC loss. Anterior segment or AH samples were isolated to further analyze TGFβ2 levels. LV—lentivirus; TGFβ2—transforming growth factor beta-2; CMV—cytomegalovirus promoter; IOP—intraocular pressure; PERG—pattern electroretinogram; AH—aqueous humor; RGC—retinal ganglion cells.
Figure 2
Figure 2
LV exhibits specific tropism for TM in mice. (A) C57BL/6J mice eye intravitreally injected with LV_CMV_eGFP (2 × 10⁶ TU/2 μL/eye bolus; n = 3) showed tropism towards the iridocorneal angle of the anterior chamber (representative image shown; scale 50 μm). The LVs induced substantial eGFP expression primarily in the TM region (represented by white arrows) post 3 weeks of injections. (B) Anterior segment section of contralateral un-injected eye showing no eGFP expression or background in the iridocorneal region. TM—trabecular meshwork; SC—Schlemm’s canal; CB—ciliary body; C—cornea; I—iris.
Figure 3
Figure 3
C57BL/6J mice developed ocular-hypertension when intravitreally injected with LV_TGFβ2 constructs. Intravitreal injections of LV_Null (control) and LV_TGFβ2 vectors (n = 10 each) were administered in contralateral eyes of C57BL/6J male mice following baseline IOP measurements. Weekly monitoring of daytime-conscious IOPs showed significant and sustained IOP elevation ((A), combined) 3 weeks post-injections. Mice with LV_TGFβ2-induced IOPs showing Δ change of >2.5 mmHg (B) were segregated from mice observed with no IOP elevation (C). Repeated measures two-way ANOVA with Bonferroni post-hoc analysis, data represented as mean ± SEM, * p < 0.05, ** p < 0.01, *** p < 0.001. (Δ—delta change).
Figure 4
Figure 4
LV_TGFβ2 vectors caused IOP elevation in BALB/cJ mice. Conscious daytime IOPs were monitored weekly on BALB/cJ mice (n = 10) intravitreally injected with LV_Null and LV_TGFβ2 vectors in contralateral eyes. Baseline IOP was measured before injections (0 weeks) to ensure that each mouse had normal IOP before treatment. IOP was significantly elevated in LV_TGFβ2 eyes starting 3 weeks of injections ((A), combined). The (B) mice with Δ IOP change of >2.5 mmHg were separated from mice (C) with very low IOP elevation. Repeated measures two-way ANOVA with Bonferroni post-hoc analysis, data represented as mean ± SEM, * p < 0.05, **** p < 0.0001.
Figure 5
Figure 5
LV_TGFβ2 intravitreal injections decreased aqueous outflow facility in C57BL/6J mice. One eye of each mouse was injected with the TGFβ2C226/228S-expressing lentiviral vector (black squares), while the contralateral eye was injected with the Null-lentiviral vector (gray circles; n = 10; same cohort as Figure 3). AH outflow facility was evaluated on both eyes at 7 weeks after injection for mice with significant IOP elevation (n = 5) (B) and at 8 weeks after injection for mice with no IOP elevation (n = 5) (C). Mice were segregated based on individual assessment of elevated IOP measurements (refer to Figure 3). (A) The combined effect of all mice (n = 10). Paired (one-tailed) student t-test, data represented as mean ± SEM.
Figure 6
Figure 6
Effect of lentiviral infection on ocular structures of mice anterior segments. Contralateral eyes of C57BL/6J mice were intravitreally injected with LV_Null and LV_TGFβ2 vectors. (A) Representative hematoxylin and eosin (H&E) staining image of fixed and paraffin sectioned eyes, 9 weeks post-injections (n = 5; scale 50 μm). Average IOP measured for LV_Null was 14.12 mmHg (day) or 18.04 mmHg (dark; refer to Figure S1), and for LV_TGFβ2 was 18.23 mmHg (day) or 23.16 mmHg (dark). (B) Representative slit-lamp images of the anterior segments to determine immunogenicity and corneal edema. (C) Ophthalmoscopy scoring on an ordinal scale for lenticular cataract in C57BL/6J mice, n = 10 (same mice cohorts as described in Figure 3). No hyperemia was observed in these mice throughout the course of the experiment (data not shown). Repeated measures two-way ANOVA with Bonferroni post-hoc analysis, data represented as mean ± SEM.
Figure 7
Figure 7
Intravitreally-delivered LV_TGFβ2-induced active TGFβ2 expression in anterior segments of injected eyes. Contralateral eyes of C57BL/6J mice were intravitreally injected with LV_Null (gray circles) and LV_TGFβ2 (black squares) vectors. (A) Western blot of AH samples collected 11 weeks post-injection from mouse anterior chamber and (B,C) their quantitative analysis normalized to Ponceau-S stain (n = 5). (C) Represents a significant increase in active TGFβ2 expression in eyes, showing > 2.5 mmHg of increase in IOP (n = 3). (D) Correlation of week 10 post-injection IOP with week 11 post-injection TGFβ2 relative density in AH (Pearson correlation). (E) Representative immunostaining image of fixed and paraffin sectioned eyes, 8 weeks post-injections (n = 5; scale 75 μm). The quantitative analysis of (F,G) TGFβ2 and (I,J) alpha smooth muscle actin (αSMA) intensity in the TM region only (represented by white arrows). (G) TGFβ2 and (J) αSMA expression in mice with significant IOP elevation (n = 3; refer to Figure S1 for IOP data). (H,K) Correlation of week 8 post-injection IOP with week 9 post-injection (H) TGFβ2 or (K) αSMA fluorescent intensity in anterior tissue (Pearson correlation). (D,H,K) Black square data points represent LV_TGFβ2-injected eyes (n = 5), and gray circles represent LV_Null eyes (n = 5). Paired (one-tailed) student t-test, data represented as mean ± SEM. TM—trabecular meshwork; SC—Schlemm’s canal; CB—ciliary body; C—cornea; I—iris; R—retina.
Figure 7
Figure 7
Intravitreally-delivered LV_TGFβ2-induced active TGFβ2 expression in anterior segments of injected eyes. Contralateral eyes of C57BL/6J mice were intravitreally injected with LV_Null (gray circles) and LV_TGFβ2 (black squares) vectors. (A) Western blot of AH samples collected 11 weeks post-injection from mouse anterior chamber and (B,C) their quantitative analysis normalized to Ponceau-S stain (n = 5). (C) Represents a significant increase in active TGFβ2 expression in eyes, showing > 2.5 mmHg of increase in IOP (n = 3). (D) Correlation of week 10 post-injection IOP with week 11 post-injection TGFβ2 relative density in AH (Pearson correlation). (E) Representative immunostaining image of fixed and paraffin sectioned eyes, 8 weeks post-injections (n = 5; scale 75 μm). The quantitative analysis of (F,G) TGFβ2 and (I,J) alpha smooth muscle actin (αSMA) intensity in the TM region only (represented by white arrows). (G) TGFβ2 and (J) αSMA expression in mice with significant IOP elevation (n = 3; refer to Figure S1 for IOP data). (H,K) Correlation of week 8 post-injection IOP with week 9 post-injection (H) TGFβ2 or (K) αSMA fluorescent intensity in anterior tissue (Pearson correlation). (D,H,K) Black square data points represent LV_TGFβ2-injected eyes (n = 5), and gray circles represent LV_Null eyes (n = 5). Paired (one-tailed) student t-test, data represented as mean ± SEM. TM—trabecular meshwork; SC—Schlemm’s canal; CB—ciliary body; C—cornea; I—iris; R—retina.
Figure 8
Figure 8
LV_TGFβ2 transduction induced extracellular matrix (ECM) and cytoskeletal alterations in primary human TM cells. Primary human TM cells were treated with 5 MOI viral load of LV_Null (gray circles) and LV_TGFβ2 (black squares) vectors and incubated for 11 days (n = 2 responder strain, representative images shown). (A) Active TGFβ2 levels were determined in conditioned media of the transduced cells. The total protein loading was determined via Coomassie staining of the PVDF membrane. (B) TGFβ2, ECM markers (fibronectin (FN) and collagen-I (Col-I)) (scale 75 μm), and (C) cytoskeletal changes (αSMA and F-actin) were also determined via immunostaining (scale 25 μm). LV_TGFβ2-induced expression of all the markers with morphological changes in the cells that included the formation of cross-linked actin networks (CLANs; marked within white circles) and F-actin stress fibers as depicted via phalloidin staining. (D) Quantitative analysis of FN Col-I, αSMA, and phalloidin staining from at least 6 different non-overlapping regions of the treated wells. Paired (one-tailed) student t-test, data represented as mean ± SEM, ** p < 0.01, *** p < 0.001, **** p < 0.0001.

References

    1. Jonas J.B., Aung T., Bourne R.R., Bron A.M., Ritch R., Panda-Jonas S. Glaucoma. Lancet. 2017;390:2183–2193. doi: 10.1016/S0140-6736(17)31469-1. - DOI - PubMed
    1. Quigley H.A., Broman A.T. The number of people with glaucoma worldwide in 2010 and 2020. Br. J. Ophthalmol. 2006;90:262–267. doi: 10.1136/bjo.2005.081224. - DOI - PMC - PubMed
    1. Friedman D.S., Wolfs R.C., O’Colmain B.J., Klein B.E., Taylor H.R., West S., Leske M.C., Mitchell P., Congdon N., Kempen J., et al. Prevalence of open-angle glaucoma among adults in the United States. Arch. Ophthalmol. 2004;122:532–538. doi: 10.1001/archopht.122.4.532. - DOI - PMC - PubMed
    1. Weinreb R.N., Leung C.K., Crowston J.G., Medeiros F.A., Friedman D.S., Wiggs J.L., Martin K.R. Primary open-angle glaucoma. Nat. Rev. Dis. Primers. 2016;2:16067. doi: 10.1038/nrdp.2016.67. - DOI - PubMed
    1. Rosenthal J., Leske M.C. Open-angle glaucoma risk factors applied to clinical area. J. Am. Optom. Assoc. 1980;51:1017–1024. - PubMed

LinkOut - more resources