. 2022 Jul 3;23(13):7402.
doi: 10.3390/ijms23137402.

Transcriptomic and Metabolomic Analysis of Quality Changes during Sweet Cherry Fruit Development and Mining of Related Genes

Affiliations

Transcriptomic and Metabolomic Analysis of Quality Changes during Sweet Cherry Fruit Development and Mining of Related Genes

Chaoqun Chen et al. Int J Mol Sci. .

Abstract

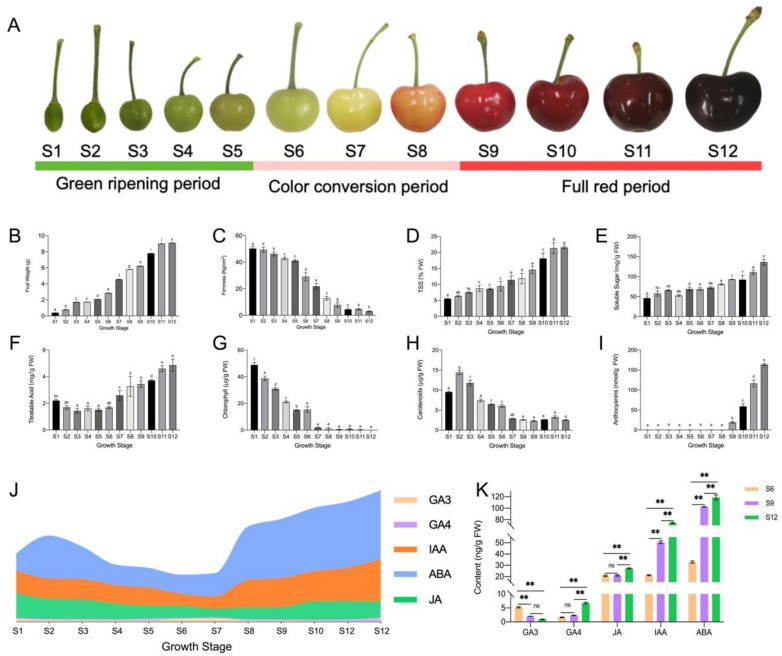
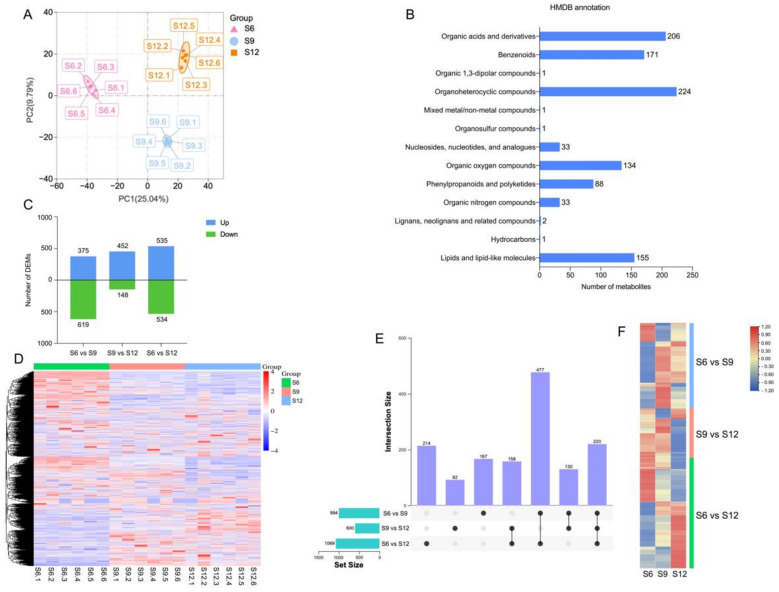
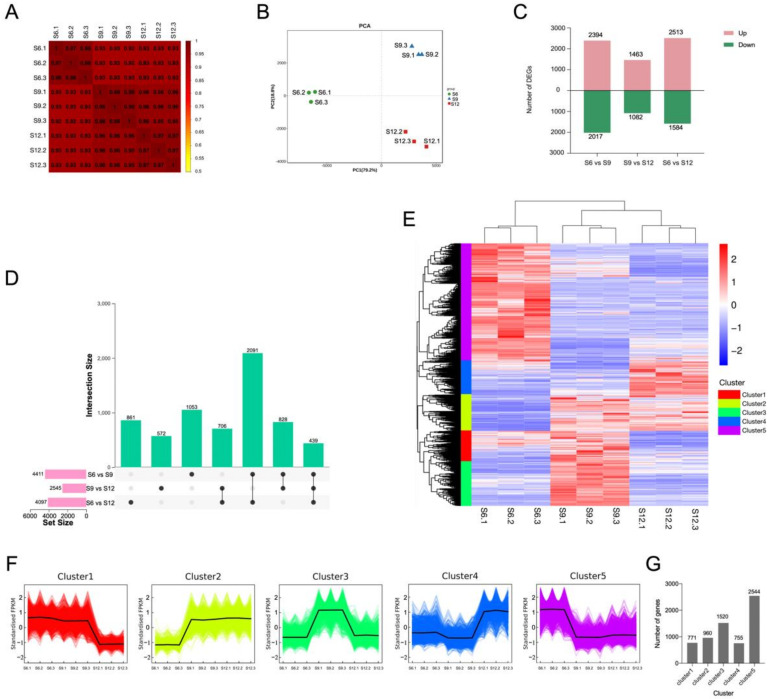
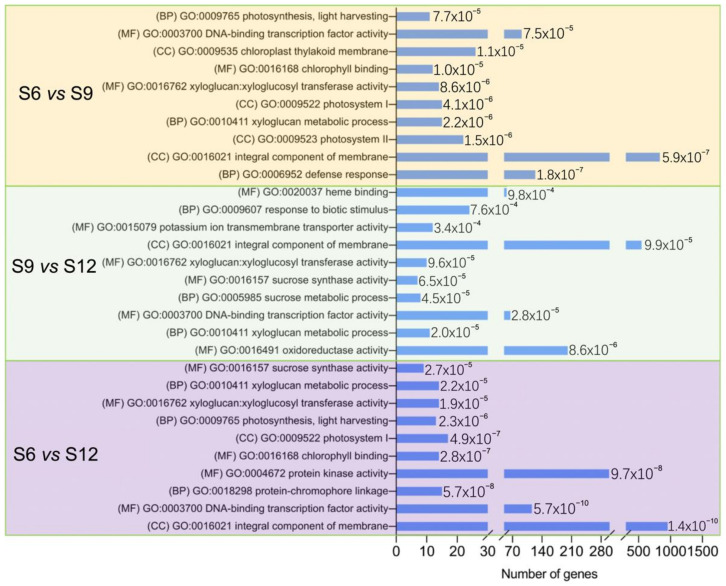
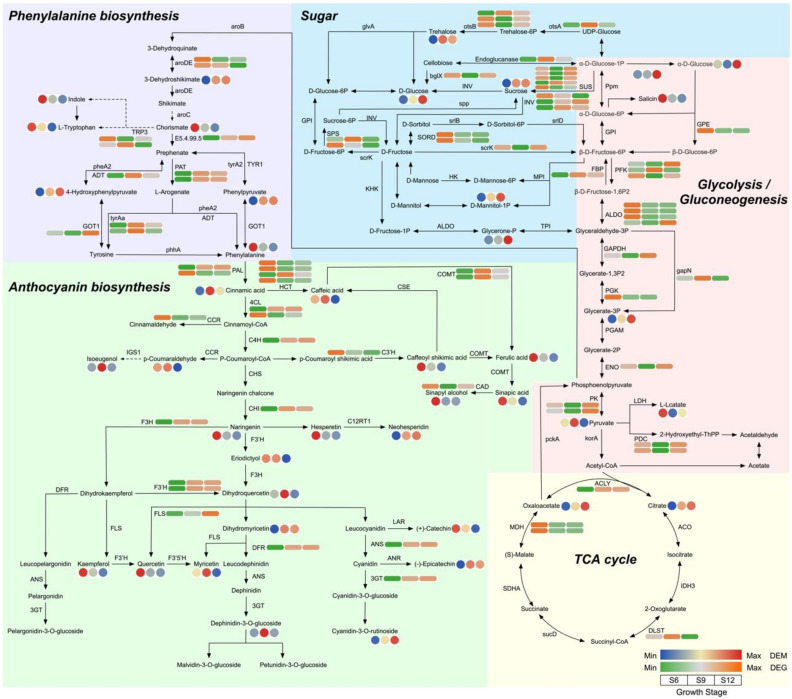
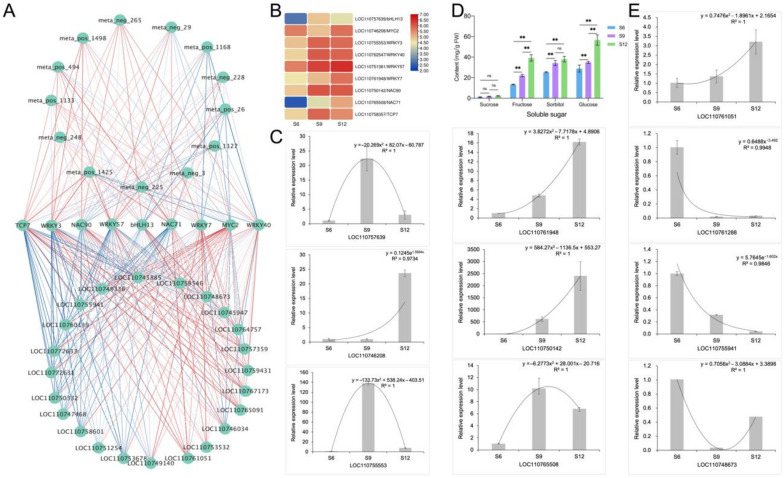
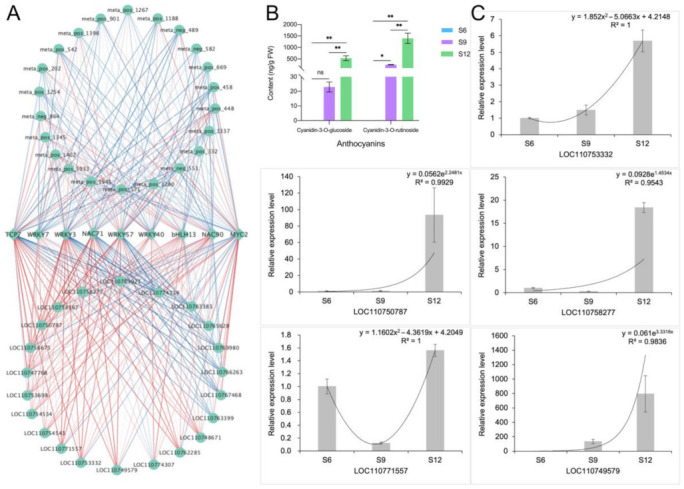
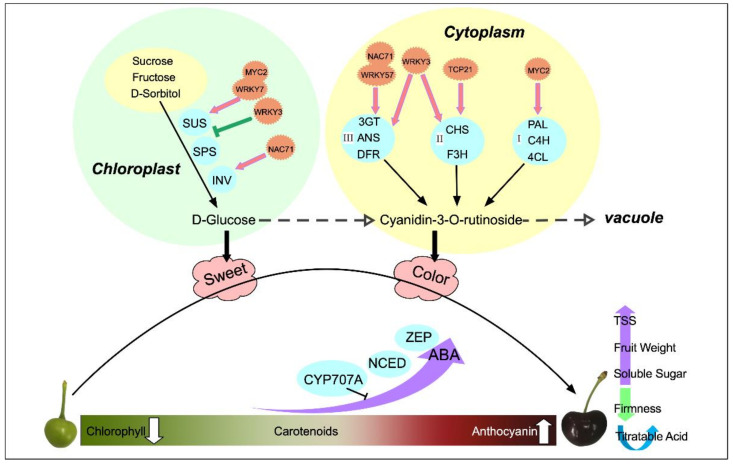
Sweet cherries are economically important fruit trees, and their quality changes during development need to be determined. The mechanism of fruit quality changes in sweet cherries were determined by analyzing sweet cherry fruits at 12 developmental stages. The results showed that the soluble sugar, anthocyanin content, and hormones of sweet cherries all changed drastically during the color transition. Therefore, the fruits at the beginning of color conversion, at the end of color conversion, and at the ripening state were selected for the comprehensive analysis of their metabolome and transcriptome. Different sugars, such as D-glucose, sucrose, and trehalose, were identified in the metabolome. Dihydroquercetin, delphinidin-3-glucoside, cyanidin-3-rutincoside, and other flavonoid species were also identified. D-glucose and cyanidin-3-rutinoside were among the most important components of sweet cherry soluble sugars and anthocyanins, respectively. The transcriptional analysis identified key structural genes and nine transcription factors involved in the ABA, sugar, organic acid, and anthocyanin synthesis pathways, with the following specific regulatory patterns. NAC71, WRKY57, and WRKY3 regulate fruit sugar accumulation mainly by acting on INV, SPS, and SUS. MYC2 is involved in the synthesis of anthocyanin precursors by activating PAL and C4H, whereas TCP7 mainly regulates CHI and F3H. WRKY3, NAC71, and WRKY57 have important positive regulatory significance on anthocyanin accumulation, mainly by activating the expression of DFR, ANS, and 3GT.

Keywords: fruit development; metabolome; quality formation; sweet cherry; transcriptome.


Conflict of interest statement

The authors declare no conflict of interest.

Figures

Figure 1
Figure 1
Changes in fruit quality and endogenous hormones during the development of sweet cherries. (A) Fruit growth and development status diagram; (B) single fruit weight, in which different lowercase letters indicate significant differences (p ≤ 0.05), the same below; (C) fruit firmness; (D) fruit soluble solids (TSS) content; (E) fruit soluble sugar content; (F) fruit titratable acid content; (G) fruit chlorophyll content; (H) fruit carotenoid content; (I) fruit anthocyanin content; (J) hormone profile during fruit development; (K) the specific changes in fruit endogenous hormones in the three periods of S6, S9, and S12, where ns means insignificant, and ** indicates an extremely significant correlation at the 0.01 level.
Figure 2
Figure 2
Metabolome analysis of sweet cherries during development. (A) PCA analysis of metabolites at each developmental stage; (B) HMDB classification annotation of metabolites; (C) the number of DEMs compared at any two different developmental stages; the number of upregulated and downregulated metabolites is represented by the bars above and below the x-axis, respectively; (D) heatmap of all DEMs at three developmental stages, with colors indicating the relative level content of each DEM, from low (purple) to high (red); (E) upset plots of ubiquitously and exclusively expressed DEMs in pairwise comparisons across developmental stages; (F) heatmap of expression patterns of unique DEMs in the three comparison groups, with different colors representing the relative level content of each DEM, from low (blue) to high (red).
Figure 3
Figure 3
Transcriptome analysis of sweet cherries during development. (A) Spearman correlation coefficients of gene expression at different developmental stages; (B) PCA analysis of gene expression at each developmental stage; (C) the number of DEGs compared at any two different developmental stages; the number of upregulated and downregulated genes are represented by the bars above and below the x-axis, respectively; (D) upset plots of ubiquitously and exclusively expressed DEGs in pairwise comparisons across developmental stages; (E) hierarchical clustering of DEGs for all samples; (F) K-means clustering of DEGs expression trends, the expression profiles of genes in each cluster are represented in different colors, and the average expression profiles of all genes in each sample are represented in black; (G) summary of K-means clustering results, the specific number of DEGs contained in each cluster.
Figure 4
Figure 4
GO enrichment analysis of DEGs between groups was compared. The figure shows the top 10 rich items with extremely significant (≤0.05) p-values for each comparison, and the values of the p-values are shown in the bar chart. (BP): biological process; (MF): molecular function; (CC): cellular component.
Figure 5
Figure 5
Analysis of transcription factors in different developmental stages of sweet cherries. (A) Statistical summary of transcription factor families; the number and proportion of each transcription factor family are displayed in a bar chart; (B) heat map of transcription factor expression patterns. The FPKM values of transcription factors were transformed according to log2.
Figure 6
Figure 6
Annotation analysis of KEGG pathway in different developmental stages of sweet cherries. (A) KEGG-enriched top 10 pathway analysis of DEGs between each comparison group. Select differential genes with p-values ≤ 0.5 for KEGG enrichment analysis; (B) association analysis of each pathway. Different dots indicate different metabolic pathways: gray indicates pathways that were associated with pathways but not enriched in the top 30 or not enriched; purple indicates pathways that were enriched into the top 30 at least in one set of comparison groups; blue circles indicate pathways that were enriched in the top 30 and more closely linked, at least in one comparison group. The bars in the blue circles represent the number of DEMs and DEGs in three different developmental stages, respectively, red represents the number of DEGs contained in the pathway, and blue represents the number of DEMs in the pathway.
Figure 7
Figure 7
ABA synthesis pathway and gene expression analysis. (A) Schematic representation of the core pathway of ABA biosynthesis. The circle heat map represents the expression of DEMs in the three developmental stages, and the square heat map represents the expression of DEGs in the three developmental stages. (B) qRT-PCR analysis of ABA biosynthesis-related genes.
Figure 8
Figure 8
Metabolic pathway analysis centered on glycolysis/gluconeogenesis. The circle and square heatmaps represent the expression of DEMs and DEGs at three developmental stages, respectively.
Figure 9
Figure 9
Identification and validation of glucose metabolism-related networks. (A) Correlation network identification of 9 transcription factors with DEMs and DEGs related to sugar anabolism. Correlations are represented by blue and red lines from low to high. (B) Expression patterns of 9 transcription factors, transformed according to log2 to FPKM values of transcription factors, with colors indicating the relative content of each transcription factor, from low (blue) to high (red). (C) qRT-PCR analysis of 6 transcription factors. (D) Composition and content of soluble sugars in different developmental stages of sweet cherries. ns means not significant, ** means extremely significant correlation at the 0.01 level; (E) qRT-PCR analysis of four sugar anabolic genes.
Figure 10
Figure 10
Identification and validation of anthocyanin synthesis correlation network. (A) Correlation network identification of 9 transcription factors and anthocyanin synthesis-related DEMs and DEGs. Correlations are represented by blue and red lines from low to high. (B) Composition and content of anthocyanins in different developmental stages of sweet cherries. ns means not significant, * indicates significant correlation at the 0.05 level, ** indicates extremely significant correlation at the 0.01 level; (C) qRT-PCR analysis of 5 anthocyanin synthesis-related genes.
Figure 11
Figure 11
Schematic diagram of quality changes and regulation during the natural development of sweet cherries.

References

    1. Acero N., Gradillas A., Beltran M., García A., Mingarro D.M. Comparison of phenolic compounds profile and antioxidant properties of different sweet cherry (Prunus avium L.) varieties. Food Chem. 2019;279:260–271. doi: 10.1016/j.foodchem.2018.12.008. - DOI - PubMed
    1. Valero D., Serrano M. Growth and ripening stage at harvest modulates postharvest quality and bioactive compounds with antioxidant activity. Stewart Postharvest Rev. 2013;3:1–8. doi: 10.2212/spr.2013.3.7. - DOI
    1. Kader A.A. Fruit maturity, ripening, and quality relationships. International Symposium Effect of Pre-& Postharvest Factors in Fruit Storage. Acta Hortic. 1999;485:203–208. doi: 10.17660/ActaHortic.1999.485.27. - DOI
    1. Alonso M.A.S., Paquin J.P., Mangin J.P.L. Modelling perceived quality in fruit products: Their extrinsic and intrinsic attributes. J. Food Prod Mark. 2002;8:29–48. doi: 10.1300/J038v08n01_03. - DOI
    1. Calle A., Wünsch A. Multiple-population QTL mapping of maturity and fruit-quality traits reveals LG4 region as a breeding target in sweet cherry (Prunus avium L.) Hortic. Res. 2020;7:127. doi: 10.1038/s41438-020-00349-2. - DOI - PMC - PubMed

LinkOut - more resources