. 2022 Jul 5;23(13):7463.
doi: 10.3390/ijms23137463.

SPR-Based Detection of ASF Virus in Cells

Affiliations

SPR-Based Detection of ASF Virus in Cells

Alessandro Capo et al. Int J Mol Sci. .

Abstract

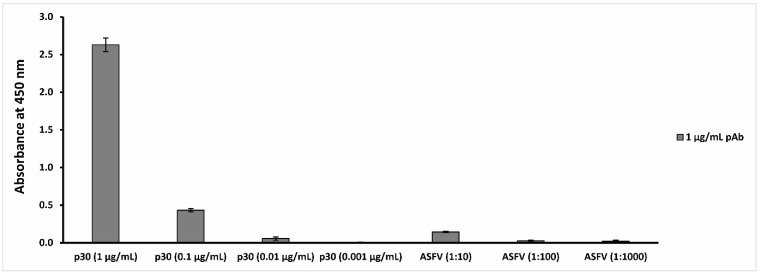
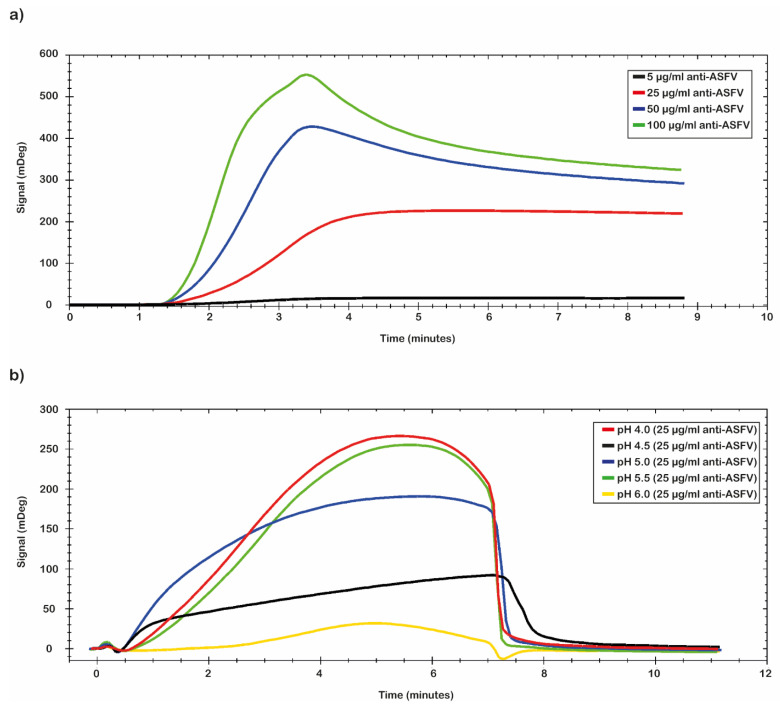
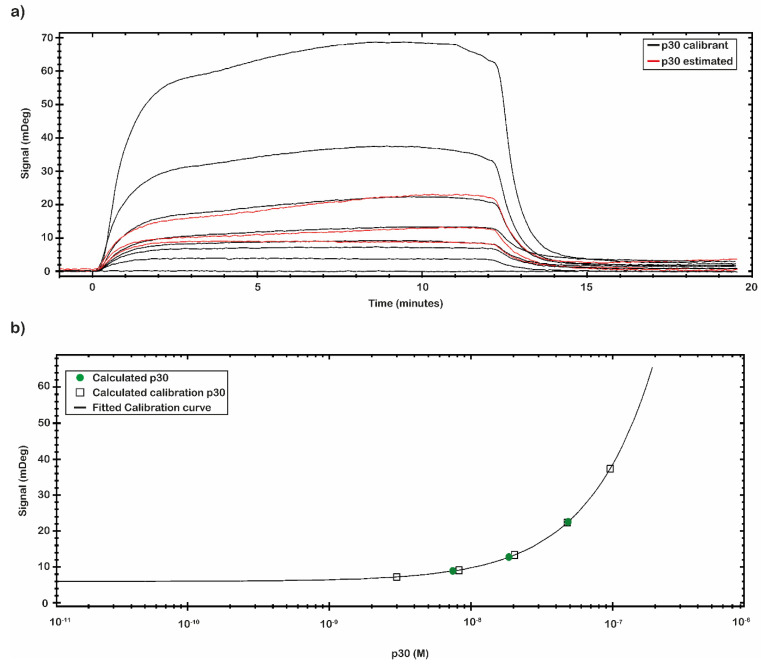
African swine fever (ASF) is one of the most dangerous hemorrhagic infectious diseases that affect domestic and wild pigs. Currently, neither a vaccine nor effective treatments are available for this disease. As regards the degree of virulence, ASFV strains can be divided into high, moderate, or low virulence. The main detection methods are based on the use of the polymerase chain reaction (PCR). In order to prevent an uncontrolled spread of ASF, new on-site techniques that can enable the identification of an early-stage disease are needed. We have developed a specific immunological SPR-based assay for ASFV antigen detection directly in liquid samples. The developed assay allows us to detect the presence of ASFV at the dose of 103 HAD50/mL.

Keywords: African swine fever virus (ASFV); antibody; detection; indirect ELISA test; surface plasmon resonance (SPR).


Conflict of interest statement

The authors declare no conflict of interest.

Figures

Figure 1
Figure 1
Anti-ASFV antibody binding capability evaluation. The figure reports the analysis of the results obtained by the indirect ELISA tests, in which p30 antigen was recognized up to 0.01 µg/mL, while the ASFV Pol19/54204 sample was recognized up to a 1:10 dilution.
Figure 2
Figure 2
Pre-concentration analysis. Sensorgrams of pre-concentration scouting analysis; (a) the best value was obtained with the 100 µg/mL of polyclonal anti-ASFV, and the pH scouting analysis (green); (b) the optimal conditions of binding were obtained with the buffer at pH 5.0 (blue).
Figure 3
Figure 3
Anti-ASFV immobilization procedure. Sensorgram of amine coupling immobilization procedure. Main steps are shown: (1) cleaning, (2) activation with EDC/NHS mixture, (3) injection and bound of polyclonal antibodies, (4) ester deactivations by ethanolamine capping, and (5) cleaning. Polyclonal anti-ASFVs were immobilized at 312 mDeg.
Figure 4
Figure 4
SPR assay setting up, kinetics and affinity analysis. (a) A complete kinetic analysis was performed with the recombinant antigen p30 in a nanomolar range (from 0.01 to 200 nM). Sensorgrams shows the binding of recombinant p30 pRec protein to anti-ASFV covalently immobilized on the sensor chip surface. All measurements were performed in 10 mM NaP pH 7.4 buffer at room temperature. (b) An affinity plot was obtained from the same set of collected data. The blue dots represent the values of the p30 pREC titration experiment performed by the SPR-based sensing system. mDeg values are plotted versus pRec concentration; the black curve shows a result of a non-linear fitting operation. The obtained KD, LOD, and Bmax values, calculated by TraceDrawer™ data analysis software, were respectively 5.04 × 10⁻⁷ ± (8.24 × 10⁻¹¹) M, 0.01 nM, and 239 ± (0.03) mDeg.
Figure 5
Figure 5
Concentration through calibration (CTC) analysis on p30 samples. (a) CTC analysis was performed with the recombinant antigens p30 in a nanomolar range from 0.01 to 200 nM (black line) that was used as calibrant, while another set of p30 samples was estimated (red line). All measurements were performed in 10 mM NaP pH 7.4 buffer at room temperature. (b) The mDeg values were plotted against the p30 calibrant sample concentration (black square) and fitted by a Four Parameter Eq Lo-Hi model. The obtained calibration curve (black line) was used to estimate the concentration of the second set of p30 analyzed samples (green circle).
Figure 6
Figure 6
SPR experiments with ASFV sample. (a) Concentration through calibration (CTC) analysis on ASFV Pol19/54204 samples. (b) CTC analysis was performed with the ASFV sample in a range from 0 to 1 × 10⁶ (HAD50/mL) (black line) that was used as the calibrant, while another set of ASFV Pol19/54204 samples was estimated (red line). All measurements were performed in 10 mM NaP pH 7.4 buffer at room temperature. (c) The mDeg values were plotted against the ASFV calibrant sample concentrations (black square) and fitted by a Four Parameter Eq Lo Hi model. The obtained calibration curve (black line) was used to estimate the concentration of the second set of ASFV samples analyzed (green circle).

References

    1. Alejo A., Matamoros T., Guerra M., Andrés G., Shisler J.L. A Proteomic Atlas of the African Swine Fever Virus Particle. J. Virol. 2018;92:e01293-18. doi: 10.1128/JVI.01293-18. - DOI - PMC - PubMed
    1. Revilla Y., Pérez-Núñez D., Richt J.A. African Swine Fever Virus Biology and Vaccine Approaches. Adv. Virus Res. 2018;100:41–74. doi: 10.1016/bs.aivir.2017.10.002. - DOI - PubMed
    1. Karger A., Pérez-Núñez D., Urquiza J., Hinojar P., Alonso C., Freitas F.B., Revilla Y., Le Potier M.F., Montoya M. An Update on African Swine Fever Virology. Viruses. 2019;11:864. doi: 10.3390/v11090864. - DOI - PMC - PubMed
    1. Chang H., Hua Q., Duan G. The Advancement on Molecular Biology of African Swine Fever Virus. Microbiol.-Beijing. 2007;34:572. doi: 10.13344/j.microbiol.china2007.03.044. - DOI
    1. Wang Y., Kang W., Yang W., Zhang J., Li D., Zheng H. Structure of African Swine Fever Virus and Associated Molecular Mechanisms Underlying Infection and Immunosuppression: A Review. Front. Immunol. 2021;12:715582. doi: 10.3389/fimmu.2021.715582. - DOI - PMC - PubMed