. 2022 Jun 22;27(13):4014.
doi: 10.3390/molecules27134014.

HDAC Inhibitory and Anti-Cancer Activities of Curcumin and Curcumin Derivative CU17 against Human Lung Cancer A549 Cells

Affiliations

HDAC Inhibitory and Anti-Cancer Activities of Curcumin and Curcumin Derivative CU17 against Human Lung Cancer A549 Cells

Narissara Namwan et al. Molecules. .

Abstract

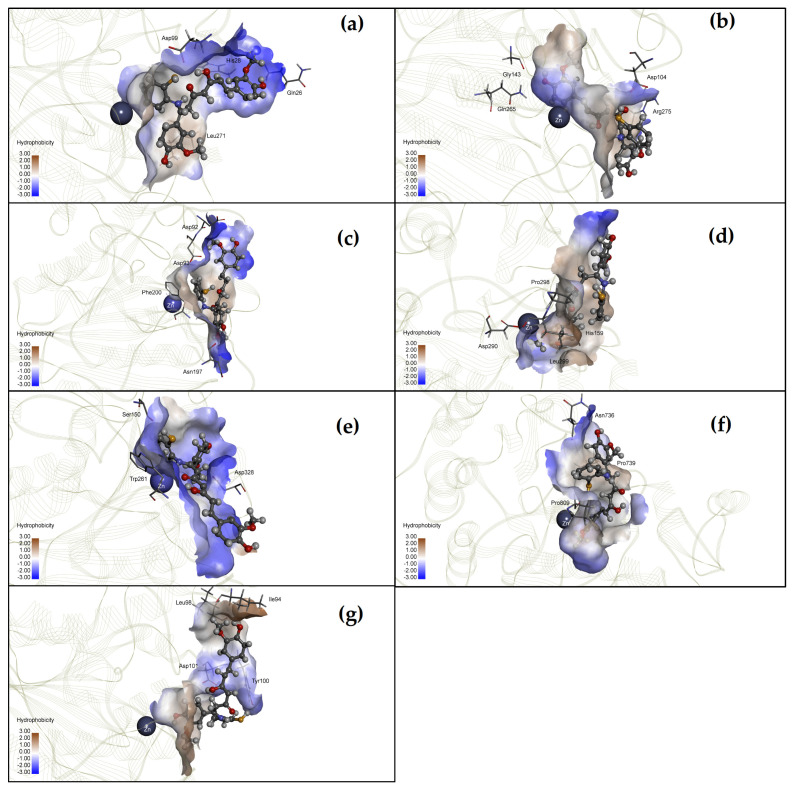
Previous research reported that the curcumin derivative (CU17) inhibited several cancer cell growths in vitro. However, its anticancer potential against human lung cancer cells (A549 cell lines) has not yet been evaluated. The purpose of this research was to examine the HDAC inhibitory and anti-cancer activities of CU17 compared to curcumin (CU) in A549 cells. An in vitro study showed that CU17 had greater HDAC inhibitory activity than CU. CU17 inhibited HDAC activity in a dose dependent manner with the half-maximal inhibitory concentration (IC50) value of 0.30 ± 0.086 µg/mL against HDAC enzymes from HeLa nuclear extract. In addition, CU17 could bind at the active pockets of both human class I HDACs (HDAC1, 2, 3, and 8) and class II HDACs (HDAC4, 6, and 7) demonstrated by molecular docking studies, and caused hyperacetylation of histone H3 (Ac-H3) in A549 cells shown by Western blot analysis. MTT assay indicated that both CU and CU17 suppressed A549 cell growth in a dose- and time-dependent manner. Besides, CU and CU17 induced G2/M phase cell cycle arrest and p53-independent apoptosis in A549 cells. Both CU and CU17 down-regulated the expression of p53, p21, Bcl-2, and pERK1/2, but up-regulated Bax expression in this cell line. Although CU17 inhibited the growth of lung cancer cells less effectively than CU, it showed less toxicity than CU for non-cancer cells. Accordingly, CU17 is a promising agent for lung cancer treatment. Additionally, CU17 synergized the antiproliferative activity of Gem in A549 cells, indicating the possibility of employing CU17 as an adjuvant treatment to enhance the chemotherapeutic effect of Gem in lung cancer.

Keywords: HDAC inhibitor; apoptosis; cell cycle arrest; curcumin derivative; lung cancer; molecular docking.


Conflict of interest statement

The National Science Research and Innovation Fund through Khon Kaen University (Fundamental Fund-2565) and National Research Council of Thailand (NRCT) have no affiliation with any of the authors. The National Science Research and Innovation Fund was a major source of funding for the project. The corporation with NRCT made a cash payment of 117,000 baht. This does not affect our commitment to our data sharing and content sharing policies.

Figures

Figure 1
Figure 1
(a) Structure of curcumin (CU) and (b) curcumin derivative CU17.
Figure 2
Figure 2
HDAC inhibitory activity of CU17. (a) In vitro HDAC inhibitory activity of CU17 was analyzed by the Fluor-de-Lys HDAC Fluorometric Activity Assay Kit. Bar graphs were expressed as relative HDAC activity with respect to the control (DMSO). Trichostatin A (TSA) was used as a positive control. Each value represents the mean ± SD from three independent experiments. (b) Western blot analysis of hyperacetylation of histone H3 in A549 cells after exposure to varying concentrations of CU17 for 24 h. DMSO: ethanol (1:1, v/v) and cisplatin (10 µM) were used as negative and positive controls, respectively. Total ERK1/2 was used as a loading control for Western blotting. (c) The relative fold of protein expression was calculated using the intensity of the protein band in comparison to a loading control and shown as a bar graph. Bar graph displayed the mean from three independent experiments. * p < 0.05 indicates a significant difference between the treatment and solvent control.
Figure 3
Figure 3
The interaction between CU17 and the active site of (a) HDAC1, (b) HDAC2, (c) HDAC3, (d) HDAC4, (e) HDAC6, (f) HDAC7, and (g) HDAC8.
Figure 4
Figure 4
Effect of CU and CU17 on the proliferation of A549 cells (a,b) and non-cancer Vero cells (ce) treated for 24, 48, and 72 h. Antiproliferative activity was determined by MTT assay. Data are shown as the percentage of cell viability compared with the solvent control (0 µg/mL), which was defined as 100%. The IC50 values are presented as the mean ± SEM from three independent experiments.
Figure 5
Figure 5
Effect of CU and CU17 on cell cycle progression of A549 cells for 24 h. (a,c) Cellular DNA histograms exhibit the cell cycle distribution of A549 cells after CU or CU17 treatment. (b,d) Bar graphs displayed the mean of percentages of cell cycle distribution from three independent experiments. A549 cells treated with DMSO: ethanol (1:1, v/v) and cisplatin (10 µM) were used as negative and positive controls, respectively. * p < 0.05 indicates a significant difference between the treatment and solvent control.
Figure 6
Figure 6
Western blot analysis of cell cycle-related proteins in A549 cells for 24 h exposure. (a,c) Expressions of cell cycle-associated proteins (p53 and p21) treated with CU or CU17 were determined, and the cells were exposed to DMSO: ethanol (1:1, v/v) and cisplatin (10 µM) as negative and positive controls, respectively. Total ERK1/2 was used as a loading control for Western blotting. The representative blots are from one experiment. (b,d) The relative fold of protein expression was calculated using the intensity of the protein band in comparison to that of a loading control and shown as a bar graph. Bar graph displayed the mean from three independent experiments. * p < 0.05 indicates a significant difference between the treatment and the solvent control.
Figure 7
Figure 7
Effect of CU and CU17 on apoptosis induction in A549 cells for 24 h exposure. (a,c) The dot plots present the analysis of apoptosis induction on A549 cells after CU or CU17 treatment. (b,d) Bar graphs of the mean from three independent experiments displayed the percentages of apoptotic cells. A549 cells were treated with DMSO: ethanol (1:1, v/v) and cisplatin (10 µM) as negative and positive controls, respectively. * p < 0.05 indicates a significant difference between the treatment and solvent control.
Figure 8
Figure 8
Western blot analysis of apoptosis-related and ERK signaling proteins in A549 cells. (a,c) Cells were exposed to various concentrations of CU or CU17 for 24 h. DMSO: ethanol (1:1, v/v) and cisplatin (10 µM) were used as negative and positive controls, respectively. Total ERK1/2 was used as a loading control for Western blotting. The representative blots are from one experiment. (b,d) The relative fold of protein expression was calculated using the intensity of the protein band in comparison to that of a loading control and shown as a bar graph. Bar graphs display the mean from three independent experiments. * p < 0.05 indicates a significant difference between the treatment and solvent control.
Figure 9
Figure 9
The effect of Gem and CU or CU17 combination treatments on proliferation of A549 cells. (a,b) Cells were treated with CU (0.39–12.5 µg/mL final concentration) and Gem (IC20 = 0.68 and 0.35 µM and IC30 = 1.29 and 0.52 µM final concentration) at 48 and 72 h, respectively. (c,d) Cells were treated with CU17 (0.39–12.5 µg/mL final concentration) and Gem (IC20 = 0.68 and 0.35 µM and IC30 = 1.29 and 0.52 µM final concentration) at 48 and 72 h, respectively. Data are shown as the percentages of the solvent control, which was defined as 100%. The IC50 values are expressed as the mean ± SEM from three independent experiments. (e,f) Bar graphs show percentages of cell viability. DMSO : ethanol (1:1, v/v) was used as a negative control. * p < 0.05 indicates a significant difference between the treatment and solvent control, while ** p < 0.05 indicates a significant difference between the alone and combination treatments.

References

    1. The Global Cancer Observatory. [(accessed on 18 October 2020)]. Available online: https://gco.iarc.fr/today/data/factsheets/populations/764-thailand-fact-....
    1. Hatami E., Nagesh P., Jaggi M., Chauhan S., Yallapu M. Gambogic Acid Potentiates Gemcitabine Induced Anticancer Activity in Non-Small Cell Lung Cancer. Eur. J. Pharmacol. 2020;888:173486. doi: 10.1016/j.ejphar.2020.173486. - DOI - PMC - PubMed
    1. Chang J., Jeon J., Sriplung H., Yeesoonsang S., Bilheem S., Rozek L., Chitapanarux I., Pongnikorn D., Daoprasert K., Vatanasapt P., et al. Temporal Trends and Geographic Patterns of Lung Cancer Incidence by Histology in Thailand, 1990 to 2014. J. Glob. Oncol. 2018;4:1–29. doi: 10.1200/JGO.18.00013. - DOI - PMC - PubMed
    1. Kalaiarasi A., Sankar R., Anusha C., Saravanan K., Aarthy K., Karthic S., Mathuram T., Ravikumar V. Copper Oxide Nanoparticles Induce Anticancer Activity in A549 Lung Cancer Cells by Inhibition of Histone Deacetylase. Biotechnol. Lett. 2017;40:249–256. doi: 10.1007/s10529-017-2463-6. - DOI - PubMed
    1. Hontecillas-Prieto L., Flores-Campos R., Silver A., de Álava E., Hajji N., García-Domínguez D. Synergistic Enhancement of Cancer Therapy Using HDAC Inhibitors: Opportunity for Clinical Trials. Front. Genet. 2020;11:578011. doi: 10.3389/fgene.2020.578011. - DOI - PMC - PubMed