. 2022 Jun 30;27(13):4207.
doi: 10.3390/molecules27134207.

The Anti-Inflammatory Properties of Chaga Extracts Obtained by Different Extraction Methods against LPS-Induced RAW 264.7

Affiliations

The Anti-Inflammatory Properties of Chaga Extracts Obtained by Different Extraction Methods against LPS-Induced RAW 264.7

Weaam Alhallaf et al. Molecules. .

Abstract

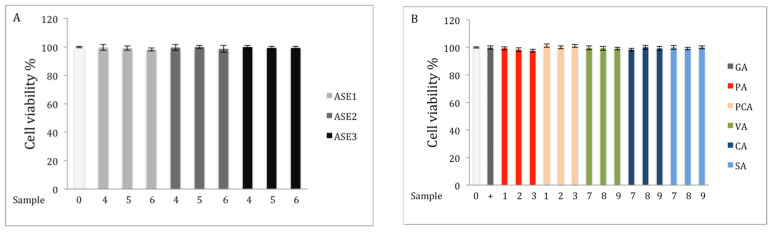
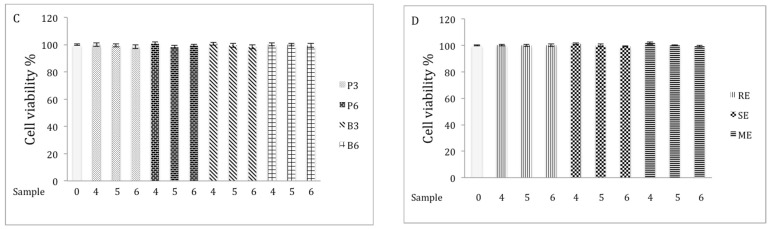
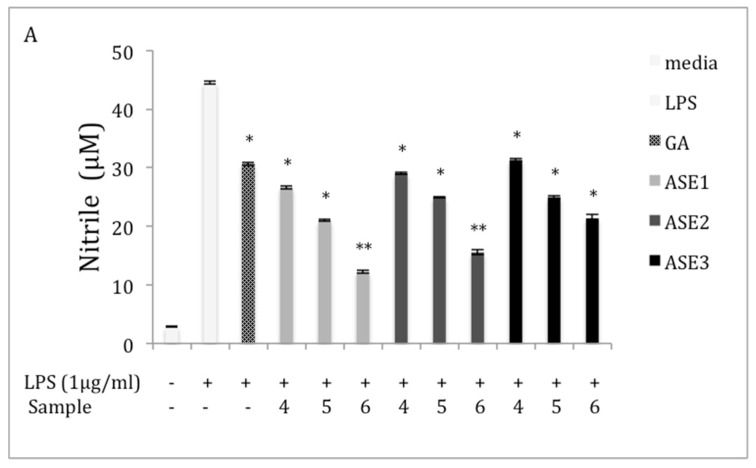
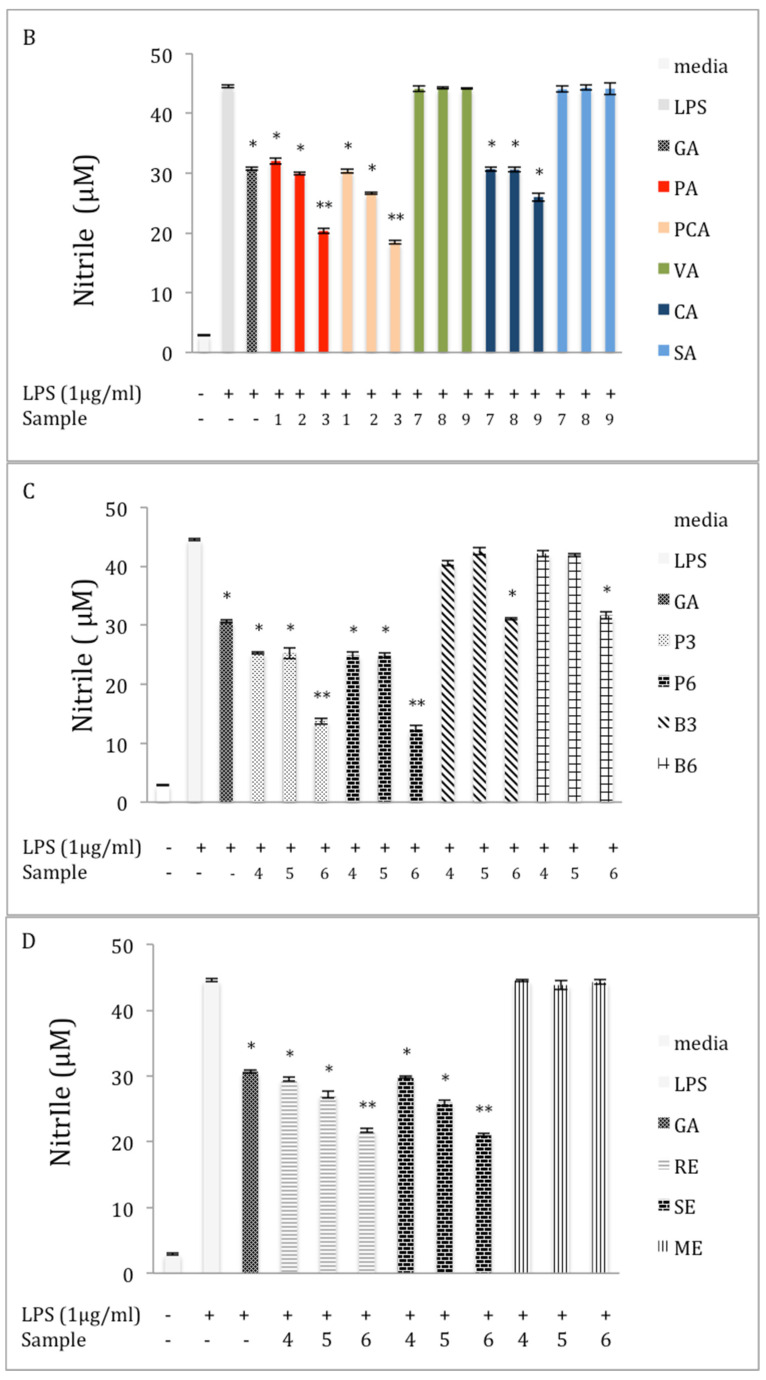
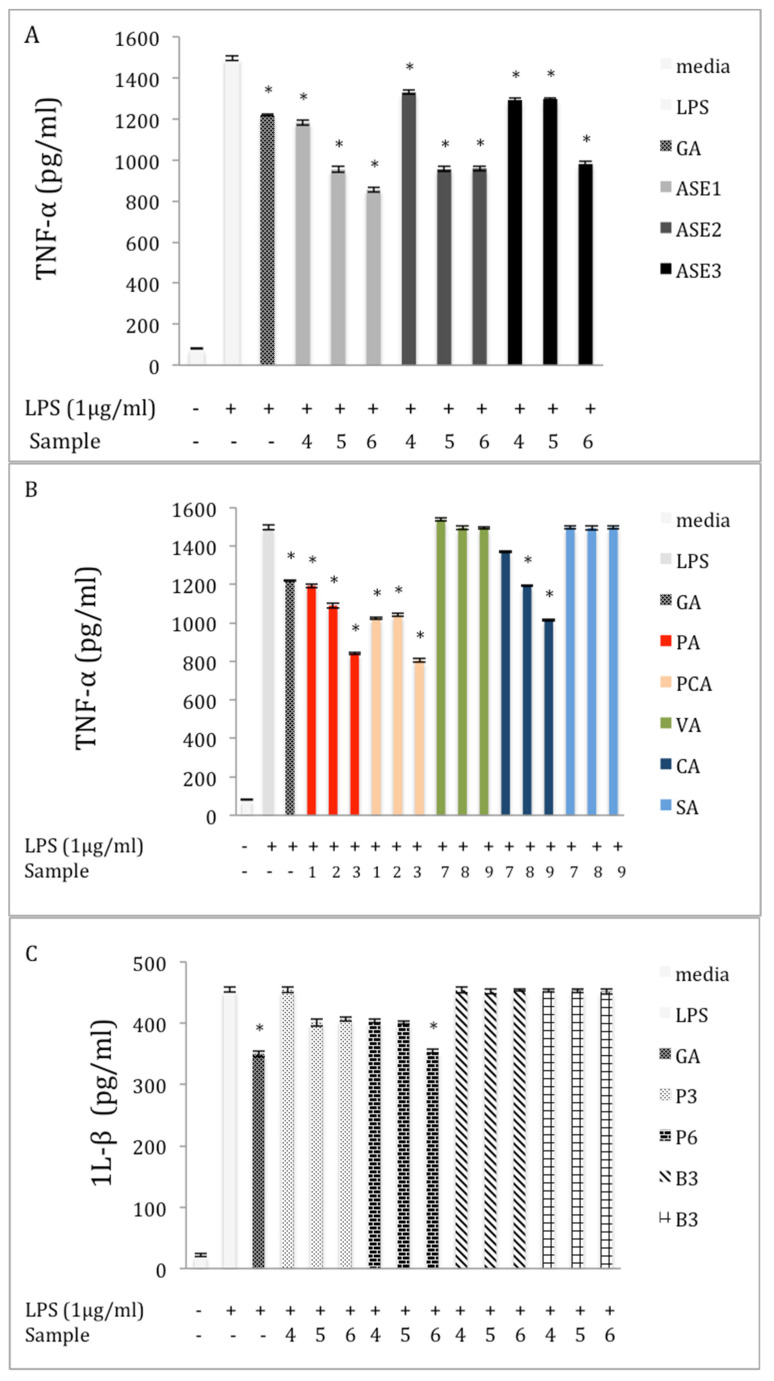
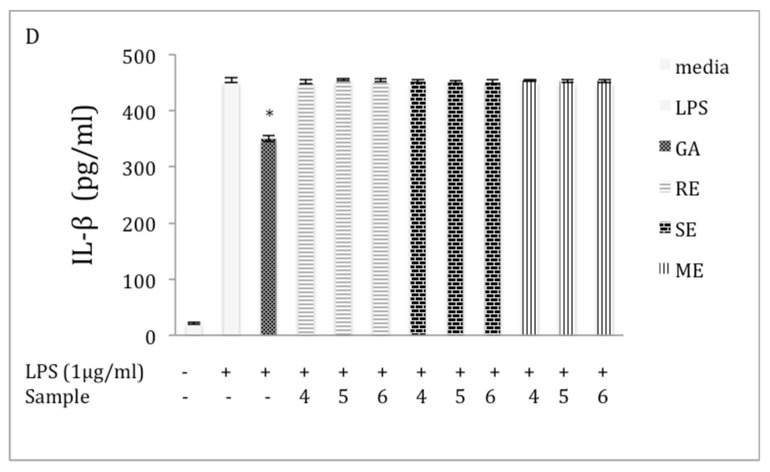
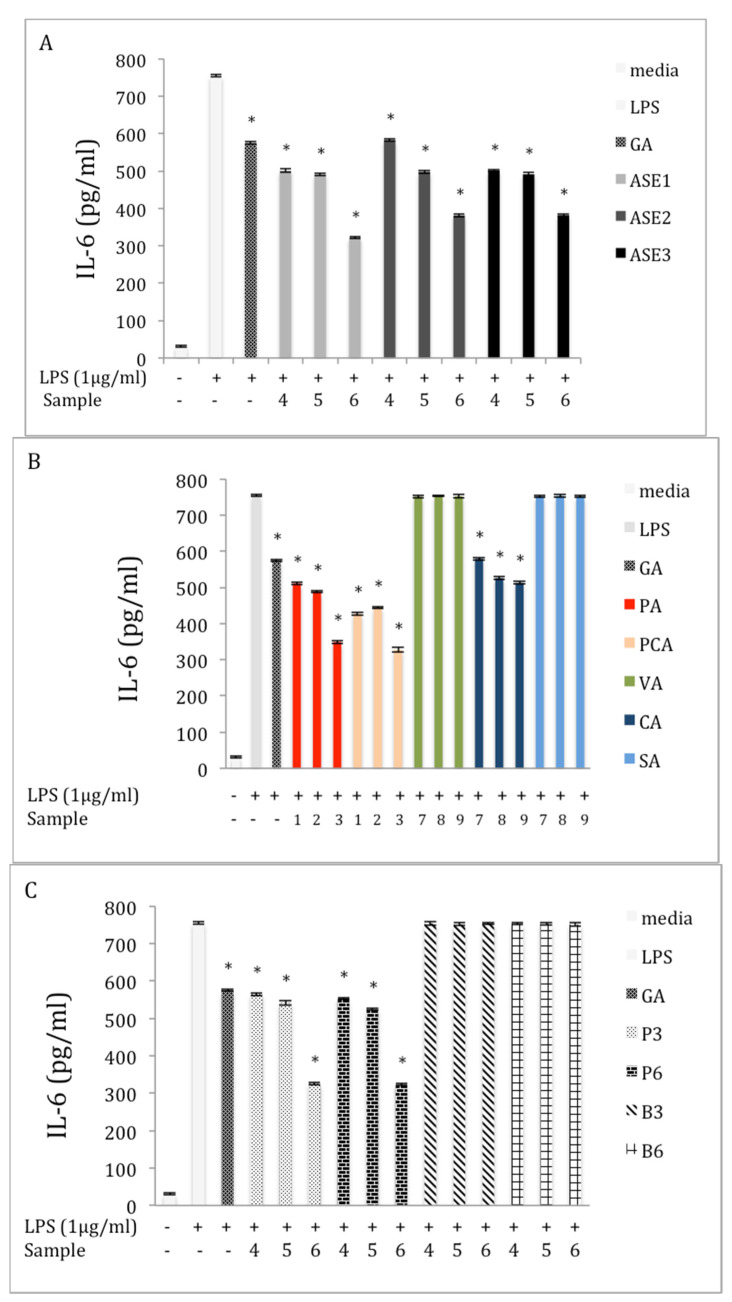
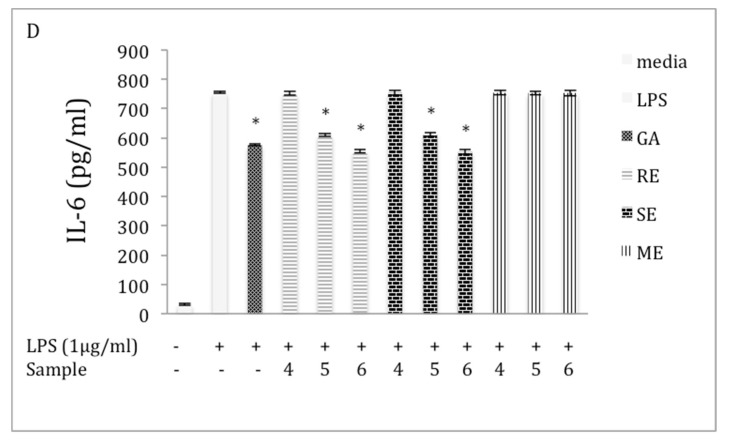
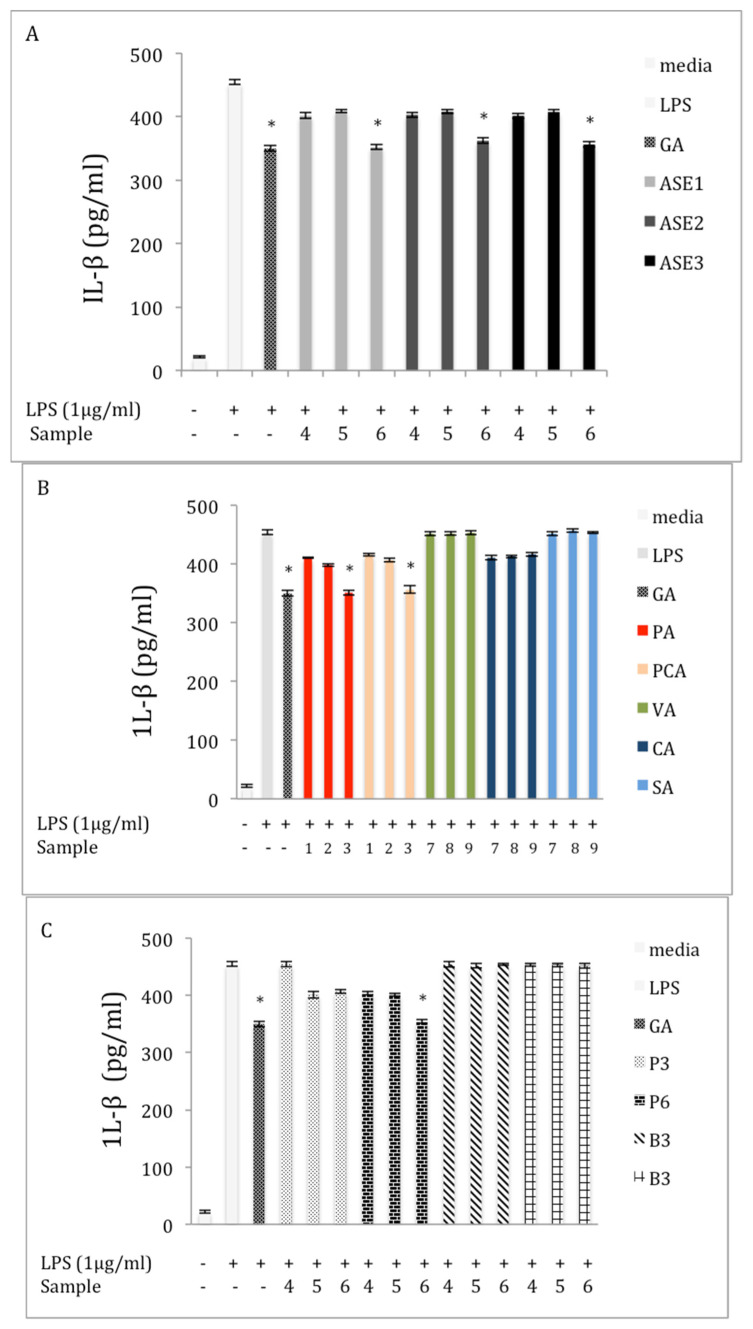
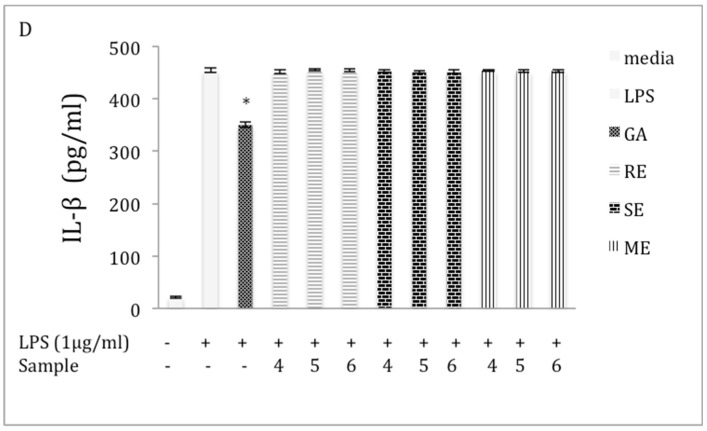
Chaga, a sclerotia formed by the Inonotus obliquus fungus, has been widely recognized for a number of medicinal properties. Although numerous scientific investigations have been published describing various biological activities of chaga from different geographical locations, little work has focused on chaga harvested in the USA or extraction techniques to maximize anti-inflammatory properties. The aim of this study was to investigate the anti-inflammatory properties of chaga collected in Maine (USA) extracted using traditional aqueous (hot water steeping) methods against lipopolysaccharide (LPS)-induced RAW 264.7 macrophages. Chaga extracts obtained from both conventional (ethanol/water) extraction methods and an accelerated solvent extraction method (ASE) at optimized conditions were compared to aqueous extracts (tea) obtained from chaga in the powder form (P) and powder form in tea bags (B) based on their effect on both nitric oxide (NO) production and pro-inflammatory cytokine expression, in particular, the expression of TNF-α, interleukin-6 (IL-6), and interleukin-β (IL-1β). Phenolic acid extracts from chaga and individual phenolic acid standards were also investigated for their effect on the same parameters. Results indicated that various chaga extracts have significant anti-inflammatory activity on LPS-stimulated RAW 264.7 cells. The inhibitory effect was through a decrease in the production of NO and the downregulation of TNF-α, IL-6, and IL-1β in RAW 264.7 macrophages. ASE1 (novel, optimized ethanol/water extraction) and P6 (six-minute steeping of powder in 100 °C water) extracts showed the highest inhibitory activity on NO production and on the expression of the inflammatory cytokines, compared to extracts obtained by conventional extraction methods.

Keywords: healthful fungal products; inflammation treatment; natural product extracts; nutraceuticals.


Conflict of interest statement

The authors declare no conflict of interest.

Figures

Figure 1
Figure 1
Effects of different extracts and phenolics on cell viability of RAW264.7 cells. Extracts were obtained by (A) ASE conditions, (B) pure phenolic acid standards, (C) crude polysaccharide extracts, and (D) different extraction methods. Cells were stimulated with 1 µg/mL of LPS plus varying concentrations of samples (0 = media, GA = 2 μM; 1 = 5 μM; 2 = 10 μM; 3 = 20 μM; 4 = 50 μg/mL; 5 = 100 μg/mL; 6 = 150 μg/mL; 7= 25 μM; 8 = 50 μM; and 9 = 100 μM).
Figure 1
Figure 1
Effects of different extracts and phenolics on cell viability of RAW264.7 cells. Extracts were obtained by (A) ASE conditions, (B) pure phenolic acid standards, (C) crude polysaccharide extracts, and (D) different extraction methods. Cells were stimulated with 1 µg/mL of LPS plus varying concentrations of samples (0 = media, GA = 2 μM; 1 = 5 μM; 2 = 10 μM; 3 = 20 μM; 4 = 50 μg/mL; 5 = 100 μg/mL; 6 = 150 μg/mL; 7= 25 μM; 8 = 50 μM; and 9 = 100 μM).
Figure 2
Figure 2
Effect of extracts and phenolics on production of nitric oxide (NO) in macrophage RAW 264.7 cells (A) ASE extracts; (B) pure phenolic standards; (C) crude polysaccharide extracts; and (D) different extraction methods. Cells were cultured in the absence (−) or presence (+) of LPS (1 μg/mL) with various concentrations of different samples (- denotes no sample) for 24 h (0 = media; GA = 2 μM; 1 = 5 μM; 2 = 10 μM; 3 = 20 μM; 4 = 50 μg/mL; 5 = 100 μg/mL; and 6= 150 μg/mL; 7 = 25 μM; 8 = 50 μM; and 9 = 100 μM). NO production was measured by the Griess reagent and is represented as mean ± standard error (SE) in the bars. Statistical significance p < 0.05 (*) and p < 0.01 (**) was determined using one-way analysis of variance for independent means, followed by Tukey’s HSD test.
Figure 2
Figure 2
Effect of extracts and phenolics on production of nitric oxide (NO) in macrophage RAW 264.7 cells (A) ASE extracts; (B) pure phenolic standards; (C) crude polysaccharide extracts; and (D) different extraction methods. Cells were cultured in the absence (−) or presence (+) of LPS (1 μg/mL) with various concentrations of different samples (- denotes no sample) for 24 h (0 = media; GA = 2 μM; 1 = 5 μM; 2 = 10 μM; 3 = 20 μM; 4 = 50 μg/mL; 5 = 100 μg/mL; and 6= 150 μg/mL; 7 = 25 μM; 8 = 50 μM; and 9 = 100 μM). NO production was measured by the Griess reagent and is represented as mean ± standard error (SE) in the bars. Statistical significance p < 0.05 (*) and p < 0.01 (**) was determined using one-way analysis of variance for independent means, followed by Tukey’s HSD test.
Figure 3
Figure 3
Effect of extracts and phenolics on tumor necrosis factor-α (TNF-α) expression in macrophage RAW 264.7 cells (A) ASE extracts; (B) pure phenolic standards; (C) crude polysaccharide extracts; and (D) different extraction methods. Cells were cultured in the absence or presence of LPS (1 μg/mL) with various concentrations of different samples for 24 h (0 = media; GA = 2 μM; 1 = 5 μM; 2 = 10 μM; 3 = 20 μM; 4 = 50 μg/mL; 5 = 100 μg/mL; and 6 = 150 μg/mL; 7 = 25 μM; 8 = 50 μM; and 9 = 100 μM). TNF-α production was determined through an ELISA. The data represent the mean ± SE of triplicate experiments. Statistical significance p < 0.05 (*) was determined using one-way analysis of variance for independent means, followed by Tukey’s HSD test.
Figure 3
Figure 3
Effect of extracts and phenolics on tumor necrosis factor-α (TNF-α) expression in macrophage RAW 264.7 cells (A) ASE extracts; (B) pure phenolic standards; (C) crude polysaccharide extracts; and (D) different extraction methods. Cells were cultured in the absence or presence of LPS (1 μg/mL) with various concentrations of different samples for 24 h (0 = media; GA = 2 μM; 1 = 5 μM; 2 = 10 μM; 3 = 20 μM; 4 = 50 μg/mL; 5 = 100 μg/mL; and 6 = 150 μg/mL; 7 = 25 μM; 8 = 50 μM; and 9 = 100 μM). TNF-α production was determined through an ELISA. The data represent the mean ± SE of triplicate experiments. Statistical significance p < 0.05 (*) was determined using one-way analysis of variance for independent means, followed by Tukey’s HSD test.
Figure 4
Figure 4
Effect of extracts and phenolics on IL-6 expression in macrophage RAW 264.7 cells (A) extracts obtained by ASE; (B) pure phenolic acid standards; (C) crude polysaccharide extracts; and (D) different extraction methods. Cells were cultured in the absence or presence of LPS (1 μg /mL) with various concentrations of different samples for 24 h (0 = media; GA = 2 μM; 1 = 5 μM; 2 = 10 μM; 3 = 20 μM; 4 = 50 μg/mL; 5 = 100 μg/mL; and 6 = 150 μg/mL; 7 = 25 μM; 8 = 50 μM; and 9 = 100 μM). IL-6 production was determined through an ELISA. The data represent the mean ± SD of triplicate experiments. Statistical significance p < 0.05 (*) was determined using one-way analysis of variance for independent means, followed by Tukey’s HSD test.
Figure 4
Figure 4
Effect of extracts and phenolics on IL-6 expression in macrophage RAW 264.7 cells (A) extracts obtained by ASE; (B) pure phenolic acid standards; (C) crude polysaccharide extracts; and (D) different extraction methods. Cells were cultured in the absence or presence of LPS (1 μg /mL) with various concentrations of different samples for 24 h (0 = media; GA = 2 μM; 1 = 5 μM; 2 = 10 μM; 3 = 20 μM; 4 = 50 μg/mL; 5 = 100 μg/mL; and 6 = 150 μg/mL; 7 = 25 μM; 8 = 50 μM; and 9 = 100 μM). IL-6 production was determined through an ELISA. The data represent the mean ± SD of triplicate experiments. Statistical significance p < 0.05 (*) was determined using one-way analysis of variance for independent means, followed by Tukey’s HSD test.
Figure 5
Figure 5
Effect of extracts and phenolics on IL-β expression in macrophage RAW 264.7 cells (A) extracts obtained by ASE; (B) pure phenolic acid standards; (C) crude polysaccharide extracts; and (D) different extraction methods. Cells were cultured in the absence or presence of LPS (1 μg /mL) with various concentrations of different samples for 24 h (0 = media; GA = 2 μM; 1 = 5 μM; 2 = 10 μM; 3 = 20 μM; 4 = 50 μg/mL; 5 = 100 μg/mL; and 6 = 150 μg/mL; 7 = 25 μM; 8 = 50 μM; and 9 = 100 μM). IL-β production was determined through an ELISA. The data represent the mean ± SD of triplicate experiments. Statistical significance p < 0.05 (*) was determined using one-way analysis of variance for independent means, followed by Tukey’s HSD test.
Figure 5
Figure 5
Effect of extracts and phenolics on IL-β expression in macrophage RAW 264.7 cells (A) extracts obtained by ASE; (B) pure phenolic acid standards; (C) crude polysaccharide extracts; and (D) different extraction methods. Cells were cultured in the absence or presence of LPS (1 μg /mL) with various concentrations of different samples for 24 h (0 = media; GA = 2 μM; 1 = 5 μM; 2 = 10 μM; 3 = 20 μM; 4 = 50 μg/mL; 5 = 100 μg/mL; and 6 = 150 μg/mL; 7 = 25 μM; 8 = 50 μM; and 9 = 100 μM). IL-β production was determined through an ELISA. The data represent the mean ± SD of triplicate experiments. Statistical significance p < 0.05 (*) was determined using one-way analysis of variance for independent means, followed by Tukey’s HSD test.

References

    1. Taofiq O., Martins A., Barreiro M.F., Ferreira I.C. Anti-inflammatory potential of mushroom extracts and isolated metabolites. Trends Food Sci. Technol. 2016;50:193–210. doi: 10.1016/j.tifs.2016.02.005. - DOI
    1. Garlanda C., Di Liberto D., Vecchi A., La Manna M.P., Buracchi C., Caccamo N., Salerno A., Dieli F., Mantovani A. Damping excessive inflammation and tissue damage in Mycobacterium tuberculosis infection by Toll IL-1 receptor 8/single Ig IL-1-related receptor, a negative regulator of IL-1/TLR signaling. J. Immunol. 2007;179:3119–3125. doi: 10.4049/jimmunol.179.5.3119. - DOI - PubMed
    1. Jeong J.B., Jeong H.J. Rheosmin, a naturally occurring phenolic compound inhibits LPS-induced iNOS and COX-2 expression in RAW264.7 cells by blocking NF-κB activation pathway. Food Chem. Toxicol. 2010;48:2148–2153. doi: 10.1016/j.fct.2010.05.020. - DOI - PubMed
    1. Dai B., Wei D., Zheng N.-N., Chi Z.-H., Xin N., Ma T.-X., Zheng L.-Y., Sumi R., Sun L. Coccomyxa Gloeobotrydiformis polysaccharide inhibits lipopolysaccharide-induced inflammation in RAW 264.7 Macrophages. Cell. Physiol. Biochem. 2018;51:2523–2535. doi: 10.1159/000495922. - DOI - PubMed
    1. Duru K.C., Kovaleva E.G., Danilova I.G., van der Bijl P. The pharmacological potential and possible molecular mechanisms of action of Inonotus obliquus from preclinical studies. Phytotherapy Res. 2019;33:1966–1980. doi: 10.1002/ptr.6384. - DOI - PubMed