. 2022 Jun 30;27(13):4208.
doi: 10.3390/molecules27134208.

Lead Isotopic Constraints on the Provenance of Antarctic Dust and Atmospheric Circulation Patterns Prior to the Mid-Brunhes Event (~430 kyr ago)

Affiliations

Lead Isotopic Constraints on the Provenance of Antarctic Dust and Atmospheric Circulation Patterns Prior to the Mid-Brunhes Event (~430 kyr ago)

Changhee Han et al. Molecules. .

Abstract

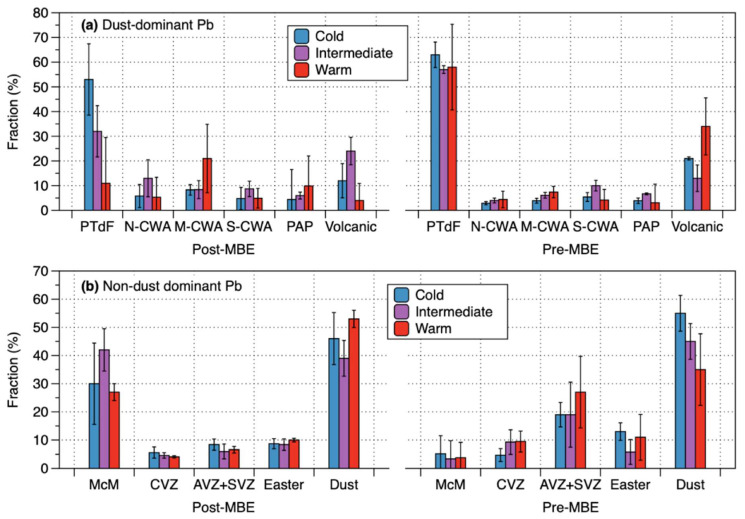
A lead (Pb) isotopic record, covering the two oldest glacial-interglacial cycles (~572 to 801 kyr ago) characterized by lukewarm interglacials in the European Project for Ice Coring in Antarctica Dome C ice core, provides evidence for dust provenance in central East Antarctic ice prior to the Mid-Brunhes Event (MBE), ~430 kyr ago. Combined with published post-MBE data, distinct isotopic compositions, coupled with isotope mixing model results, suggest Patagonia/Tierra del Fuego (TdF) as the most important sources of dust during both pre-MBE and post-MBE cold and intermediate glacial periods. During interglacials, central-western Argentina emerges as a major contributor, resulting from reduced dust supply from Patagonia/TdF after the MBE, contrasting to the persistent dominance of dust from Patagonia/TdF before the MBE. The data also show a small fraction of volcanic Pb transferred from extra-Antarctic volcanoes during post-MBE interglacials, as opposed to abundant transfer prior to the MBE. These differences are most likely attributed to the enhanced wet removal efficiency with the hydrological cycle intensified over the Southern Ocean, associated with a poleward shift of the southern westerly winds (SWW) during warmer post-MBE interglacials, and vice versa during cooler pre-MBE ones. Our results highlight sensitive responses of the SWW and the associated atmospheric conditions to stepwise Antarctic warming.

Keywords: EPICA Dome C ice core; Mid-Brunhes Event; dust and volcanic sources; isotope mixing model; lead isotopes; southern westerly winds.


Conflict of interest statement

The authors declare no conflict of interest.

Figures

Figure 1
Figure 1
Changes in Pb and Ba concentrations, and Pb isotopic compositions from the EDC ice core. Also included are previously published data from the EDC ice core during the reporting period from 2 kyr (MIS 1) to 220 kyr B.P. (MIS 7.3) [17]. (a) The full EDC δD (Antarctic temperature proxy) profile [2] with Marine Isotope Stage (MIS) numbers [28]. (b,c) Changes in Pb and Ba concentrations and their deposition fluxes. Flux of dust in the EDC ice core [5] is shown as a gray solid line for comparison. (d,e) Changes in 206Pb/207Pb and 208Pb/207Pb ratios. The δD record in the EDC ice core is shown as a gray solid line for comparison. The vertical grey bars represent the interglacial periods when the δD values are above −405‰. All uncertainties for 206Pb/207Pb and 208Pb/207Pb ratios are 95% confidence intervals.
Figure 2
Figure 2
A plot of 206Pb/207Pb versus 208Pb/207Pb in the EDC ice core. Also included are post-MBE data previously reported from the EDC ice core [17]. The observed data are divided into isotopic compositions for (a) dust-dominant samples with a dust-derived Pb fraction of >60% and (b) non-dust dominant samples with a dust-derive Pb fraction of <60% (see text). The isotopic fields of the potential sources of dust in (a) and volcanic Pb in (b) were derived from the literature: Puna-Altiplano Plateau (PAP) [18], central-western Argentina (CWA) [18], Patagonia/Tierra del Fuego (TdF) [18], southeastern (SE) Australia (Murray-Darling Basin) [17,34], McMurdo Volcanic Group (McM) [35,36], South Sandwich Island [37], South Shetland Island [38], Bouvet Island [39], New Zealand (NZ) [40], Easter Island and Tonga [39], Marion and Prince Edward (MPE) [41], Kerguelen Island [42], Heard Island [43], Amsterdam-St. Paul Island (ASP) [44], SVZ: Southern Volcanic Zone, and AVZ: Austral Volcanic Zone of the Andean Volcanic Belt [45,46]. Group A, B, and C within the dashed circles in Figure 2b exhibit stepwise changes in the post-MBE isotopic compositions to more radiogenic values as progressive reduction in the mean proportions of dust-derived Pb (29 ± 13% for group A, 42 ± 11% for group B, and 51 ± 6% for group C). Sample numbers mentioned in the text are also shown in Figure 2. The acronyms next to the fields are defined in Figures S2 and S3.
Figure 3
Figure 3
The relative contributions (in %) of (a) the potential dust sources for dust-dominant samples and (b) the potential volcanic sources for non-dust dominant samples calculated using an isotope mixing model (see Methods and Tables S3 and S4). The acronyms are defined in Figures S2 and S3. The bar graph shows the median values and vertical lines represent standard deviations of a data set.
Figure 4
Figure 4
Comparison of 206Pb/207Pb ratios between the pre-MBE and post-MBE intervals as a function of the dust fraction of Pb in the EDC ice core samples. All uncertainties are 95% confidence intervals. The end-members of volcanic 206Pb/207Pb ratios for the potential volcanic sources come from published literature: Antarctic Peninsula basalts [67], McMurdo Volcanic Group [35,36], South Sandwich Island [37], South Shetland Island [38], Bouvet Island [39], New Zealand [40], Easter Island and Tonga [39], Marion and Prince Edward [41], Kerguelen Island [42], Heard Island [43], Amsterdam-St. Paul Island [44], and Andean Volcanic Belt [45,46]. The locations of individual volcanoes are shown in Figure S2. Note that the fraction of dust Pb in excess of 100% shown in part of the post-MBE samples [17] was considered to be 100%. The least squares lines are shown for the post-MBE (solid line) (Spearman’s correlation of 0.736 at p < 0.01) and pre-MBE (dashed line) isotopic data (no correlation with Spearman’s correlation of 0.207) with a dust-derived Pb fraction of <60%. Sample numbers mentioned in the text are also shown in Figure 4.

References

    1. EPICA Community Members Eight glacial cycles from an Antarctic ice core. Nature. 2004;429:623–628. doi: 10.1038/nature02599. - DOI - PubMed
    1. Jouzel J., Masson-Delmotte V., Cattani O., Dreyfus G., Falourd S., Hoffmann G., Minster B., Nouet J., Barnola J.M., Chappellaz J., et al. Orbital and millennial antarctic climate variability over the past 800,000 years. Science. 2007;317:793–796. doi: 10.1126/science.1141038. - DOI - PubMed
    1. Masson-Delmotte V., Stenni B., Pol K., Braconnot P., Cattani O., Falourd S., Kageyama M., Jouzel J., Landais A., Minster B., et al. EPICA Dome C record of glacial and interglacial intensities. Quat. Sci. Rev. 2010;29:113–128. doi: 10.1016/j.quascirev.2009.09.030. - DOI
    1. Yung Y.L., Lee T., Wang C.-H., Shieh Y.-T. Dust: A diagnostic of the hydrologic cycle during the last glacial maximum. Science. 1996;271:962–963. doi: 10.1126/science.271.5251.962. - DOI - PubMed
    1. Lambert F., Delmonte B., Petit J.R., Bigler M., Kaufmann P.R., Hutterli M.A., Stocker T.F., Ruth U., Steffensen J.P., Maggi V. Dust-climate couplings over the past 800,000 years from the EPICA Dome C ice core. Nature. 2008;452:616–619. doi: 10.1038/nature06763. - DOI - PubMed

LinkOut - more resources