. 2022 Jun 27;14(13):2669.
doi: 10.3390/nu14132669.

Hydroxycitric Acid Inhibits Chronic Myelogenous Leukemia Growth through Activation of AMPK and mTOR Pathway

Affiliations

Hydroxycitric Acid Inhibits Chronic Myelogenous Leukemia Growth through Activation of AMPK and mTOR Pathway

Doriana Verrelli et al. Nutrients. .

Abstract

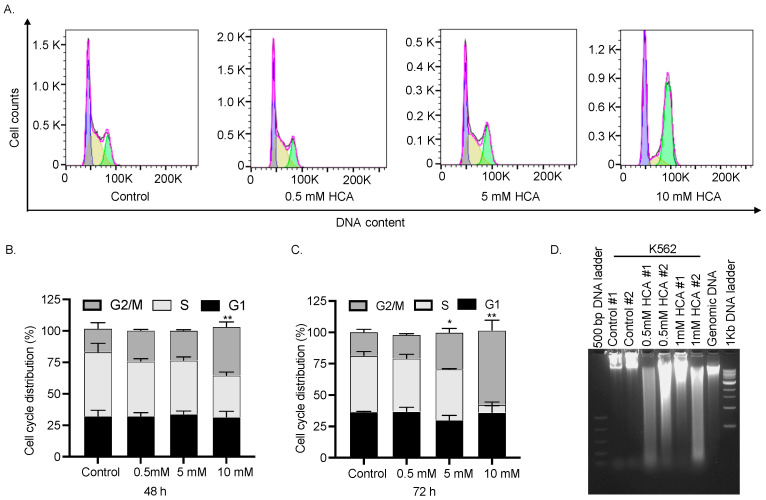
Metabolic regulation of cancer cell growth via AMP-activated protein kinase (AMPK) activation is a widely studied strategy for cancer treatment, including leukemias. Recent notions that naturally occurring compounds might have AMPK activity led to the search for nutraceuticals with potential AMPK-stimulating activity. We found that hydroxycitric acid (HCA), a natural, safe bioactive from the plant Garcinia gummi-gutta (cambogia), has potent AMPK activity in chronic myelogenous leukemia (CML) cell line K562. HCA is a known competitive inhibitor of ATP citrate lyase (ACLY) and is widely used as a weight loss inducer. We found that HCA was able to inhibit the growth of K562 cells in in vitro and in vivo xenograft models. At the mechanistic level, we identified a direct interaction between AMPK and ACLY that seems to be sensitive to HCA treatment. Additionally, HCA treatment resulted in the co-activation of AMPK and the mammalian target of rapamycin (mTOR) pathways. Moreover, we found an enhanced unfolded protein response as observed by activation of the eIF2α/ATF4 pathway that could explain the induction of cell cycle arrest at the G2/M phase and DNA fragmentation upon HCA treatment in K562 cells. Overall, these findings suggest HCA as a nutraceutical approach for the treatment of CMLs.

Keywords: AMPK; CML; hydroxycitric acid; nutraceuticals.


Conflict of interest statement

The authors declare no conflict of interest. The funders had no role in the design of the study; in the collection, analyses, or interpretation of data; in the writing of the manuscript, or in the decision to publish the results.

Figures

Figure 1
Figure 1
Hydroxycitric acid promotes AMPK phosphorylation in CML cells. CML cell lines were treated for 24 h with different concentrations of HCA. An equal amount of protein from each condition was separated on SDS PAGE (12% gel) and an immunoblot was performed using specific antibodies against pT172 AMPK and total AMPK. Vinculin was used as an internal control. (A) K562 (B) MEG-01 (C) KYO-1 (D) SHK-1. For the K562, MEG-01, KYO-1, and SHK-1, samples were loaded in duplicate. One was probed with total AMPK and the another one was probed with pT172 AMPK. Upper vinculin is referred to as pAMPK, and lower vinculin is referred to as the total AMPK. The bar graph beside each figure panel reflects the band intensity evaluated as optical density and represented as fold change for treated vs. untreated cells normalized for vinculin. ** p < 0.01, * p < 0.05 treated vs. untreated cells.
Figure 2
Figure 2
AMPK interacts with ACLY. (A) Co-immunoprecipitation of AMPK and ACLY in K562 cells. Endogenous AMPK was immunoprecipitated with antibody against total AMPK followed by Western blotting with anti-AMPK and anti-ACLY (upper panel). Bar graph showing the ratio of optical density of immunoprecipitated (IP) band of ACLY and AMPK after normalization with the respective input (lower panel). (B) Co-immunoprecipitation of AMPK and ACLY in K562 cells upon treatment with HCA (upper panel). Bar graph of optical density of immunoprecipitated ACLY and AMPK in each condition normalized to respective input band (left lower panel). Ratio of optical density of immunoprecipitated (IP) band of ACLY and AMPK after normalization with the control (right lower panel).
Figure 3
Figure 3
HCA stimulates unfolded protein response pathway. Cell lysate was prepared from K562 cells treated with indicated concentration of HCA. Proteins were separated and immunoblotted with antibody against desired protein. (A) HCA induces concomitant activation of AMPK and mTORC1 pathways in K562 cells. Samples were loaded in duplicate. One of them was used to immunoblot with phosphor form and the other was used to immunoblot respective total protein. Upper vinculin is referred to as p-AMPK, p-p70S6K, and pS6 ribosomal protein; lower vinculin is referred to as total AMPK, p70S6K, and S6 ribosomal protein. (B) HCA-treated K562 show upregulation of unfolded protein response markers ATF4 and p-elF2α. Upper vinculin is referred to as peIF2α and ATF4; lower vinculin is referred to as eIF2α. The bar graph beside each figure panel reflects the band intensity evaluated as optical density and represented as fold change for treated vs. untreated cells normalized for vinculin. ** p < 0.01, * p < 0.05 treated vs. untreated cells.
Figure 4
Figure 4
HCA induces DNA fragmentation and G2/M arrest in K562 cells. (A) K562 cells were treated for 48 h and 72 h with different concentrations of HCA, as indicated. Cells were collected, treated with RNase, and stained with PI. Cell cycle distribution was then detected through flow cytometry system (BD FACS Celesta). Graphs were obtained with data analysis through ModFit LT software (FlowJo v10, Ashland, OR, USA). The fitted cell populations in G1, S and G2/M phases are represented in purple, light yellow, and light green. (B) Bar graph showing cell cycle distribution at 48 h. Treatment with 10 mM HCA leads to a significant delay in the cell cycle progression at the G2/M phase. ** p < 0.01; unpaired t-test (C) Bar graph showing cell cycle distribution at 72 h. Treatment with 5 mM and 10 mM HCA lead to a significant delay in the cell cycle progression at G2/M phase. (* p < 0.05; ** p < 0.01; unpaired t-test (D) K562 cells were treated with different concentrations of HCA, as indicated. Samples were lysed and prepared following the appropriate protocol and then DNA fragmentation was evaluated by agarose gel electrophoresis (2%). M, 500 bp DNA ladder; DNA, genomic DNA standard; L, 1 kb DNA ladder.
Figure 5
Figure 5
HCA inhibits K562 cells’ growth in vitro and in vivo. (A) CML cell lines (K562, MEG-01, CML-T1, KYO-1, and SHK-1) were incubated with different concentrations of HCA. After 72 h, cell viability was measured and response curves were plotted using GraphPad Prism 9. (B) List of IC50 values in mM calculated from curve ‘A’. (CE) NSG mice were subcutaneously injected at the right flank with 0.5 × 10⁶ K562 cells and were divided randomly into control and HCA-treated group. HCA was administered daily by oral gavage at 3 mg/kg body weight. (C) Plot showing tumor volume with time. HCA-treated mice showed a significant delay in the tumor growth (* p < 0.05; ** p < 0.01; **** p < 0.0001; unpaired t-test). (D) Image of tumor from control and HCA-treated mice at the time of sacrifice. (E) Comparison of tumor volume of control (n = 7) and HCA-treated mice (n = 8) (p < 0.0001; unpaired t-test). (F) Comparison of tumor weight of control (n = 7) and HCA-treated mice (n = 8) (p < 0.0001; unpaired t-test).

References

    1. Hardie D.G. AMPK—Sensing Energy While Talking to Other Signaling Pathways. Cell Metab. 2014;20:939–952. doi: 10.1016/j.cmet.2014.09.013. - DOI - PMC - PubMed
    1. Hardie D.G., Ross F.A., Hawley S.A. AMPK: A Nutrient and Energy Sensor That Maintains Energy Homeostasis. Nat. Rev. Mol. Cell Biol. 2012;13:251–262. doi: 10.1038/nrm3311. - DOI - PMC - PubMed
    1. Haurie V., Boucherie H., Sagliocco F. The Snf1 Protein Kinase Controls the Induction of Genes of the Iron Uptake Pathway at the Diauxic Shift in Saccharomyces Cerevisiae. J. Biol. Chem. 2003;278:45391–45396. doi: 10.1074/jbc.M307447200. - DOI - PubMed
    1. Vander Heiden M.G., Cantley L.C., Thompson C.B. Understanding the Warburg Effect: The Metabolic Requirements of Cell Proliferation. Science. 2009;324:1029–1033. doi: 10.1126/science.1160809. - DOI - PMC - PubMed
    1. Li W., Saud S.M., Young M.R., Chen G., Hua B. Targeting AMPK for Cancer Prevention and Treatment. Oncotarget. 2015;6:7365. doi: 10.18632/oncotarget.3629. - DOI - PMC - PubMed

MeSH terms