Randomized Controlled Trial
. 2022 Jun 28;14(13):2670.
doi: 10.3390/nu14132670.

Dietary Protein Restriction Improves Metabolic Dysfunction in Patients with Metabolic Syndrome in a Randomized, Controlled Trial

Affiliations
Randomized Controlled Trial

Dietary Protein Restriction Improves Metabolic Dysfunction in Patients with Metabolic Syndrome in a Randomized, Controlled Trial

Rafael Ferraz-Bannitz et al. Nutrients. .

Abstract

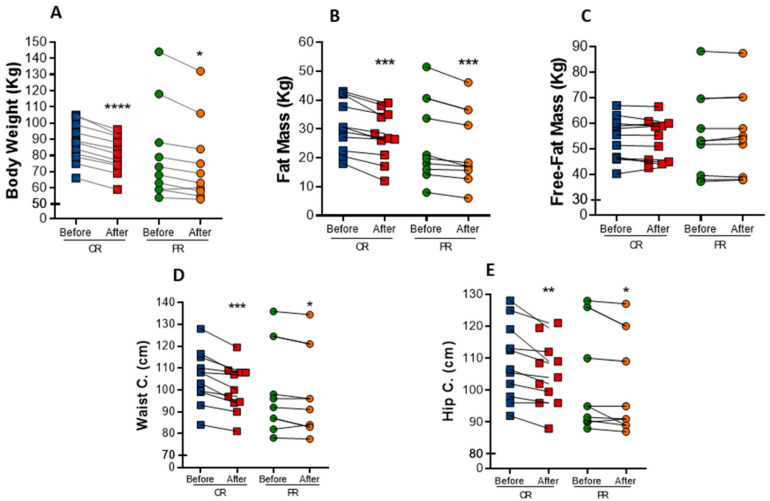
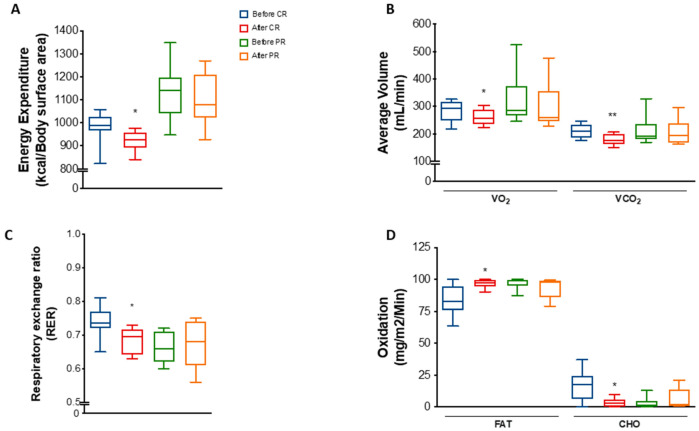
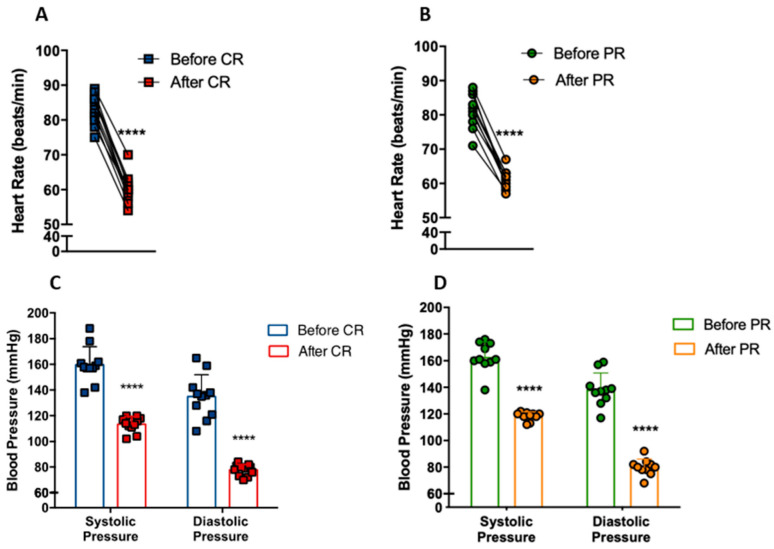
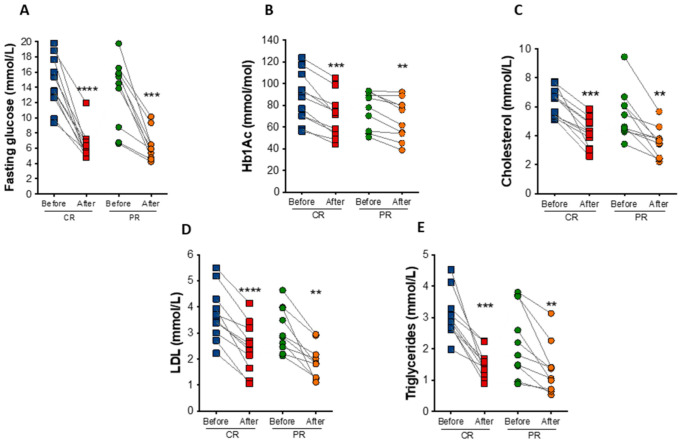
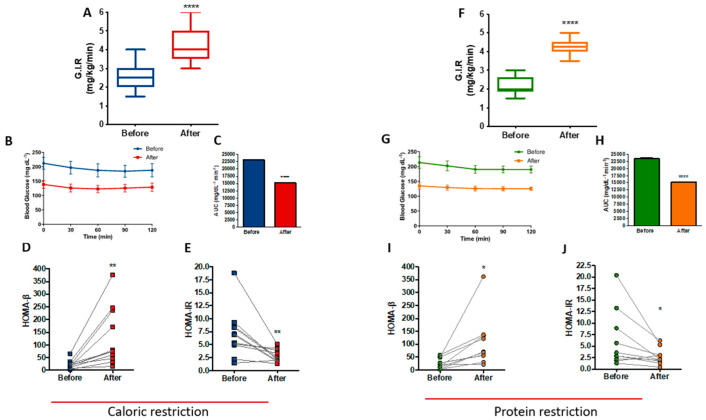
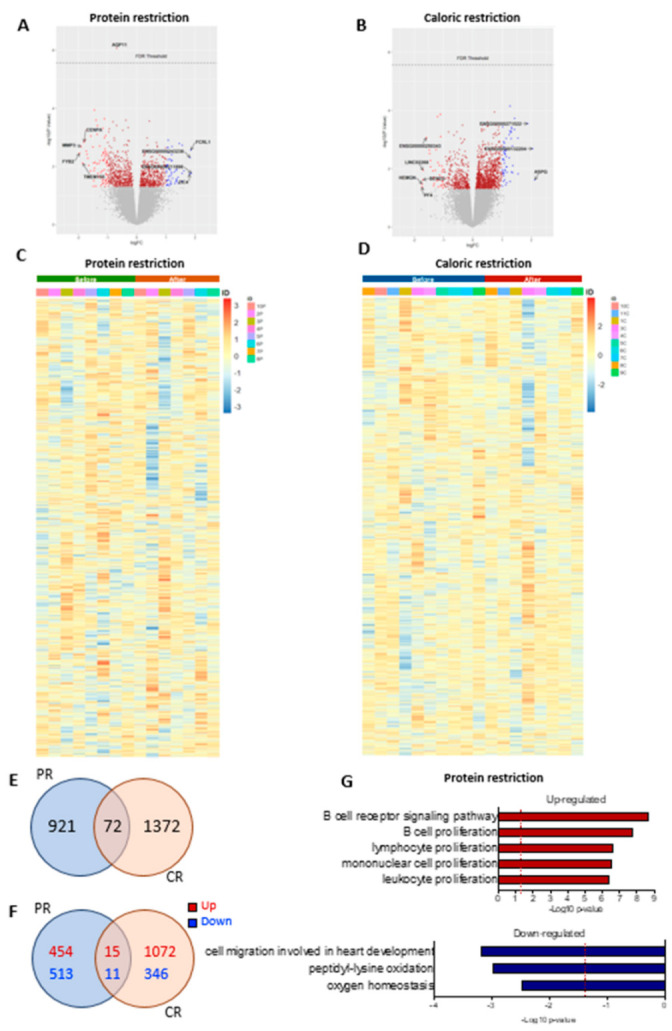
Dietary restriction (DR) reduces adiposity and improves metabolism in patients with one or more symptoms of metabolic syndrome. Nonetheless, it remains elusive whether the benefits of DR in humans are mediated by calorie or nutrient restriction. This study was conducted to determine whether isocaloric dietary protein restriction is sufficient to confer the beneficial effects of dietary restriction in patients with metabolic syndrome. We performed a prospective, randomized controlled dietary intervention under constant nutritional and medical supervision. Twenty-one individuals diagnosed with metabolic syndrome were randomly assigned for caloric restriction (CR; n = 11, diet of 5941 ± 686 KJ per day) or isocaloric dietary protein restriction (PR; n = 10, diet of 8409 ± 2360 KJ per day) and followed for 27 days. Like CR, PR promoted weight loss due to a reduction in adiposity, which was associated with reductions in blood glucose, lipid levels, and blood pressure. More strikingly, both CR and PR improved insulin sensitivity by 62.3% and 93.2%, respectively, after treatment. Fecal microbiome diversity was not affected by the interventions. Adipose tissue bulk RNA-Seq data revealed minor changes elicited by the interventions. After PR, terms related to leukocyte proliferation were enriched among the upregulated genes. Protein restriction is sufficient to confer almost the same clinical outcomes as calorie restriction without the need for a reduction in calorie intake. The isocaloric characteristic of the PR intervention makes this approach a more attractive and less drastic dietary strategy in clinical settings and has more significant potential to be used as adjuvant therapy for people with metabolic syndrome.

Keywords: caloric restriction; cardiovascular disease; insulin resistance; metabolic syndrome; protein restriction; type 2 diabetes.


Conflict of interest statement

The authors declare that they have no competing interest.

Figures

Figure 1
Figure 1
Anthropometric changes after caloric restriction (CR) or protein restriction (PR). (A) Body weight (**** p = < 0.0001 and * p = 0.0176). (B) Fat mass comparing before and after caloric or protein restriction (*** p = 0.0010 and ** p = 0.0033). (C) Free-fat mass comparing before and after caloric or protein restriction ( p = 0.7929 and p = 0.6464). (D) Waist circumference comparing before and after caloric or protein restriction (*** p = 0.0009 and * p = 0.0325). (E) Hip circumference comparing before and after caloric or protein restriction (** p = 0.0091 and * p = 0.0383). Data are presented in dot-plot format. ANOVA mixed-design analysis of variance was performed.
Figure 2
Figure 2
Energy expenditure and substrate utilization after caloric restriction (CR) or protein restriction (PR). Data obtained using indirect calorimetry. (A) Energy expenditure before and after CR (* p = 0.0311) and before and after PR (ns p = 0.7568). (B) Average volume of VO2 and VCO2 before and after CR (* p = 0.0126 and ** p = 0.0051) and before and after PR (ns p = 0.2736 and ns p = 0.5507). (C) RER (respiratory exchange ratio) before and after CR (* p = 0.0296) and before and after PR (ns p = 0.8571). (D) Lipid (FAT) and carbohydrate (CHO) oxidation before and after CR (* p = 0.0454 and * p = 0.0452) and before and after PR ( p = 0.4281 and p = 0.4270). Data are shown in box plot format. ANOVA mixed-design analysis of variance was performed.
Figure 3
Figure 3
Reduction of cardiovascular disease risk factors after caloric restriction (CR) or protein restriction (PR). (A) Heart rate at rest before and after caloric restriction (**** p = < 0.0001). (B) Heart rate at rest before and after protein restriction (**** p = < 0.0001). (C) Blood pressure before and after caloric restriction (**** p = < 0.0001). (D) Blood pressure before and after protein restriction (**** p = < 0.0001). Data are presented in dot-plot format. Paired t-test was performed.
Figure 4
Figure 4
Biochemical changes after caloric restriction (CR) or protein restriction (PR). (A) Fasting glucose levels (**** p < 0.0001 and *** p = 0.0009). (B) Hemoglobin A1c (HbA1c) levels (*** p = 0.0001 and ** p = 0.0069). (C) Total cholesterol levels (*** p = 0.0002 and ** p = 0.0047). (D) low-density lipoprotein (LDL) cholesterol levels (**** p = <0.0001 and ** p = 0.0026). (E) Triglycerides levels (*** p = 0.0004 and ** p = 0.0097). Data are presented in dot-plot format. ANOVA mixed-design analysis of variance was performed.
Figure 5
Figure 5
Improved insulin sensitivity after caloric restriction (CR) or protein restriction (PR). Results obtained using hyperinsulinemic-euglycemic clamp or HOMA-β and HOMA-IR. (A) Glucose infusion rate (GIR) comparing before and after caloric restriction (**** p = < 0.0001). (B) Glycemic curve during the clamp. (C) Area under the curve of B (**** p = < 0.0001). (D) HOMA-β comparing before and after caloric restriction (** p = 0.0056). (E) HOMA-IR comparing before and after caloric restriction (** p = 0.0057). (F) GIR comparing before and after protein restriction (**** p = < 0.0001). (G) Glycemic curve during the clamp. (H) Area under the curve of G (**** p = < 0.0001). (I) HOMA-β comparing before and after protein restriction (* p = 0.0199). (J) HOMA-IR comparing before and after protein restriction (* p = 0.0460). Data are shown in box plot and dot plot format. Paired t-test was performed.
Figure 6
Figure 6
Differential gene expression after protein restriction (PR) or caloric restriction (CR). Volcano plots (log2 fold change against −log10 of the p-value) showing distribution of differentially expressed of the ~24,000 transcripts (A) before and after PR, and (B) before and after CR. Heatmap representation of gene expression (upregulation in red and downregulation in blue) of the individual samples comparing before and after PR (n = 8) (C), and before and after CR (n = 10) (D). Venn diagrams of adipose tissue and overlapping genes regulated by PR or CR: (E) total genes, (F) up- and downregulated genes; p-value < 0.05. GO terms enriched in genes upregulated and downregulated in adipose tissue after PR (G).

References

    1. Mooradian A.D. Dyslipidemia in type 2 diabetes mellitus. Nat. Clin. Pract. Endocrinol. Metab. 2009;5:150–159. doi: 10.1038/ncpendmet1066. - DOI - PubMed
    1. Kassi E., Pervanidou P., Kaltsas G., Chrousos G. Metabolic syndrome: Definitions and controversies. BMC Med. 2011;9:48. doi: 10.1186/1741-7015-9-48. - DOI - PMC - PubMed
    1. Speakman J.R., Mitchell S.E. Caloric restriction. Mol. Asp. Med. 2011;32:159–221. doi: 10.1016/j.mam.2011.07.001. - DOI - PubMed
    1. Bodkin N.L., Alexander T.M., Ortmeyer H.K., Johnson E., Hansen B.C. Mortality and morbidity in laboratory-maintained Rhesus monkeys and effects of long-term dietary restriction. J. Gerontol. A Biol. Sci. Med. Sci. 2003;58:212–219. doi: 10.1093/gerona/58.3.B212. - DOI - PubMed
    1. Colman R.J., Anderson R.M., Johnson S.C., Kastman E.K., Kosmatka K.J., Beasley T.M., Allison D.B., Cruzen C., Simmons H.A., Kemnitz J.W., et al. Caloric Restriction delays disease onset and mortality in rhesus monkeys. Science. 2009;325:201–204. doi: 10.1126/science.1173635. - DOI - PMC - PubMed

Publication types

Substances