

Cancer Targeting and Diagnosis: Recent Trends with Carbon Nanotubes
- PMID: 35808119
- PMCID: PMC9268713
- DOI: 10.3390/nano12132283
Cancer Targeting and Diagnosis: Recent Trends with Carbon Nanotubes
Abstract
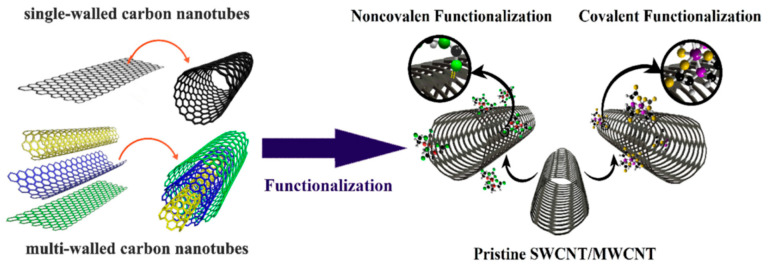
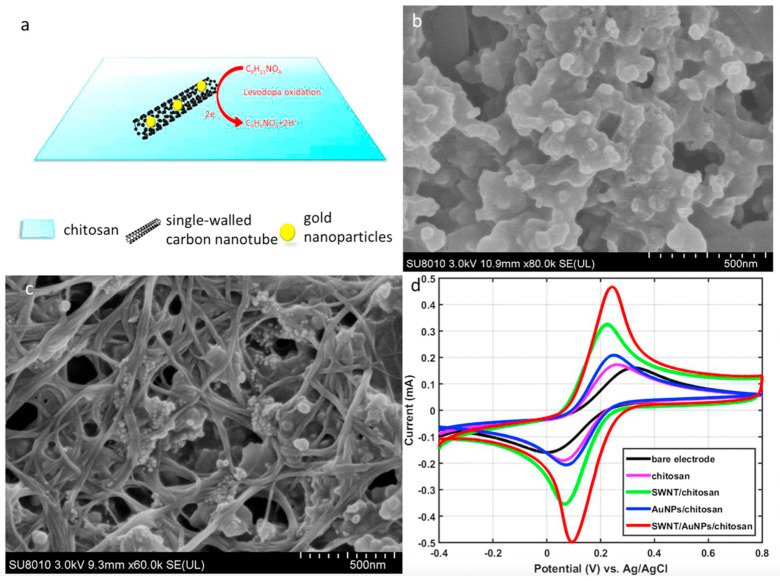
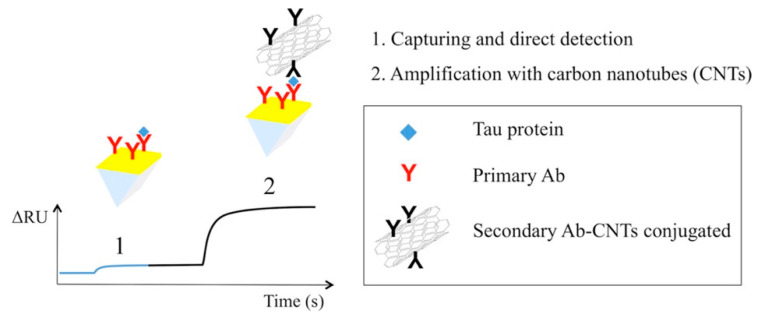
Cancer belongs to a category of disorders characterized by uncontrolled cell development with the potential to invade other bodily organs, resulting in an estimated 10 million deaths globally in 2020. With advancements in nanotechnology-based systems, biomedical applications of nanomaterials are attracting increasing interest as prospective vehicles for targeted cancer therapy and enhancing treatment results. In this context, carbon nanotubes (CNTs) have recently garnered a great deal of interest in the field of cancer diagnosis and treatment due to various factors such as biocompatibility, thermodynamic properties, and varied functionalization. In the present review, we will discuss recent advancements regarding CNT contributions to cancer diagnosis and therapy. Various sensing strategies like electrochemical, colorimetric, plasmonic, and immunosensing are discussed in detail. In the next section, therapy techniques like photothermal therapy, photodynamic therapy, drug targeting, gene therapy, and immunotherapy are also explained in-depth. The toxicological aspect of CNTs for biomedical application will also be discussed in order to ensure the safe real-life and clinical use of CNTs.
Keywords: carbon nanotubes; electrochemical sensing; gene therapy; immunotherapy; photoacoustic imaging; photodymanic therapy; photothermal therapy.
Conflict of interest statement
The authors declare no conflict of interest.
Figures


Similar articles
-
Far-reaching advances in the role of carbon nanotubes in cancer therapy.Life Sci. 2020 Sep 15;257:118059. doi: 10.1016/j.lfs.2020.118059. Epub 2020 Jul 11. Life Sci. 2020. PMID: 32659368 Review.
-
Nanotechnological advances in cancer: therapy a comprehensive review of carbon nanotube applications.Front Bioeng Biotechnol. 2024 Mar 6;12:1351787. doi: 10.3389/fbioe.2024.1351787. eCollection 2024. Front Bioeng Biotechnol. 2024. PMID: 38562672 Free PMC article. Review.
-
The application of hyaluronic acid-derivatized carbon nanotubes in hematoporphyrin monomethyl ether-based photodynamic therapy for in vivo and in vitro cancer treatment.Int J Nanomedicine. 2013;8:2361-73. doi: 10.2147/IJN.S45407. Epub 2013 Jul 1. Int J Nanomedicine. 2013. PMID: 23843694 Free PMC article.
-
Two faces of carbon nanotube: toxicities and pharmaceutical applications.Crit Rev Ther Drug Carrier Syst. 2012;29(1):65-88. doi: 10.1615/critrevtherdrugcarriersyst.v29.i1.20. Crit Rev Ther Drug Carrier Syst. 2012. PMID: 22356722 Review.
-
Therapeutic and diagnostic applications of carbon nanotubes in cancer: recent advances and challenges.J Drug Target. 2024 Dec;32(3):287-299. doi: 10.1080/1061186X.2024.2309575. Epub 2024 Feb 1. J Drug Target. 2024. PMID: 38252035 Review.
Cited by
-
Versatile Porphyrin Arrangements for Photodynamic Therapy-A Review.Nanomaterials (Basel). 2024 Nov 22;14(23):1879. doi: 10.3390/nano14231879. Nanomaterials (Basel). 2024. PMID: 39683268 Free PMC article. Review.
-
A shift in focus towards precision oncology, driven by revolutionary nanodiagnostics; revealing mysterious pathways in colorectal carcinogenesis.J Cancer Res Clin Oncol. 2023 Nov;149(17):16157-16177. doi: 10.1007/s00432-023-05331-8. Epub 2023 Aug 31. J Cancer Res Clin Oncol. 2023. PMID: 37650995 Free PMC article. Review.
-
Optically Active Nanomaterials and Its Biosensing Applications-A Review.Biosensors (Basel). 2023 Jan 4;13(1):85. doi: 10.3390/bios13010085. Biosensors (Basel). 2023. PMID: 36671920 Free PMC article. Review.
-
Cytotoxicity Analysis for the Hydroxyl Functionalized MWCNT Reinforced PMMA Nanocomposites in Oral Squamous Carcinoma (KB) Cells.Polymers (Basel). 2023 Feb 27;15(5):1192. doi: 10.3390/polym15051192. Polymers (Basel). 2023. PMID: 36904431 Free PMC article.
-
Therapeutic approach of carbon nanotube: Revolutionize nanomaterial in biomedical and pharmaceutical sector.J Food Drug Anal. 2024 Dec 15;32(4):412-427. doi: 10.38212/2224-6614.3531. J Food Drug Anal. 2024. PMID: 39752868 Free PMC article. Review.
References
-
- Liu J., Chen Q., Feng L., Liu Z. Nanomedicine for tumor microenvironment modulation and cancer treatment enhancement. Nano Today. 2018;21:55–73. doi: 10.1016/j.nantod.2018.06.008. - DOI
Publication types
Grants and funding
LinkOut - more resources
Full Text Sources
