

Pilot Study for Correlation of Heart Rate Variability and Dopamine Transporter Brain Imaging in Patients with Parkinsonian Syndrome
- PMID: 35808551
- PMCID: PMC9269777
- DOI: 10.3390/s22135055
Pilot Study for Correlation of Heart Rate Variability and Dopamine Transporter Brain Imaging in Patients with Parkinsonian Syndrome
Abstract
Background: Parkinsonian syndrome (PS) is a broad category of neurodegenerative movement disorders that includes Parkinson disease, multiple system atrophy (MSA), progressive supranuclear palsy, and corticobasal degeneration. Parkinson disease (PD) is the second most common neurodegenerative disorder with loss of dopaminergic neurons of the substantia nigra and, thus, dysfunction of the nigrostriatal pathway. In addition to the motor symptoms of bradykinesia, rigidity, tremors, and postural instability, nonmotor symptoms such as autonomic dysregulation (AutD) can also occur. Heart rate variability (HRV) has been used as a measure of AutD and has shown to be prognostic in diseases such as diabetes mellitus and cirrhosis, as well as PD. I-123 ioflupane, a gamma ray-emitting radiopharmaceutical used in single-photon emission computed tomography (SPECT), is used to measure the loss of dopaminergic neurons in PD. Through the combination of SPECT and HRV, we tested the hypothesis that asymmetrically worse left-sided neuronal loss would cause greater AutD.
Methods: 51 patients were enrolled on the day of their standard of care I-123 ioflupane scan for the work-up of possible Parkinsonian syndrome. Demographic information, medical and medication history, and ECG data were collected. HRV metrics were extracted from the ECG data. I-123 ioflupane scans were interpreted by a board-certified nuclear radiologist and quantified by automated software to generate striatal binding ratios (SBRs). Statistical analyses were performed to find correlations between the HRV and SPECT parameters.
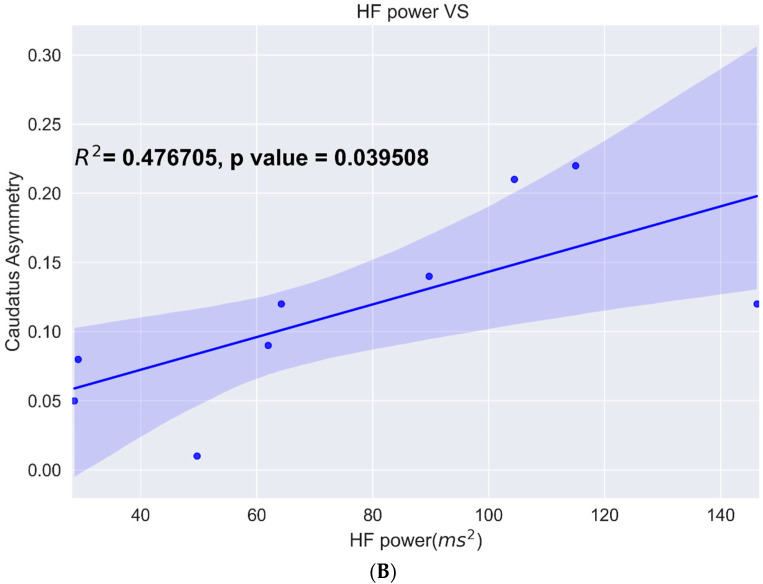
Results: 32 patients were excluded from the final analysis because of normal scans, prior strokes, cardiac disorders and procedures, or cancer. Abnormal I-123 ioflupane scans were clustered using T-SNE, and one-way ANOVA was performed to compare HRV and SBR parameters. The analysis was repeated after the exclusion of patients taking angiotensin-converting enzyme inhibitors, given the known mechanism on autonomic function. Subsequent analysis showed a significant difference between the high-frequency domains of heart rate variability, asymmetry of the caudate SBR, and putamen-to-caudate SBR.
Conclusion: Our results support the hypothesis that more imbalanced (specifically worse left-sided) neuronal loss results in greater AutD.
Keywords: DaTscan; HRV; I-123 ioflupane; Parkinson disease; autonomic dysfunction; autonomic dysregulation; heart rate variability; neurodegeneration.
Conflict of interest statement
P.H. Kuo is an employee of Invicro. He is a consultant and/or speaker for Amgen, Bayer, Chimerix, Eisai, Fusion Pharma, General Electric Healthcare, Invicro, Novartis, and UroToday. He is a recipient of research grants from Blue Earth Diagnostics and General Electric Healthcare. S. Sherman is a paid speaker for General Electric Healthcare.
Figures


References
MeSH terms
Substances
LinkOut - more resources
Full Text Sources
Medical
