. 2022 Jun 30;14(13):2668.
doi: 10.3390/polym14132668.

Study of Dynamic Accumulation in β-D-Glucan in Oat (Avena sativa L.) during Plant Development

Affiliations

Study of Dynamic Accumulation in β-D-Glucan in Oat (Avena sativa L.) during Plant Development

Peter Hozlár et al. Polymers (Basel). .

Abstract

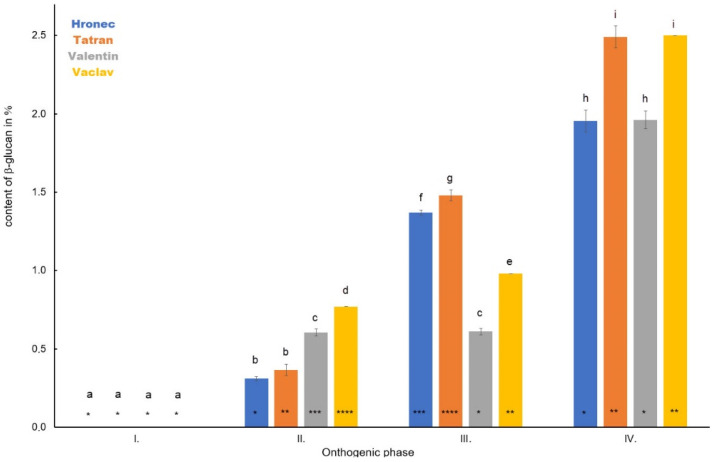
Oat is an important natural source of β-D-glucan. This polysaccharide of the cell wall of selected cereals is known for a number of health-promoting effects, such as reducing the level of cholesterol in the blood serum, stabilizing the level of blood glucose, or enhancing immunity. β-D-glucan has positive effects in the plant itself. There is a lack of information available, but the storage capacity of the polysaccharide and its importance as a protective substance in the plant during mild forms of biotic and abiotic stress are described. The accumulation of β-D-glucan during the ontogenetic development of oats (Avena sativa L.) was determined in the present work. Two naked (Valentin, Vaclav) and two hulled (Hronec, Tatran) oat varieties were used. Samples of each plant (root, stem, leaf, panicle) were collected in four stages of the plant's development (BBCH 13, 30, 55, 71). The average content of the biopolymer was 0.29 ± 0.14% in roots, 0.32 ± 0.11% in stems, 0.48 ± 0.13% in leaves and 1.28 ± 0.79% in panicles, respectively. For root and panicle, in both hulled and naked oat varieties, sampling date was the factor of variability in the content of β-D-glucan. In stems in hulled varieties and leaves in naked varieties, neither the sampling date nor variety influenced the polysaccharide content. The content of β-D-glucan in the leaves of hulled and naked varieties decreased during the first three stages of plant development, but in the stage of milk ripeness the amount increased. The decreasing trend during milk ripeness, was also observed in the roots of both hulled and naked oats. However, in the panicle of hulled and naked oat varieties, the content of β-D-glucan increased during plant growth. Due to practical applications of natural resources of β-D-glucan and isolated β-D-glucan is useful to know the factors influencing its content as well as to ascertain the behavior of the polysaccharide during plant development.

Keywords: accumulation; leaves; oat; plant development; root; β-D-glucan.


Conflict of interest statement

The authors declare no conflict of interest.

Figures

Figure 1
Figure 1
The dynamics in the content of β-D-glucan in roots of four analysed oat varieties during plant development. Different letters indicate a statistically significant difference between individual varieties in specific ontogenetic phase evaluated by ANOVA (LSD, p ≤ 0.05). Star symbols (* and **) represent statistically significant difference between four varieties evaluated for each monitored ontogenetic phase individually by ANOVA (LSD, p ≤ 0.05).
Figure 2
Figure 2
The dynamics in the content of β-D-glucan in stems of four analysed oat varieties during plant development. Different letters indicate a statistically significant difference between individual varieties in specific ontogenetic phase evaluated by ANOVA (LSD, p ≤ 0.05). Star symbols (*, **, ***, and ****) represent statistically significant difference between four varieties evaluated for each monitored ontogenetic phase individually by ANOVA (LSD, p ≤ 0.05).
Figure 3
Figure 3
The dynamics in the content of β-D-glucan in leaves of four analysed oat varieties during plant development. Different letters indicate a statistically significant difference between individual varieties in specific ontogenetic phase evaluated by ANOVA (LSD, p ≤ 0.05). Star symbols (*, **, ***, and ****) represent statistically significant difference between four varieties evaluated for each monitored ontogenetic phase individually by ANOVA (LSD, p ≤ 0.05).
Figure 4
Figure 4
The dynamics in the content of β-D-glucan in panicles of four analysed oat varieties during plant development. Different letters indicate a statistically significant difference between individual varieties in specific ontogenetic phase evaluated by ANOVA (LSD, p ≤ 0.05). Star symbols (*, **, ***, and ****) represent statistically significant difference between four varieties evaluated for each monitored ontogenetic phase individually by ANOVA (LSD, p ≤ 0.05).
Figure 5
Figure 5
Comparison of the content of β-D-glucan in the root of hulled and naked oat samples during plant ontogenesis. Different letters indicate a statistically significant difference between individual seed types (naked and hull) in specific ontogenetic phase evaluated by ANOVA (LSD, p ≤ 0.05). Star symbols (* and **) represent statistically significant difference between naked and hulled samples evaluated for each ontogenetic phase individually by ANOVA (LSD, p ≤ 0.05).
Figure 6
Figure 6
Comparison of the content of β-D-glucan in the stem of hulled and naked oat samples during plant ontogenesis. Different letters indicate a statistically significant difference between individual seed types (naked and hull) in specific ontogenetic phase evaluated by ANOVA (LSD, p ≤ 0.05). Star symbols (* and **) represent statistically significant difference between naked and hulled samples evaluated for each ontogenetic phase individually by ANOVA (LSD, p ≤ 0.05).
Figure 7
Figure 7
Comparison of the content of β-D-glucan in the leaf of hulled and naked oat samples during plant ontogenesis. Different letters indicate a statistically significant difference between individual seed types (naked and hull) in specific ontogenetic phase evaluated by ANOVA (LSD, p ≤ 0.05). Star symbols (* and **) represent statistically significant difference between naked and hulled samples evaluated for each ontogenetic phase individually by ANOVA (LSD, p ≤ 0.05).
Figure 8
Figure 8
Comparison of the content of β-D-glucan in the panicle of hulled and naked oat samples during plant ontogenesis. Different letters indicate a statistically significant difference between individual seed types (naked and hull) in specific ontogenetic phase evaluated by ANOVA (LSD, p ≤ 0.05). Star symbols (* and **) represent statistically significant difference between naked and hulled samples evaluated for each ontogenetic phase individually by ANOVA (LSD, p ≤ 0.05).

References

    1. Maughan P.J., Lee R., Walstead R., Vickerstaff R.J., Fogarty M.C., Brouwer C.R., Reid R.R., Jay J.J., Bekele W.A., Jackson E.W., et al. Genomic Insights from the First Chromosome-Scale Assemblies of Oat (Avena Spp.) Diploid Species. BMC Biol. 2019;17:92. doi: 10.1186/s12915-019-0712-y. - DOI - PMC - PubMed
    1. Finnan J., Burke B., Spink J. The Effect of Nitrogen Timing and Rate on Radiation Interception, Grain Yield and Grain Quality in Autumn Sown Oats. Field Crops Res. 2019;231:130–140. doi: 10.1016/j.fcr.2018.12.001. - DOI
    1. Brownlee I.A. The Physiological Roles of Dietary Fibre. Food Hydrocoll. 2011;25:238–250. doi: 10.1016/j.foodhyd.2009.11.013. - DOI
    1. Chang H.-C., Huang C.-N., Yeh D.-M., Wang S.-J., Peng C.-H., Wang C.-J. Oat Prevents Obesity and Abdominal Fat Distribution, and Improves Liver Function in Humans. Plant Foods Hum. Nutr. 2013;68:18–23. doi: 10.1007/s11130-013-0336-2. - DOI - PubMed
    1. Harland J. 2—Authorised EU Health Claims for Barley and Oat Beta-Glucans. In: Sadler M.J., editor. Foods, Nutrients and Food Ingredients with Authorised EU Health Claims. Woodhead Publishing; Sawston, UK: 2014. pp. 25–45. - DOI

LinkOut - more resources