. 2022 Jul;12(7):e939.
doi: 10.1002/ctm2.939.

Identification of growth hormone receptor as a relevant target for precision medicine in low-EGFR expressing glioblastoma

Affiliations

Identification of growth hormone receptor as a relevant target for precision medicine in low-EGFR expressing glioblastoma

Maïté Verreault et al. Clin Transl Med. 2022 Jul.

Abstract

Objective: New therapeutic approaches are needed to improve the prognosis of glioblastoma (GBM) patients.

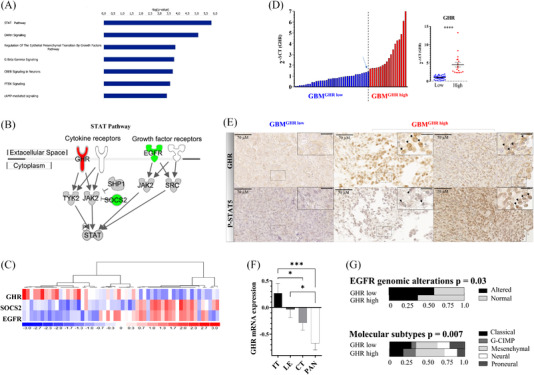
Methods: With the objective of identifying alternative oncogenic mechanisms to abnormally activated epidermal growth factor receptor (EGFR) signalling, one of the most common oncogenic mechanisms in GBM, we performed a comparative analysis of gene expression profiles in a series of 54 human GBM samples. We then conducted gain of function as well as genetic and pharmocological inhibition assays in GBM patient-derived cell lines to functionnally validate our finding.

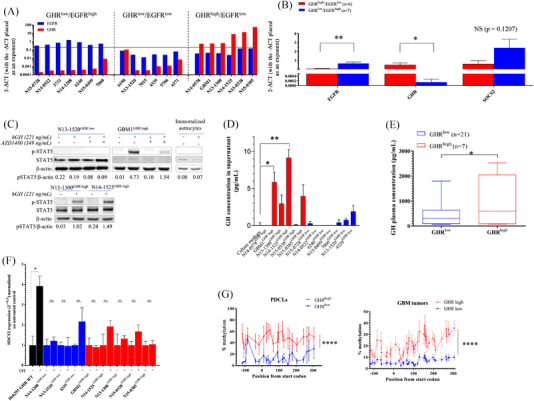
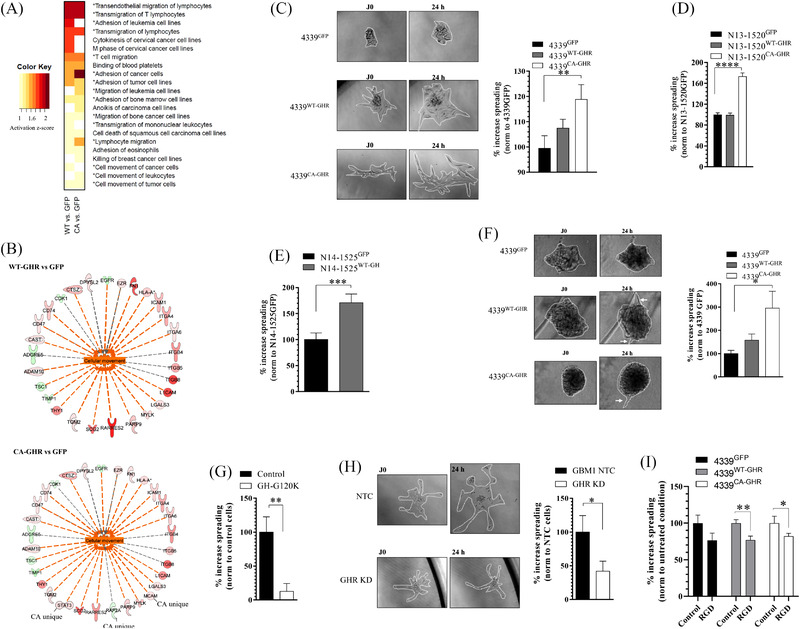
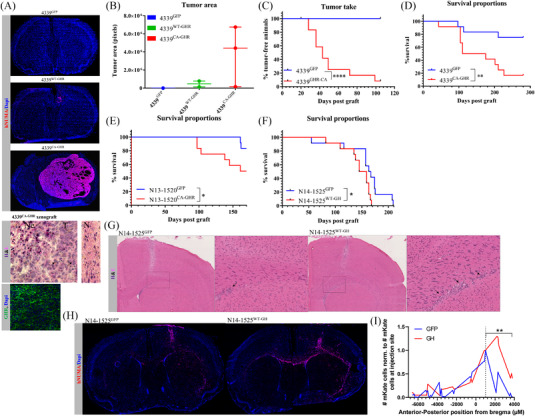
Results: We identified that growth hormone receptor (GHR) signalling defines a distinct molecular subset of GBMs devoid of EGFR overexpression. GHR overexpression was detected in one third of patients and was associated with low levels of suppressor of cytokine signalling 2 (SOCS2) expression due to SOCS2 promoter hypermethylation. In GBM patient-derived cell lines, GHR signalling modulates the expression of proteins involved in cellular movement, promotes cell migration, invasion and proliferation in vitro and promotes tumourigenesis, tumour growth, and tumour invasion in vivo. GHR genetic and pharmacological inhibition reduced cell proliferation and migration in vitro.

Conclusion: This study pioneers a new field of investigation to improve the prognosis of GBM patients.

Keywords: cell migration; comparative analysis; glioblastoma; oncogenicity; pre-clinical models; therapeutic target; tumour invasion.


Conflict of interest statement

The authors declare that there is no conflict of interest that could be perceived as prejudicing the impartiality of the research reported.

Figures

FIGURE 1
FIGURE 1
Newly diagnosed glioblastomas (GBMs) exhibit different epidermal growth factor receptor (EGFR), suppressor of cytokine signalling 2 (SOCS2) and growth hormone receptor (GHR) expression patterns. (A) Top‐most significantly modulated canonical pathways between low (n = 27) versus high (n = 27) EGFR‐expressing GBM. The bar size represents the –log(p). (B) Signal transducer and activator of transcription (STAT) signalling pathway with differential expression status (up/red, down/green) in low versus high‐EGFR‐expressing GBMs. (C) EGFR, SOCS2 and GHR expression heatmap in GBM samples (n = 54). (D) GHR expression in the ONT GBM cohort measured by RT‐qPCR. A break (arrow) can be seen in the overall distribution and was used to define GBMGHR high versus GBMGHR low groups. Comparison of expression of GHR RT‐qPCR data in GBMGHR high (n = 18) versus GBMGHR low (n = 36). Y‐axis represents 2−Δ CT for each gene relative to PPIA expression. ****p ≤ .0001. (E) Immunohistochemistry (IHC) staining of GHR (top) and p‐STAT5 (bottom) shows high‐GHR protein expression in two GBMGHR high cases, whereas no protein expression is detected in a GBMGHR low case. Scale bars in insets correspond to 30 μM. Black arrows show positive cells, whereas grey arrows show negative cells. Additional regions per cases and negative controls can be seen in Figure S3. GHR IHC images shown are representative of 17 GBM cases (6 GBMGHR high, 10 GBMGHR low) analysed. Positive GHR protein expression is found in ≥30% of tumour area of GBMGHR high cases. (F) Distribution of GHR mRNA expression (normalized gene level RNA‐sequencing expression data in FPKM) in tumour anatomic structures defined as part of the Ivy Glioblastoma Atlas project, such as infiltrative tumour (IT), leading edge (LE), cellular tumour (CT) and pseudopalisading cells around necrosis (PAN). ***p ≤ .001; *p ≤ .05. (G) Proportional distribution of EGFR genomic alterations (mutations or amplification) and molecular subtypes in GBMGHR high (n = 60) versus GBMGHR low (n = 456) (TCGA dataset, z‐score of 1.3). Results were analysed by Pearson's chi‐square test.
FIGURE 2
FIGURE 2
Growth hormone receptor (GHR) overexpression is linked with functional STAT5 signalling in vitro, increased circulating hGH in patients and increased suppressor of cytokine signalling 2 (SOCS2) promoter methylation. (A) GHR and epidermal growth factor receptor (EGFR) expression levels in a series of 19 glioblastoma (GBM) patient‐derived cell lines (PDCLs) as determined by RT‐qPCR. Y‐axis represents 2−Δ CT for each gene relative to PPIA expression. The threshold of 2−Δ CT  = .2 (80th percentile value for both genes) is represented by the grey line. (B) Expression data of GHR, EGFR and SOCS2 of samples shown in panel A were averaged for GHRlow and GHRhigh subgroups. (C) Western blot showing p‐STAT5 in PDCLs exposed to 221‐ng/ml growth hormone (GH) (10 nM) with or without 349‐ng/ml AZD1480 JAK2 inhibitor (1 μM). Densitometric values were normalized to actin levels. (D) Concentration of GH (pg/ml) detected in supernatants of GBM PDCLs after 45 h of culture. **p ≤ .01; *p ≤ .05 compared to culture medium. (E) Plasmatic GH concentration in patients with GBMGHR high or GBMGHR low (n = 28). (F) SOCS2 expression level in PDCLs from GHRlow and GHRhigh groups exposed (+) or not (−) to 221 ng/ml (10 nM) GH for 24 h. HEK293 cells stably overexpressing GHR (HEK293 GHR wild type [WT]) were used as positive control. (G) SOCS2 promoter methylation in a panel of PDCLs (n = 9) or GBMs tumours (n = 20), grouped as GHRlow or GHRhigh. ****p ≤ .0001 as calculated by ANOVA two‐way test
FIGURE 3
FIGURE 3
Activation of growth hormone receptor (GHR) signalling promotes cell migration and invasion in vitro. (A) Most activated biological functions in 4339WT‐GHR or 4339CA‐GHR versus 4339GFP (p ≤ .005) inferred from global proteomic analysis. Functions associated with cellular movement are marked with an asterix. (B) Network of molecules whose expression status (up/shades of red, or down/shades of green, p < .05) is predicted to promote activation of cell movement in 4339WT‐GHR versus 4339GFP or 4339CA‐GHR versus 4339GFP (activation z‐score +.9). (C–E) In vitro cell migration assays of patient‐derived cell lines (PDCLs) 4339WT‐GHR or 4339CA‐GHR versus 4339GFP with representative micrographs (C), N13‐1520WT‐GHR or N13‐1520CA‐GHR versus N13‐1520GFP (D) and N14‐1525WT‐GH versus N14‐1524GFP (E). Y‐axis represents the percentage of increase in sphere area over 24 h. (F) In vitro cell invasion assays of 4339WT‐GHR or 4339CA‐GHR versus 4339GFP and representative micrographs. Y‐axis represents the percentage of increase in sphere area over 24 h. (G) Effect of GHR signalling inhibition on in vitro migration of GBM1GHR high. Cells were exposed to 20‐μg/ml hGH‐G120K for 24 h. (H) Effect of GHR expression inhibition on in vitro migration of GBM1GHR high. CRISPR‐induced GHR knockdown (KD) is compared to non‐targeted control (NTC). (I) Effect of RGD peptide integrin antagonist on in vitro migration of 4339GFP, 4339WT‐GHR and 4339CA‐GHR. Cells were exposed to 1‐μg/ml RGD for 24 h. *p ≤ .05; **p ≤ .01; ***p ≤ .001; ****p ≤ .0001
FIGURE 4
FIGURE 4
Activation of growth hormone receptor (GHR) signalling increases proliferation in vitro. (A–C) In vitro cell proliferation of 4339WT‐GHR and 4339CA‐GHR versus 4339GFP (A), N13‐1520WT‐GHR and N13‐1520CA‐GHR versus N13‐1520GFP (B), N14‐1525WT‐GH versus N14‐1524GFP (C) and GBM1 NTC versus GHR KD (D) was measured using Wst‐1 assay and, if significant, validated using CyQUANT assay, as indicated. Y‐axis represents optical density or fluorescence at 72 h relative to GFP condition. *p ≤ .05; **p ≤ .01. (E) In vitro cell proliferation (Wst‐1) of GHRhigh and GHRlow cell lines in response to GH‐G120K. Y‐axis represents optical density at 72 h relative to untreated cells in response to GH‐G120K concentrations shown as Log [μM].
FIGURE 5
FIGURE 5
Growth hormone receptor (GHR) overexpression or GHR signalling activation promotes tumourigenesis and tumour growth. (A) Immunofluorescence micrographs of mouse brains 5 months after inoculation of 4339WT‐GHR, 4339CA‐GHR and 4339GFP showing human‐specific nuclear mitotic antigen (hNuMA) (red), DAPI (blue) and GHR (green). H&E‐stained tissue sections are shown such as normal brain tissue (N), tumour (T), necrosis (Ne) and mitotic events (arrows). (B) Tumour area quantified in pixels from hNuMA‐stained brain sections. (C) Percentage of mice showing established tumours over time following an inoculation of 4339CA‐GHR and 4339GFP. ****p ≤ .001. (D) Survival of mice following an inoculation of 4339CA‐GHR and 4339GFP. **p ≤ .01. (E) Survival of mice following inoculation of N13‐1520CA‐GHR and N13‐1520GFP. *p ≤ .05. (F) Survival of mice following inoculation of N14‐1525WT‐GH and N14‐1525GFP. *p ≤ .05. (G) H&E‐stained tissue of mouse brains 3.5 months after the inoculation of N14‐1525WT‐GH and N14‐1525GFP showing clusters of invasive glioblastoma (GBM) cells in the corpus callosum (purple nuclei shown by the arrows). (H) Immunofluorescence micrographs of mouse brains 3.5 months after the inoculation of N14‐1525WT‐GH and N14‐1525GFP showing human GBM cells (detected by human‐specific nuclear mitotic antigen – hNuMA – in red) and DAPI (blue). (I) Quantification of hNuMA‐positive cells in coronal sections of entire brains harvested from N14‐1525WT‐GH and N14‐1525GFP grafted mice (3.5 months post cell inoculation) normalized to the number of hNuMA‐positive cells at the inoculation site (Bregma + 1000 μM). **p ≤ .01

References

    1. Hess KR, Broglio KR, Bondy ML. Adult glioma incidence trends in the United States, 1977–2000. Cancer. 2004;101:2293‐2299. - PubMed
    1. Louis DN, Ohgaki H, Wiestler OD, et al. The 2007 WHO classification of tumours of the central nervous system. Acta Neuropathol. 2007;114:97‐109. - PMC - PubMed
    1. Bauchet L, Rigau V, Mathieu‐Daude H, et al. French brain tumor data bank: methodology and first results on 10,000 cases. J Neurooncol. 2007;84:189‐199. - PubMed
    1. Stupp R, Mason WP, van den Bent MJ, et al. Radiotherapy plus concomitant and adjuvant temozolomide for glioblastoma. N Engl J Med. 2005;352:987‐996. - PubMed
    1. Keime‐Guibert F, Chinot O, Taillandier L, et al.; Association of French‐Speaking Neuro‐Oncologists . Radiotherapy for glioblastoma in the elderly. N Engl J Med. 2007;356:1527‐1535. - PubMed

Publication types

LinkOut - more resources