

Computational construction of TME-related lncRNAs signature for predicting prognosis and immunotherapy response in clear cell renal cell carcinoma
- PMID: 35808868
- PMCID: PMC9396193
- DOI: 10.1002/jcla.24582
Computational construction of TME-related lncRNAs signature for predicting prognosis and immunotherapy response in clear cell renal cell carcinoma
Abstract
Background: The tumor microenvironment (TME) is closely related to clear cell renal cell carcinoma (ccRCC) prognosis, and immunotherapy response. In current study, comprehensive bio-informative analysis was adopted to construct a TME-related lncRNA signature for immune checkpoint inhibitors (ICIs) and targeted drug responses in ccRCC patients.
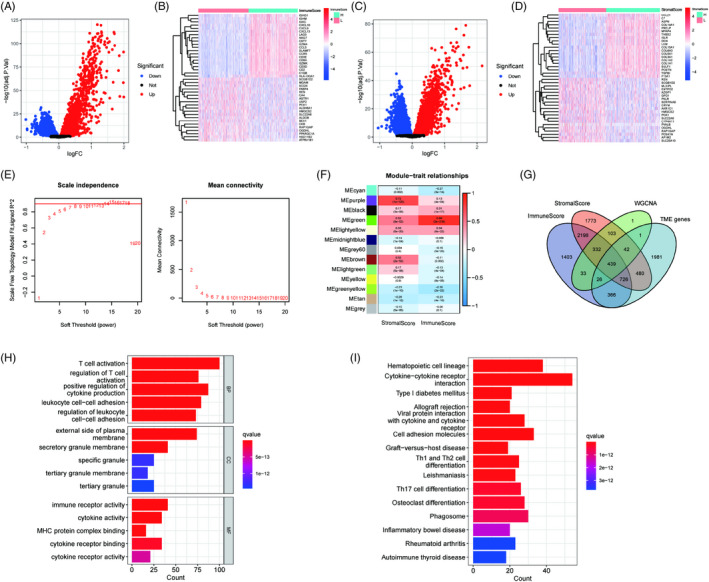
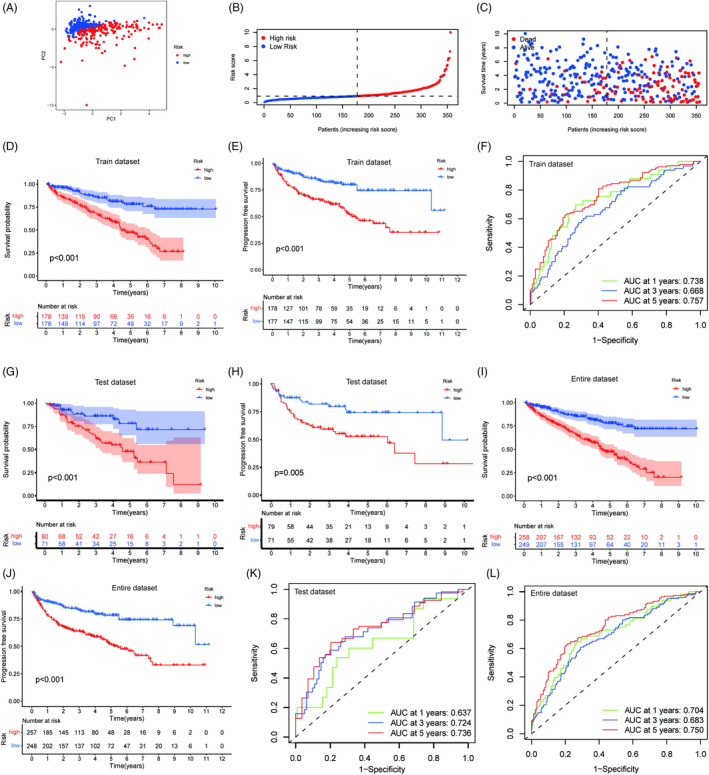
Methods: The TME mRNAs were screened following the immune and stromal scores with the data from GSE15641, GSE29609, GSE36895, GSE46699, GSE53757, and The Cancer Genome Atlas (TCGA)-kidney renal clear cell carcinoma (KIRC). And the TME-related lncRNAs were recognized using correlation analysis. The TME-related lncRNAs prognostic model was constructed using the training dataset. Kaplan-Meier analysis, principal-component analysis, and time-dependent receiver operating characteristic were used to evaluate the risk model. The immune cell infiltration in TME was evaluated using the single-sample gene set enrichment analysis (ssGSEA), ESTIMATE, and microenvironment cell populations counter algorithm. The immunophenoscore (IPS) was used to assess the response to immunotherapy with the constructed model.
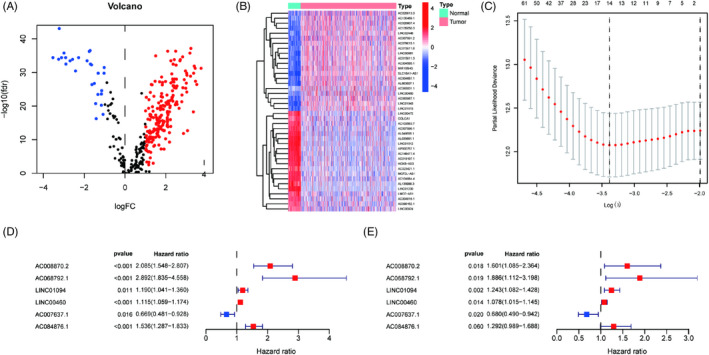
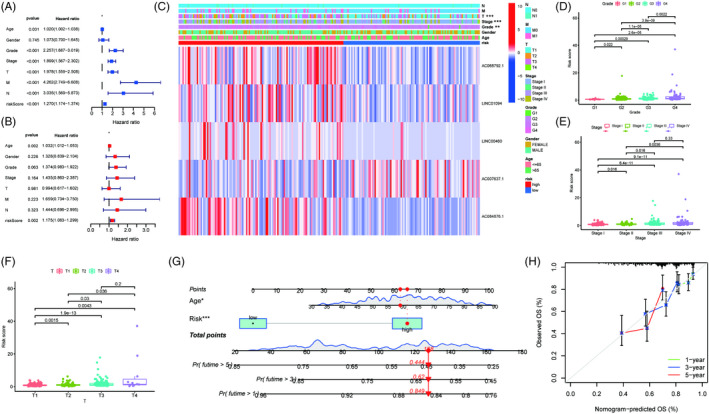
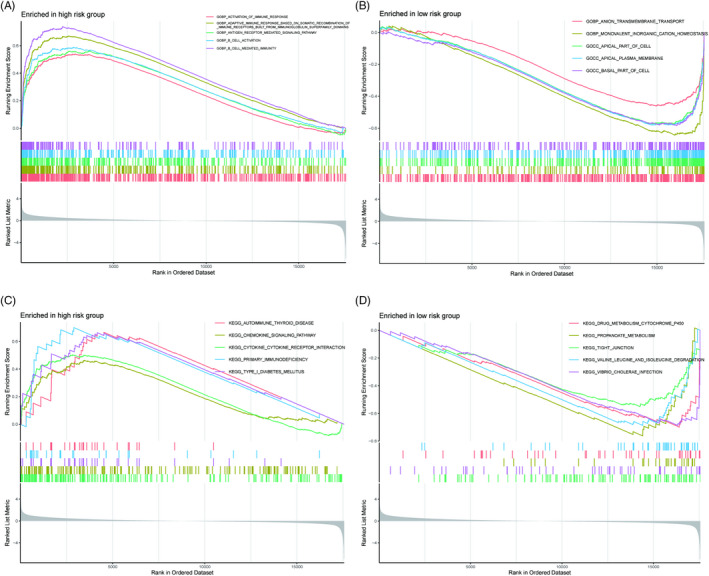
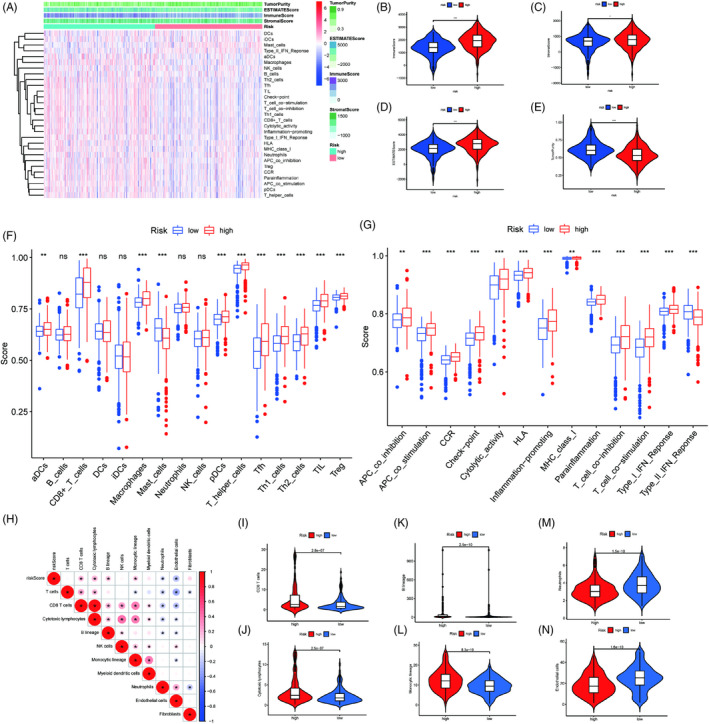
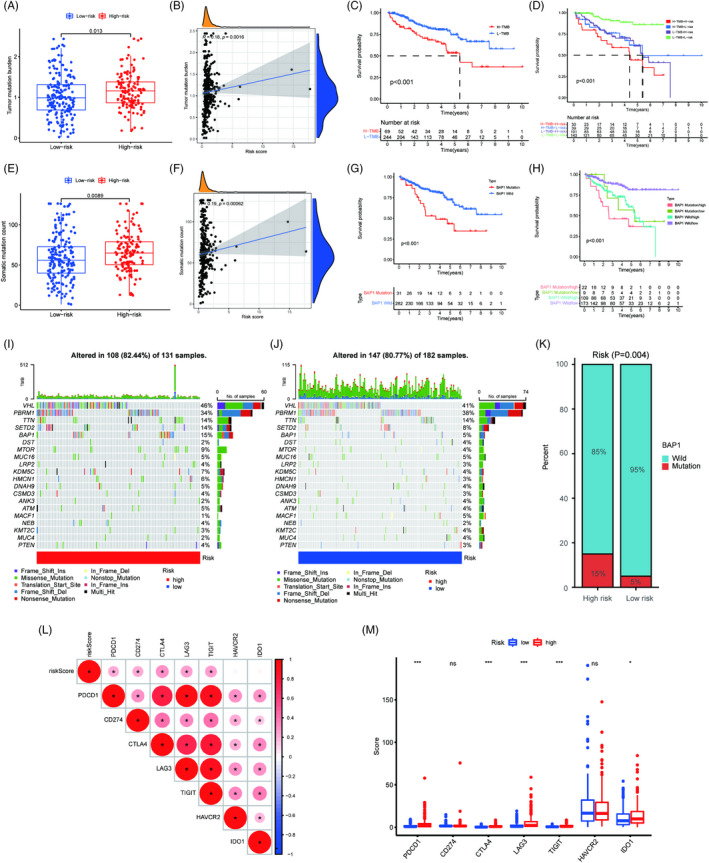
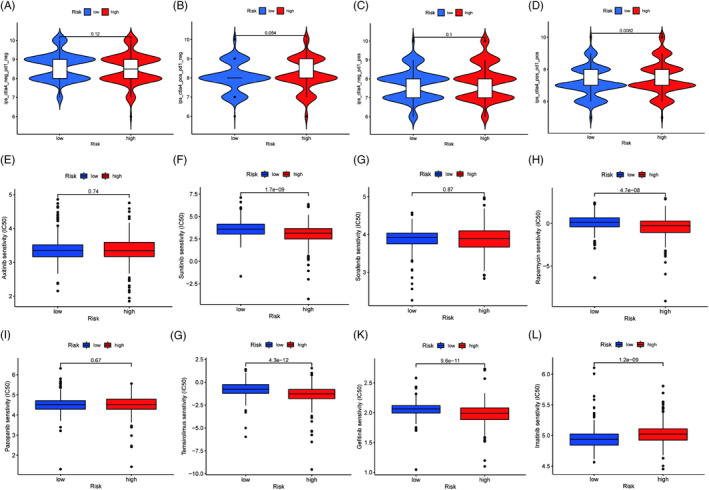
Results: In the current study, 364 TME-related lncRNAs were selected based on the integrated bioinformatical analysis. Six TME-related lncRNAs (LINC00460, LINC01094, AC008870.2, AC068792.1, and AC007637.1) were identified as the prognostic signature in the training dataset and subsequently verified in the testing and entire datasets. Patients in the high-risk group exhibited poor overall survival and disease-free survival than those in the low-risk group. The 1-, 3-, and 5-year areas under the curves of the prognostic signature in the entire dataset were 0.704, 0.683, and 0.750, respectively. The risk score independently predicted ccRCC survival based on univariate and multivariate Cox regression. GSEA analysis suggested that the high-risk group was concentrated on immune-related pathways. The high-risk group were characterized by high immune cell infiltration, high TMB and somatic mutation counters, high IPS-PD-1 + CTLA4 scores, and immune checkpoints expression upregulation, reflecting the higher ICIs response. The half inhibitory concentrations of sunitinib, temsirolimus, and rapamycin were low in the high-risk group.
Conclusion: The TME-related lncRNAs signature constructed could reliably predict the prognosis and immunotherapy response and targeted ccRCC patients' therapy.
Keywords: clear cell renal cell carcinoma; immunotherapy; lncRNA; prognostic signature; tumor microenvironment.
© 2022 The Authors. Journal of Clinical Laboratory Analysis published by Wiley Periodicals LLC.
Conflict of interest statement
The authors declared no conflicts of interest.
Figures
Similar articles
-
Comprehensive analysis of LD-related genes signature for predicting prognosis and immunotherapy response in clear cell renal cell carcinoma.BMC Nephrol. 2024 Sep 10;25(1):298. doi: 10.1186/s12882-024-03735-3. BMC Nephrol. 2024. PMID: 39256647 Free PMC article.
-
A novel necroptosis-related long noncoding RNA model for predicting clinical features, immune characteristics, and therapeutic response in clear cell renal cell carcinoma.Front Immunol. 2023 Aug 2;14:1230267. doi: 10.3389/fimmu.2023.1230267. eCollection 2023. Front Immunol. 2023. PMID: 37600792 Free PMC article.
-
Integrated analysis of a competing endogenous RNA network reveals a ferroptosis-related 6-lncRNA prognostic signature in clear cell renal cell carcinoma.Adv Clin Exp Med. 2024 Dec;33(12):1391-1407. doi: 10.17219/acem/176050. Adv Clin Exp Med. 2024. PMID: 38470002
-
A new CCCH-type zinc finger-related lncRNA signature predicts the prognosis of clear cell renal cell carcinoma patients.Front Genet. 2022 Sep 30;13:1034567. doi: 10.3389/fgene.2022.1034567. eCollection 2022. Front Genet. 2022. PMID: 36246657 Free PMC article.
-
Roles of the Dynamic Tumor Immune Microenvironment in the Individualized Treatment of Advanced Clear Cell Renal Cell Carcinoma.Front Immunol. 2021 Mar 4;12:653358. doi: 10.3389/fimmu.2021.653358. eCollection 2021. Front Immunol. 2021. PMID: 33746989 Free PMC article. Review.
Cited by
-
Low ACADM expression predicts poor prognosis and suppressive tumor microenvironment in clear cell renal cell carcinoma.Sci Rep. 2024 Apr 25;14(1):9533. doi: 10.1038/s41598-024-59746-5. Sci Rep. 2024. PMID: 38664460 Free PMC article.
-
Immune-related risk prognostic model for clear cell renal cell carcinoma: Implications for immunotherapy.Medicine (Baltimore). 2023 Aug 25;102(34):e34786. doi: 10.1097/MD.0000000000034786. Medicine (Baltimore). 2023. PMID: 37653791 Free PMC article.
-
Predicting prognosis, immunotherapy and distinguishing cold and hot tumors in clear cell renal cell carcinoma based on anoikis-related lncRNAs.Front Immunol. 2023 Jun 9;14:1145450. doi: 10.3389/fimmu.2023.1145450. eCollection 2023. Front Immunol. 2023. PMID: 37359524 Free PMC article.
-
A novel LUAD prognosis prediction model based on immune checkpoint-related lncRNAs.Front Genet. 2022 Sep 21;13:1016449. doi: 10.3389/fgene.2022.1016449. eCollection 2022. Front Genet. 2022. PMID: 36212122 Free PMC article.
-
LINC01094: A key long non-coding RNA in the regulation of cancer progression and therapeutic targets.Heliyon. 2024 Sep 7;10(18):e37527. doi: 10.1016/j.heliyon.2024.e37527. eCollection 2024 Sep 30. Heliyon. 2024. PMID: 39309878 Free PMC article. Review.
References
-
- Netea‐Maier RT, Smit JWA, Netea MG. Metabolic changes in tumor cells and tumor‐associated macrophages: a mutual relationship. Cancer Lett. 2018;413:102‐109. - PubMed
MeSH terms
Substances
Grants and funding
LinkOut - more resources
Full Text Sources
Medical
