. 2022 Sep;23(9):e13712.
doi: 10.1002/acm2.13712. Epub 2022 Jul 8.

Automation of radiation treatment planning for rectal cancer

Affiliations

Automation of radiation treatment planning for rectal cancer

Kai Huang et al. J Appl Clin Med Phys. 2022 Sep.

Abstract

Purpose: To develop an automated workflow for rectal cancer three-dimensional conformal radiotherapy (3DCRT) treatment planning that combines deep learning (DL) aperture predictions and forward-planning algorithms.

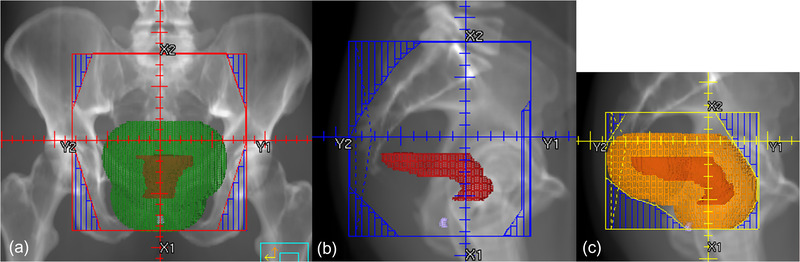
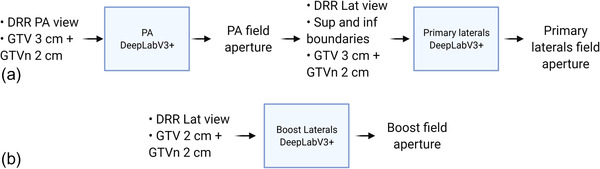
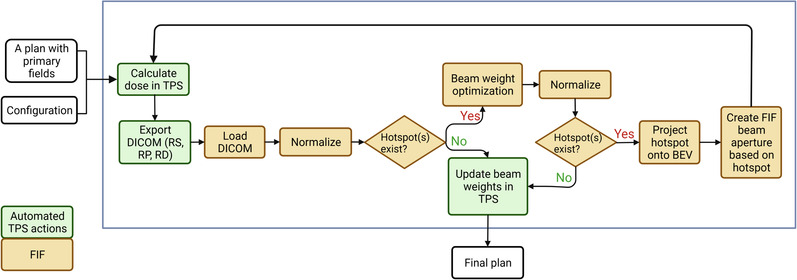
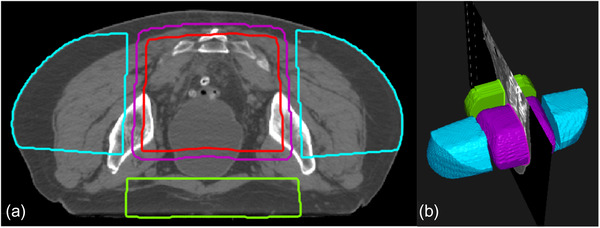
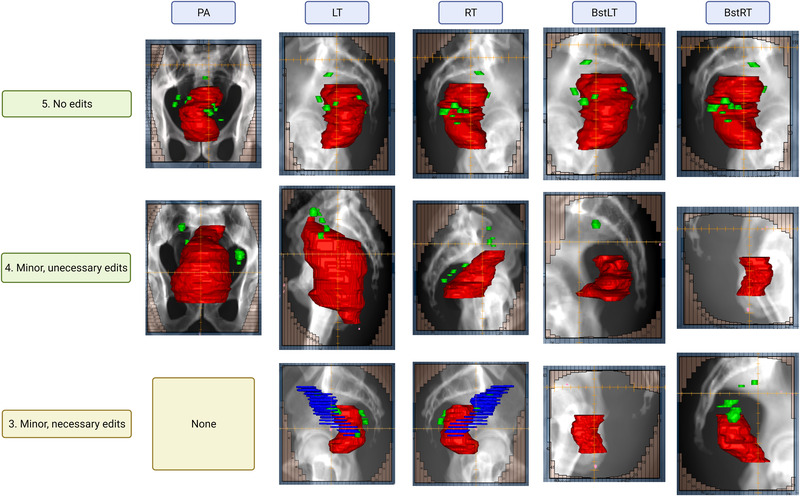
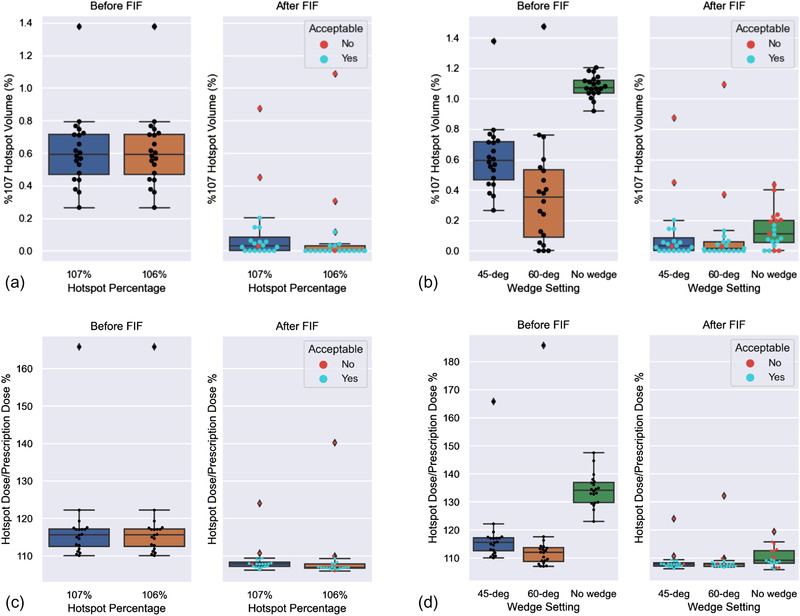
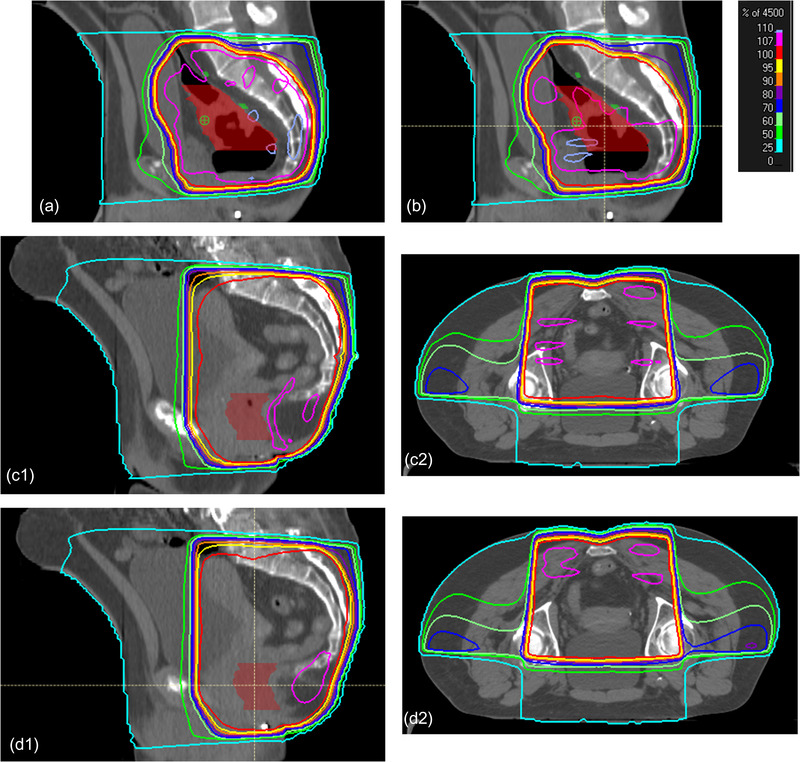
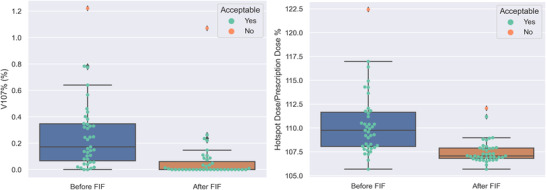
Methods: We designed an algorithm to automate the clinical workflow for 3DCRT planning with field aperture creations and field-in-field (FIF) planning. DL models (DeepLabV3+ architecture) were trained, validated, and tested on 555 patients to automatically generate aperture shapes for primary (posterior-anterior [PA] and opposed laterals) and boost fields. Network inputs were digitally reconstructed radiographs, gross tumor volume (GTV), and nodal GTV. A physician scored each aperture for 20 patients on a 5-point scale (>3 is acceptable). A planning algorithm was then developed to create a homogeneous dose using a combination of wedges and subfields. The algorithm iteratively identifies a hotspot volume, creates a subfield, calculates dose, and optimizes beam weight all without user intervention. The algorithm was tested on 20 patients using clinical apertures with varying wedge angles and definitions of hotspots, and the resulting plans were scored by a physician. The end-to-end workflow was tested and scored by a physician on another 39 patients.

Results: The predicted apertures had Dice scores of 0.95, 0.94, and 0.90 for PA, laterals, and boost fields, respectively. Overall, 100%, 95%, and 87.5% of the PA, laterals, and boost apertures were scored as clinically acceptable, respectively. At least one auto-plan was clinically acceptable for all patients. Wedged and non-wedged plans were clinically acceptable for 85% and 50% of patients, respectively. The hotspot dose percentage was reduced from 121% (σ = 14%) to 109% (σ = 5%) of prescription dose for all plans. The integrated end-to-end workflow of automatically generated apertures and optimized FIF planning gave clinically acceptable plans for 38/39 (97%) of patients.

Conclusion: We have successfully automated the clinical workflow for generating radiotherapy plans for rectal cancer for our institution.

Keywords: automation; deep learning; field-in-field; radiotherapy; rectal cancer.


Conflict of interest statement

The authors declare that there is no conflict of interest that could be perceived as prejudicing the impartiality of the research reported.

Figures

FIGURE 1
FIGURE 1
The figure shows the clinical guidelines for field aperture placement, including primary beams and boost beams. The primary beams have one posterior–anterior (PA) beam and two opposed lateral beams. The boost beams have two opposed lateral beams. The opposed lateral beams are mirror images of each other: (a) PA beam, (b) primary right lateral beam, and (c) right boost beam. The red structure is gross tumor volume (GTV), the green structure is 3‐cm uniform expansion of GTV, and the orange structure is 2‐cm uniform expansion of GTV.
FIGURE 2
FIGURE 2
The figure shows the relationship between each model, and the inputs and outputs of each model. Either the mask of 3‐ or 2‐cm‐expanded gross tumor volume (GTV) combined with 2‐cm‐expanded GTV involved lymph nodes (GTVn) were used as inputs to the DeepLabV3+ architecture. Part (a) shows the inputs and outputs for the posterior–anterior (PA) and primary lateral (Lat) models. Part (b) show the inputs and outputs for the boost Lat model. DRR, digitally reconstructed radiograph; Sup, superior; Inf, inferior
FIGURE 3
FIGURE 3
The figure shows the flowchart of the field‐in‐field (FIF) algorithm. TPS, treatment planning system; BEV, beam's eye view; DICOM, Digital Imaging and Communications in Medicine; RS, DICOM RT Structure file; RP, DICOM RT Plan file; RD, DICOM RT Dose file
FIGURE 4
FIGURE 4
The figure shows an example of the constructed volumes for the experimental setup. The purple volume is the region of high dose, the red volume is pseudo‐region of interest (ROI), the blue volumes are LTRT, and the green volume shows APPA. Part (a) shows a transverse slice, and (b) shows a three‐dimensional view of the volumes.
FIGURE 5
FIGURE 5
The figure shows examples of field aperture prediction for each field at different scores. Red, green, and blue structures are gross tumor volume (GTV), involved lymph nodes (GTVn), and non‐diseased lymph nodes, respectively. The non‐diseased lymph nodes were included due to naming error and caused the predicted aperture to have larger anterior opening than desired.
FIGURE 6
FIGURE 6
The figure shows the boxplots of plans before and after field‐in‐field (FIF) for each configuration; (a) Volume exceeding 107% of Rx as a percentage volume of pseudo‐region of interest (pROI) for different hotspot definitions, (b) Volume exceeding 107% of Rx as a percentage volume of pROI for different wedge settings, (c) For percentage hotspot dose of plans for different hotspot definitions, (d) For percentage hotspot dose of plans for different wedge settings. The plans scored as acceptable (≥ 4) are marked as blue and plans scored as unacceptable (≤ 3) are marked as red.
FIGURE 7
FIGURE 7
Plans with scores from 2 to 5: Part (a) scores 2 because of large 107% volume almost covering the entire planning target volume (PTV) area, part (b) scores 3 because the 107% hotspot was still large, but the plan could be improved by adding an additional subfield, part (c) scores 4 because there was too much 107% volume in the bowel region. Manually lowering the normalization would allow a score of 5. Parts (c1 and c2) are sagittal and transverse views of the same plan. Part (d) scores 5 with minimal hotspot located in the muscle region. Parts (d1 and d2) are sagittal and transverse views of the same plan.
FIGURE 8
FIGURE 8
The figure shows (left) the volume exceeding 107% Rx as a percentage of pseudo‐region of interest (pROI), that is, V107% (%) and (right) the percentage hotspot of primary fields before and after field‐in‐field (FIF) in end‐to‐end testing.

References

    1. Sung H, Ferlay J, Siegel RL, et al. Global cancer statistics 2020: GLOBOCAN estimates of incidence and mortality worldwide for 36 cancers in 185 countries. CA Cancer J Clin. 2021;71(3):209‐249. doi:10.3322/caac.21660 - DOI - PubMed
    1. Kamran S, Mamon H, Wo J. Rectal and column cancer: radiation therapy planning. In: Hong T, Das P, eds. Radiation Therapy for Gastrointestinal Cancers. 1st ed. Springer International Publishing; 2017. Accessed October 15, 2020. 10.1007/978-3-319-43115-4 - DOI
    1. Wo JY, Anker CJ, Ashman JB, et al. Radiation therapy for rectal cancer: executive summary of an ASTRO clinical practice guideline. Pract Radiat Oncol. 2020;11(1):13‐25. doi:10.1016/j.prro.2020.08.004 - DOI - PubMed
    1. Herman J, Pawlik T. Colorectal cancer: radiation therapy for colorectal adenocarcinoma: external beam and intraoperative radiation therapy. In: Gearhart S, Ahuja N, eds. Early Diagnosis and Treatment of Cancer Series. Elsevier Health Sciences; 2010. https://books.google.com/books?id=dGbN5R‐r_WkC
    1. Minsky BD. Pelvic radiation therapy in rectal cancer: Technical considerations. Semin Radiat Oncol. 1993;3(1):42‐47. doi:10.1016/S1053-4296(05)80076-1 - DOI - PubMed

MeSH terms