. 2022 Aug;21(8):e13660.
doi: 10.1111/acel.13660. Epub 2022 Jul 8.

DAF-2/insulin IGF-1 receptor regulates motility during aging by integrating opposite signaling from muscle and neuronal tissues

Affiliations

DAF-2/insulin IGF-1 receptor regulates motility during aging by integrating opposite signaling from muscle and neuronal tissues

Charline Roy et al. Aging Cell. 2022 Aug.

Abstract

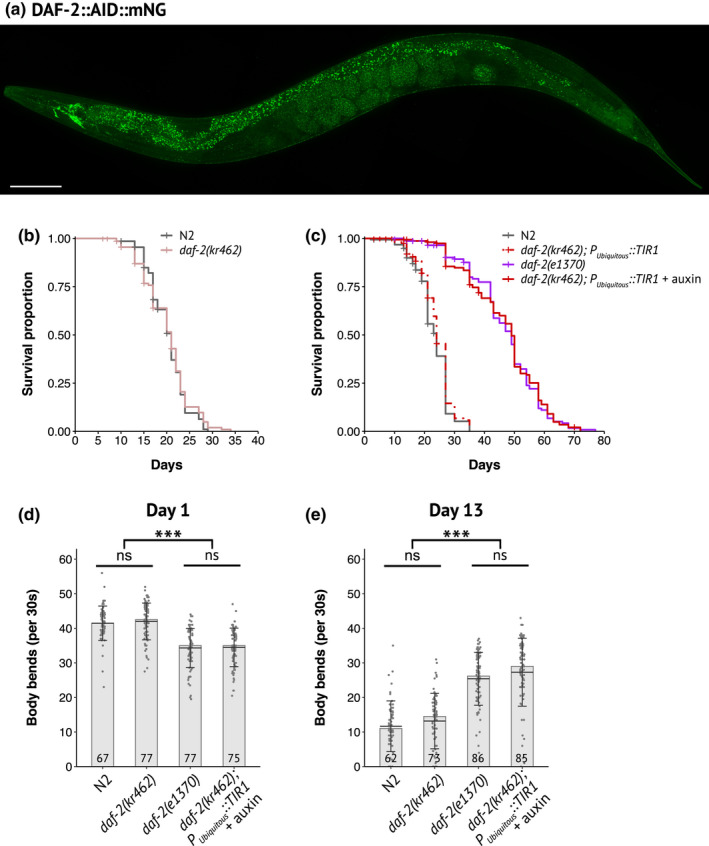
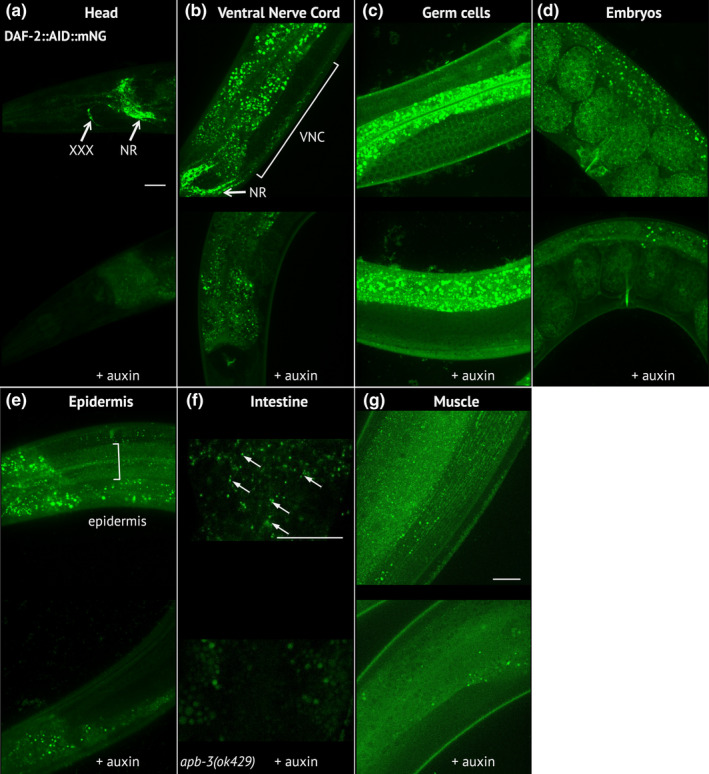
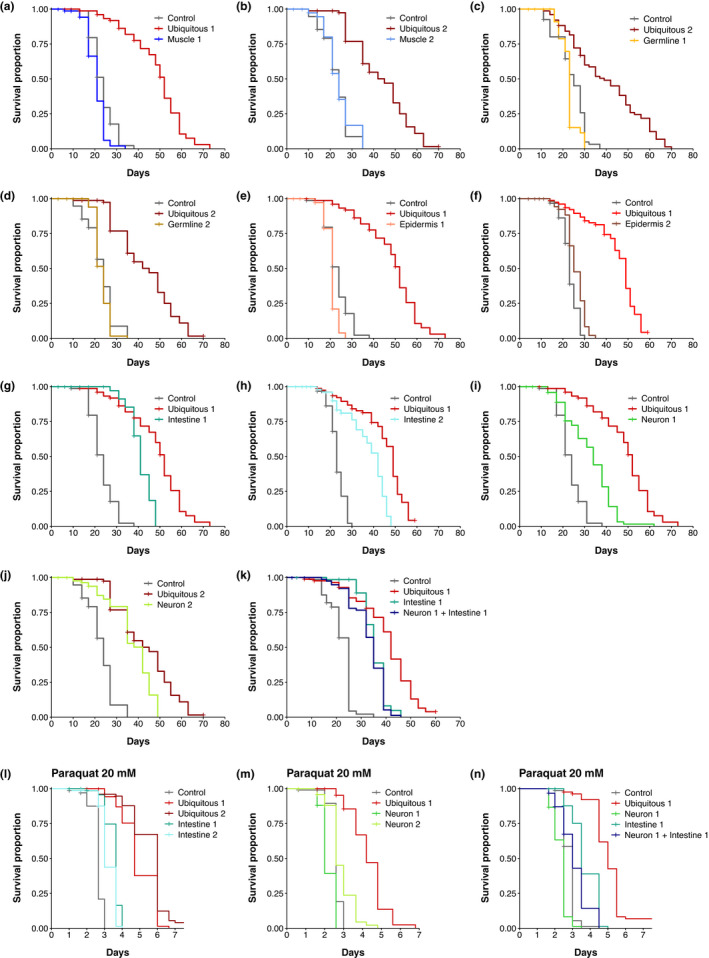
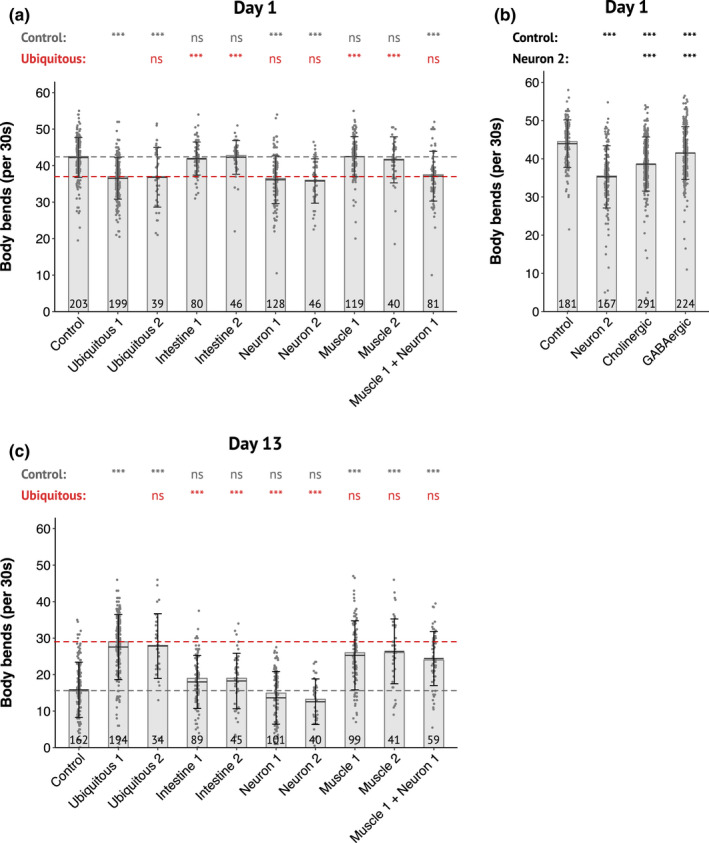
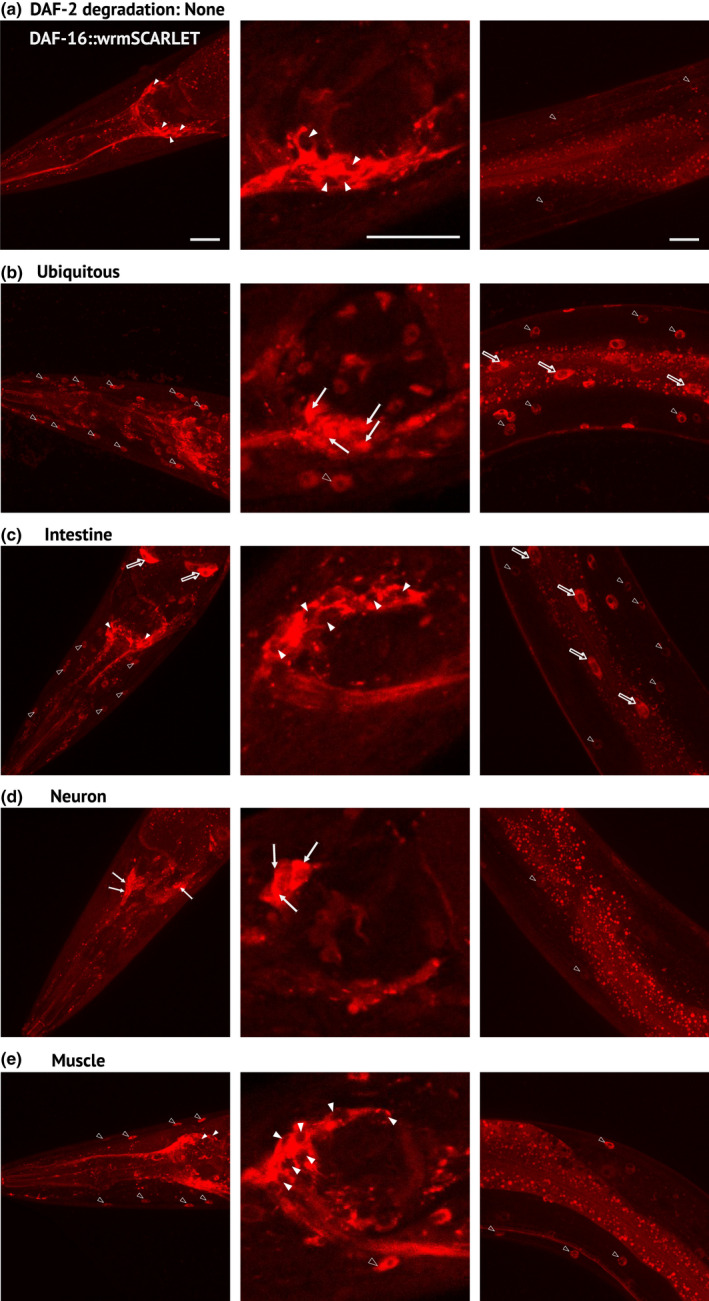
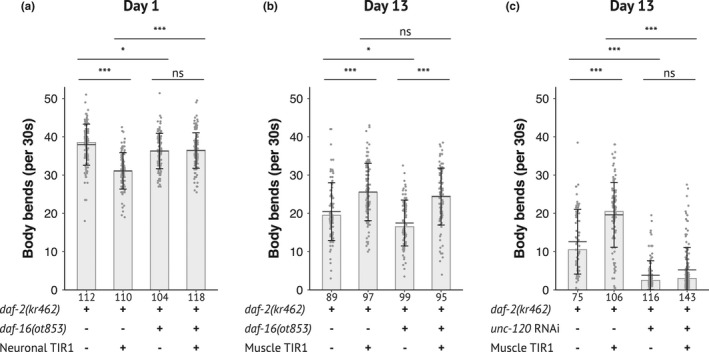
During aging, preservation of locomotion is generally considered an indicator of sustained good health, in elderlies and in animal models. In Caenorhabditis elegans, mutants of the insulin-IGF-1 receptor DAF2/IIRc represent a paradigm of healthy aging, as their increased lifespan is accompanied by a delay in age-related loss of motility. Here, we investigated the DAF-2/IIRc-dependent relationship between longevity and motility using an auxin-inducible degron to trigger tissue-specific degradation of endogenous DAF-2/IIRc. As previously reported, inactivation of DAF-2/IIRc in neurons or intestine was sufficient to extend the lifespan of worms, whereas depletion in epidermis, germline, or muscle was not. However, neither intestinal nor neuronal depletion of DAF-2/IIRc prevented the age-related loss of motility. In 1-day-old adults, DAF-2/IIRc depletion in neurons reduced motility in a DAF-16/FOXO dependent manner, while muscle depletion had no effect. By contrast, DAF-2 depletion in the muscle of middle-age animals improved their motility independently of DAF-16/FOXO but required UNC-120/SRF. Yet, neuronal or muscle DAF-2/IIRc depletion both preserved the mitochondria network in aging muscle. Overall, these results show that the motility pattern of daf-2 mutants is determined by the sequential and opposing impact of neurons and muscle tissues and can be dissociated from the regulation of the lifespan. This work also provides the characterization of a versatile tool to analyze the tissue-specific contribution of insulin-like signaling in integrated phenotypes at the whole organism level.

Keywords: daf-2; DAF-16/FOXO; UNC-120/SRF; insulin/IGF-1 signaling; lifespan; mitochondria; motility; oxidative stress.


Conflict of interest statement

The authors declare no conflict of interest.

Figures

FIGURE 1
FIGURE 1
Expression pattern of DAF‐2::AID::mNG and functional validation of its degradation by the auxin‐inducible system. (a) Image of DAF‐2::AID::mNG in 1‐day‐old daf‐2(kr462) adult. Scale bar: 100 μm. (b) Survival curves of control (N2) and daf‐2(kr462) animals (N = 2, n = 141 and 138 for N2 and daf‐2(kr462), respectively). (c) Survival curves of N2, daf‐2(e1370) mutants, and worms with ubiquitous depletion of DAF‐2. Data have been pooled from two independent experiments (n = 155–160 for each genotype) in which two different Peft‐3::TIR1 containing strains were tested. See Table S1 for strain description and Table S2 for detailed lifespan data, replicates, and statistics. (d, e) Body bends frequency at day 1 (d) and day 13 (e) of adulthood of N2, daf‐2(e1370), or daf‐2(kr462) worms, with or without ubiquitous expression of TIR1. The number of animals scored is indicated in each bar and corresponds to the pool of two experiments (see Figure 4 for more replicates). Bars indicate median values, means are represented by black horizontal lines, and brackets show standard deviations, ns: non‐significant, ***: p < 0.001, Kruskal–Wallis and Dunn's post hoc test with FDR method for adjusting p‐value. All experiments were performed at 20°C
FIGURE 2
FIGURE 2
DAF‐2::AID::mNG is effectively downregulated in the presence of ubiquitously expressed TIR1 after auxin treatment. (a–g) Images of DAF‐2::AID::mNG in 1‐day‐old daf‐2(kr462) adults expressing ubiquitous TIR1 and grown in the absence of auxin (upper panels) or after 24 h of auxin treatment (lower panels). Images focus on specific body regions: the head (a), showing strong expression in the nerve ring (NR) and the XXX cells; the neuronal cell bodies of the ventral nerve cord (VNC) (b); the proliferating germ cells (c); the embryos (d); the epidermal syncytium (e); the intestine (f) and the body wall muscles (g). For the intestine (f), images were taken in apb‐3(ok429) mutant background in order to reduce unspecific intestinal autofluorescence (arrows indicate the specific DAF‐2::AID::mNG associated signal). In all images, the remaining staining of the gut after auxin treatment corresponds to nonspecific autofluorescence that varies between animals. Similar results were obtained in 7‐day‐old animals (data not shown). Scale bars: 20 μm
FIGURE 3
FIGURE 3
Inactivation of DAF‐2 in neurons or in the gut is sufficient to increase lifespan. (a–k) Survival curves of animals with DAF‐2 depletion in all cells (a–k), muscle (a, b), germline (c, d), epidermis (e, f), intestine (g, h), neurons (i, j), or neurons and intestine (k). Numbers (e.g. Muscle 1, Muscle 2) refer to distinct alleles driving TIR1 expression (see Table S1). For each condition, n is about 80 individuals. Some experiments were split in separate graphs for clarity; thus, some graphs share the same negative and positive controls: (a), (e), (g), (i); (b), (d), (j); (f) and (h). The control conditions correspond to the N2 or daf‐2(kr462) strains, in the presence of EtOH or auxin, whose lifespans did not show significant differences. (l–n) Survival curves of animals with DAF‐2 depletion in all cells (l–n), intestine (l), neurons (m), or neurons and intestine (n) in presence of 20 mM paraquat. Controls correspond to daf‐2(kr462). All strains have been treated with auxin. For each condition, 75 to 100 individuals have been assayed. For detailed lifespan data, replicates, statistics, and summary of independent assays see Table S2 and Figure S2
FIGURE 4
FIGURE 4
DAF‐2 degradation in neurons or muscles differentially alters motility in an age‐dependent manner. (a–c) Body bends frequency of 1‐day‐old (a, b) and 13‐day‐old (c) adults with depletion of DAF‐2 in all cells or in the intestine, muscle, neurons or muscle and neurons as indicated. Control corresponds to daf‐2(kr462) in presence of auxin. Numbers (e.g., Muscle 1, Muscle 2) refer to distinct alleles driving TIR1 expression (see Table S1). (a and c) Pooled data from 5 independent experiments. Each replicate included the control strain and several tissue‐specific strains. (b) Pooled data from 7 independent experiments in which were assayed 4 and 3 independent lines for depletion of DAF‐2 in cholinergic or GABAergic neurons, respectively. The number of animals scored is indicated in each bar. The bars correspond to the median values, the means are represented by black horizontal lines, and brackets show standard deviations. The dotted lines correspond to the median values for the control (gray) and ubiquitous (red) strains. Comparisons were done with Kruskal–Wallis, Dunn post hoc tests with FDR method to adjust p‐value, ns: not significant, ***: p adjusted <0.001. Statistics are presented as two lines that include comparison with the control strain or with one specific strain (ubiquitous 1 for (a and c) and neuron 2 for (b))
FIGURE 5
FIGURE 5
Regulation of DAF‐16 subcellular localization by tissue‐specific depletion of DAF‐2 (a‐e) Images of DAF‐16::wrmSCARLET in the head (left and middle panels) or the anterior body (right panels) of 1‐day‐old daf‐16(kr535); daf‐2(kr462) adults without (a) or with ubiquitous (b), intestinal (c), neuronal (d) or muscular (e) depletion of DAF‐2 caused by 24 h of auxin treatment (b–e). Empty arrowheads, full arrows and empty arrows indicate muscle, neuron and intestinal nuclei, respectively; full arrowheads correspond to the cytosol of neurons. For numbers and percentage of worms with a strong DAF‐16::wrmSCARLET nuclear signal, see Table S4. Scale bars: 20 μm
FIGURE 6
FIGURE 6
DAF‐16 is required for motility regulation when DAF‐2 is inactivated in neurons but not in muscles. Body bends frequency of 1‐day‐old (a) and 13‐day‐old (b, c) adults with depletion of DAF‐2 and DAF‐16 in neurons or muscle (a, b) or with down‐regulation of unc‐120 by RNAi in a rrf‐3(pk1426) genetic background (c) (see Experimental procedure and Table S1 for detailed genotype of strains). Data from three independent experiments were pooled. The number of animals scored is indicated under each bar. The bars correspond to the median values, the means are represented by black horizontal lines, and brackets show standard deviations. Comparisons were done with Kruskal–Wallis, Dunn post hoc tests with FDR method to adjust p‐value, ns: not significant, *: p adjusted <0.05, ***: p adjusted <0.001

Similar articles

Cited by

References

    1. Aghayeva, U. , Bhattacharya, A. , Sural, S. , Jaeger, E. , Churgin, M. , Fang‐Yen, C. , & Hobert, O. (2021). DAF‐16/FoxO and DAF‐12/VDR control cellular plasticity both cell‐autonomously and via interorgan signaling. PLoS Biology, 19, e3001204. 10.1371/journal.pbio.3001204 - DOI - PMC - PubMed
    1. Bansal, A. , Zhu, L. J. , Yen, K. , & Tissenbaum, H. A. (2015). Uncoupling lifespan and healthspan in Caenorhabditis elegans longevity mutants. Proceedings of the National Academy of Sciences of the United States of America, 112, E277–E286. 10.1073/pnas.1412192112 - DOI - PMC - PubMed
    1. Berendzen, K. M. , Durieux, J. , Shao, L. W. , Tian, Y. , Kim, H. E. , Wolff, S. , Liu, Y. , & Dillin, A. (2016). Neuroendocrine coordination of mitochondrial stress signaling and proteostasis. Cell, 166, 1553‐1563.e10. 10.1016/j.cell.2016.08.042 - DOI - PMC - PubMed
    1. Bhattacharya, A. , Aghayeva, U. , Berghoff, E. G. , & Hobert, O. (2019). Plasticity of the electrical connectome of C. elegans . Cell, 176, 1174‐1189.e16. 10.1016/j.cell.2018.12.024 - DOI - PMC - PubMed
    1. Boothe, T. , Lim, G. E. , Cen, H. , Skovsø, S. , Piske, M. , Li, S. N. , Nabi, I. R. , Gilon, P. , & Johnson, J. D. (2016). Inter‐domain tagging implicates caveolin‐1 in insulin receptor trafficking and Erk signaling bias in pancreatic beta‐cells. Molecular Metabolism, 5, 366–378. 10.1016/j.molmet.2016.01.009 - DOI - PMC - PubMed

Publication types

MeSH terms