. 2022 Sep 28;190(2):1307-1320.
doi: 10.1093/plphys/kiac330.

Two transporters mobilize magnesium from vacuolar stores to enable plant acclimation to magnesium deficiency

Affiliations

Two transporters mobilize magnesium from vacuolar stores to enable plant acclimation to magnesium deficiency

Ren-Jie Tang et al. Plant Physiol. .

Abstract

Magnesium (Mg) is an essential metal for chlorophyll biosynthesis and other metabolic processes in plant cells. Mg is largely stored in the vacuole of various cell types and remobilized to meet cytoplasmic demand. However, the transport proteins responsible for mobilizing vacuolar Mg2+ remain unknown. Here, we identified two Arabidopsis (Arabidopsis thaliana) Mg2+ transporters (MAGNESIUM TRANSPORTER 1 and 2; MGT1 and MGT2) that facilitate Mg2+ mobilization from the vacuole, especially when external Mg supply is limited. In addition to a high degree of sequence similarity, MGT1 and MGT2 exhibited overlapping expression patterns in Arabidopsis tissues, implying functional redundancy. Indeed, the mgt1 mgt2 double mutant, but not mgt1 and mgt2 single mutants, showed exaggerated growth defects as compared to the wild type under low-Mg conditions, in accord with higher expression levels of Mg-starvation gene markers in the double mutant. However, overall Mg level was also higher in mgt1 mgt2, suggesting a defect in Mg2+ remobilization in response to Mg deficiency. Consistently, MGT1 and MGT2 localized to the tonoplast and rescued the yeast (Saccharomyces cerevisiae) mnr2Δ (manganese resistance 2) mutant strain lacking the vacuolar Mg2+ efflux transporter. In addition, disruption of MGT1 and MGT2 suppressed high-Mg sensitivity of calcineurin B-like 2 and 3 (cbl2 cbl3), a mutant defective in vacuolar Mg2+ sequestration, suggesting that vacuolar Mg2+ influx and efflux processes are antagonistic in a physiological context. We further crossed mgt1 mgt2 with mgt6, which lacks a plasma membrane MGT member involved in Mg2+ uptake, and found that the triple mutant was more sensitive to low-Mg conditions than either mgt1 mgt2 or mgt6. Hence, Mg2+ uptake (via MGT6) and vacuolar remobilization (through MGT1 and MGT2) work synergistically to achieve Mg2+ homeostasis in plants, especially under low-Mg supply in the environment.


Figures

Figure 1
Figure 1
Expression patterns of MGT1 and MGT2 in Arabidopsis. A, GUS expression driven by MGT1 promoter (Pro:MGT1) or MGT2 promoter (Pro:MGT2) in transgenic Arabidopsis plants. Histochemical GUS staining was performed in the seedlings and various adult tissues. (a and b), One-day-old germinating seed, scale bar = 0.5 mm; (c and d) 3-d-old seedling, scale bar = 1 mm; (e and f) 5-d-old seedling, scale bar = 2 mm; (g and h) primary root from 10-d old seedlings, scale bar = 1 mm; (i and j) rosette leaves of 28-d-old plants, scale bar = 10 mm; (k and l) cross-section of an inflorescence stem, scale bar = 0.05 mm; (m and n) flower, scale bar = 1 mm; (o and p) silique, scale bar = 1 mm. B, RT-qPCR analysis of transcript levels of MGT1 and MGT2 in different organs of Arabidopsis plants. The relative expression was double normalized against ACTIN2 (AT3G18780) and the expression level in the root. Data represent means ± SD (n = 4) with four independent experimental results shown as dots and error bars denoting SD.
Figure 2
Figure 2
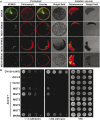
Subcellular localization of MGT1 and MGT2 in the plant cell and functional characterization of MGT1 and MGT2 in the yeast mnr2Δ mutant strain. A, Confocal laser scanning microscopy images of a typical mesophyll protoplast and isolated vacuole transiently expressing fluorescent proteins indicated on the left. In each panel, the VENUS signal, chloroplast fluorescence, overlay, or bright field image from the same cell is shown. Scale bars = 5 μm. B, Complementation test of the yeast mnr2Δ mutant by different MGT transporters. Yeast cells of wild type (DY1514), mnr2Δ, and mnr2Δ transformed with various genes in the p416GPD vector were spotted in YPD (yeast extract, peptone, and dextrose) medium or YPD medium supplemented with 1.5 mM MnCl2 or 200 mM CaCl2 in serial decimal dilutions from left to right. The starting concentration of the first sample on the left is OD600 = 1.0, and therefore from left to right, the concentrations of the four samples represent OD600 = 1.0, 0.1, 0.01, 0.001. Plate cultures were incubated at 28°C and photographed after 3 d. Each experiment was repeated using four independent transformants with similar results.
Figure 3
Figure 3
Phenotypic analysis of mgt1 mgt2 double mutant under different external Mg2+ concentrations. A, Growth phenotype of wild type (Col-0) and mgt1 mgt2 on agarose-solidified medium containing different concentrations of Mg2+. Four-day-old seedlings of Col-0 and mgt1 mgt2 germinated on MS medium were transferred onto one-sixth strength MS medium containing indicated concentrations of Mg2+ in each panel. Photographs were taken on the 10th day after the transfer. B and C, Fresh weight (B) and leaf chlorophyll (C) of 14-d-old seedlings as shown in (A). Data represent means ± SE (n =4). Asterisks indicate statistically significant difference between the Col-0 and mgt1 mgt2 (*P <0.05 by Student’s t test). D, Phenotype of wild-type (Col-0) and mgt1 mgt2 mutant plants during Mg2+-starvation treatment in the hydroponic assay. Wild-type and mutant plants were grown under Mg-replete conditions (250 µM Mg2+) for 2 weeks and then transferred to new hydroponic solutions containing either low Mg2+ (10 µM) or sufficient Mg2+ (250 µM) for another 14 d. Photographs were taken before the transfer and at the end of 14-d treatment, respectively. E–H, Measurement of root (E) and shoot (F) biomass as well as rosette diameter (G) and leaf chlorophyll (H) of Col-0 and mgt1 mgt2 plants on the 14th day after transferring plants to the new hydroponic solutions. Data represent means ± SE (for E, F, and G, n =9; for H, n =6). Asterisks indicate statistically significant difference between the Col-0 and mgt1 mgt2 (*P <0.05 by Student’s t test).
Figure 4
Figure 4
Mg concentration and Mg-starvation marker gene expression in the wild type and mgt1 mgt2 mutant plants. A, Mg concentration in the root and shoot tissues of 2-week-old wild-type (Col-0) and mgt1 mgt2 seedlings grown on the plates containing 0.01 mM (left panel) or 0.25 mM (right panel) Mg2+. Data represent means ± SE (n =8). B, Mg concentration in the root and shoot tissues of Col-0 and mgt1 mgt2 at the end of the Mg2+-starvation treatment in the hydroponic assay. Data represent means ± SE (n =4). C, Mg concentration in different tissues of soil-grown Col-0 and mgt1 mgt2 adult plants. Rosette leaves from 3-week-old plants were sampled as a collection of “young leaf” while rosette leaves from 14-week-old plants were sampled as a collection of “old leaf.” Data represent means ± SE (n =6). From A to C, asterisks indicate statistically significant difference between the Col-0 and mgt1 mgt2 (*P <0.05 by Student’s t test). D, RT-qPCR analysis of ACA13 (AT3G22910), ARD3 (AT2G26400), CAX3 (AT3G51860), CML37 (AT5G42380), CYP81D8 (AT4G37370), GPT2 (AT1G61800), NDB2 (AT4G05020) WRKY46 (AT2G46400), and SEN1(AT4G35770) in the wild-type (Col-0) and mgt1 mgt2 seedlings grown under different concentrations of external Mg2+. The relative expression of each gene was double normalized against the housekeeping gene ACTIN2 (AT3G18780) and the control expression value measured in Col-0 grown under 1.5 mM Mg2+. Data represent means ± SD (n =4).
Figure 5
Figure 5
Suppression of the phenotype of cbl2 cbl3 mutant by additional mutations in MGT1 and MGT2. A, RT-PCR analysis of MGT1, MGT2 as well as CBL2 and CBL3 gene expression in wild-type (Col-0), double mutant (mgt1 mgt2, cbl2 cbl3), and quadruple mutant (mgt1/2/cbl2/3) plants. ACTIN2 was analyzed as an internal control. B, Growth phenotype of 4-week-old plants of different genotypes in the soil. Scale bar = 5 cm. C and D, Rosette diameter (C) and shoot biomass (D) of different genotypes as shown in (B). Data represent means ± SD (n =12). Statistical analyses between different genotypes were performed by one-way ANOVA followed by a Turkey’s multiple comparison test. Different letters indicate significant difference at P <0.05. E, Growth phenotype of 2-week-old young seedlings of different genotypes on the medium containing 0.25 mM or 4 mM Mg2+. F and G, Seedling fresh weight (F) and leaf chlorophyll (G) of different genotypes as shown in (E). Data represent means ± SE (n =4). Columns with different letters indicate statistically significant differences performed by one-way ANOVA followed by a Turkey’s multiple comparison test (P <0.05).
Figure 6
Figure 6
Genetic analysis of the functional synergy of MGT1, MGT2, and MGT6 transporters in Arabidopsis. A, RT-PCR analysis of MGT1, MGT2, and MGT6 gene expression in the wild type (Col-0), mgt1 mgt2, mgt6, and mgt1 mgt2 mgt6 triple mutant. MGT4 (AT3G19640) and ACTIN2 were analyzed as internal controls. B, Growth phenotype of 4-week-old plants of different genotypes in the soil. Scale bar = 5 cm. C, Shoot biomass of different genotypes grown in the soil as shown in (B). Data represent means ± SD (n =16). Statistical analyses between different genotypes were performed by one-way ANOVA followed by a Turkey’s multiple comparison test. Different letters indicate significant difference at P <0.05. D, Growth phenotype of 2-week-old young seedlings of different genotypes on the medium containing various concentrations of Mg2+ as indicated. E–G, Measurement of primary root length (E) and seedling fresh weight (F) and leaf chlorophyll (G) of Col-0, mgt1 mgt2, mgt6, and mgt1 mgt2 mgt6 seedlings as shown in (D). For E, data represent means ± SD (n =12); for (F) and (G), data represents means ± SE of four replicate experiments (n =4). H, RT-qPCR analysis of ACA13, ARD3, CAX3, and CML37 in Col-0, mgt1 mgt2, mgt6, and mgt1 mgt2 mgt6 seedlings grown on the medium containing 1.5 mM or 0.01 mM Mg2+. Data represent means ± SD (n =4). For C, E, F, G, and H, statistical analyses between different genotypes were performed by one-way ANOVA followed by a Turkey’s multiple comparison test. Different letters indicate significant difference at P <0.05.

References

    1. Chen J, Li LG, Liu ZH, Yuan YJ, Guo LL, Mao DD, Tian LF, Chen LB, Luan S, Li DP (2009) Magnesium transporter AtMGT9 is essential for pollen development in Arabidopsis. Cell Res 19: 887–898 - PubMed
    1. Chen YS, Kozlov G, Moeller BE, Rohaim A, Fakih R, Roux B, Burke JE, Gehring K (2021) Crystal structure of an archaeal CorB magnesium transporter. Nat Commun 12: 4028. - PMC - PubMed
    1. Chen ZC, Yamaji N, Horie T, Che J, Li J, An G, Ma JF (2017) A magnesium transporter OsMGT1 plays a critical role in salt tolerance in rice. Plant Physiol 174: 1837–1849 - PMC - PubMed
    1. Chen ZC, Yamaji N, Motoyama R, Nagamura Y, Ma JF (2012) Up-regulation of a magnesium transporter gene OsMGT1 is required for conferring aluminum tolerance in rice. Plant Physiol 159: 1624–1633 - PMC - PubMed
    1. Clough SJ, Bent AF (1998) Floral dip: a simplified method for Agrobacterium-mediated transformation of Arabidopsis thaliana. Plant J 16: 735–743 - PubMed

Publication types

MeSH terms