. 2023 Mar;17(1):169-188.
doi: 10.1007/s12079-022-00685-z. Epub 2022 Jul 9.

Prediction of cellular targets in diabetic kidney diseases with single-cell transcriptomic analysis of db/db mouse kidneys

Affiliations

Prediction of cellular targets in diabetic kidney diseases with single-cell transcriptomic analysis of db/db mouse kidneys

Chenhua Wu et al. J Cell Commun Signal. 2023 Mar.

Abstract

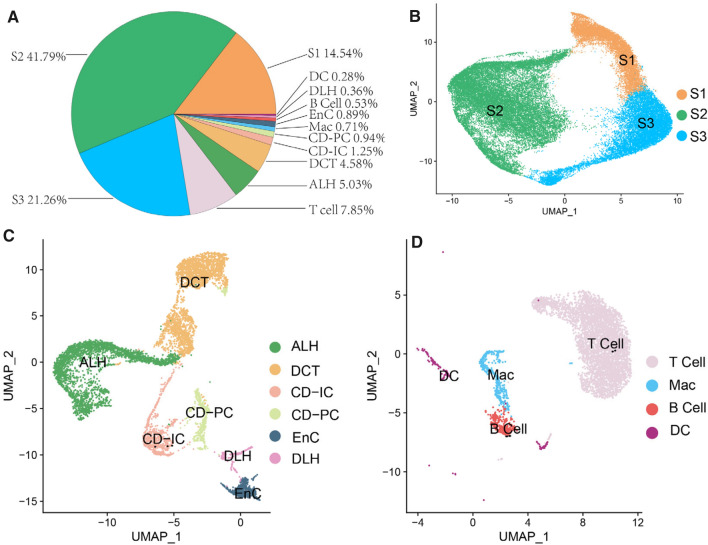
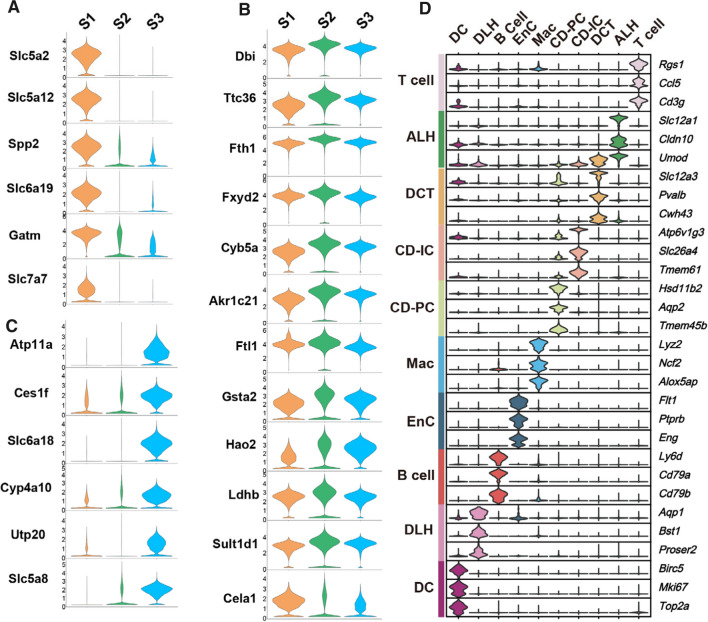
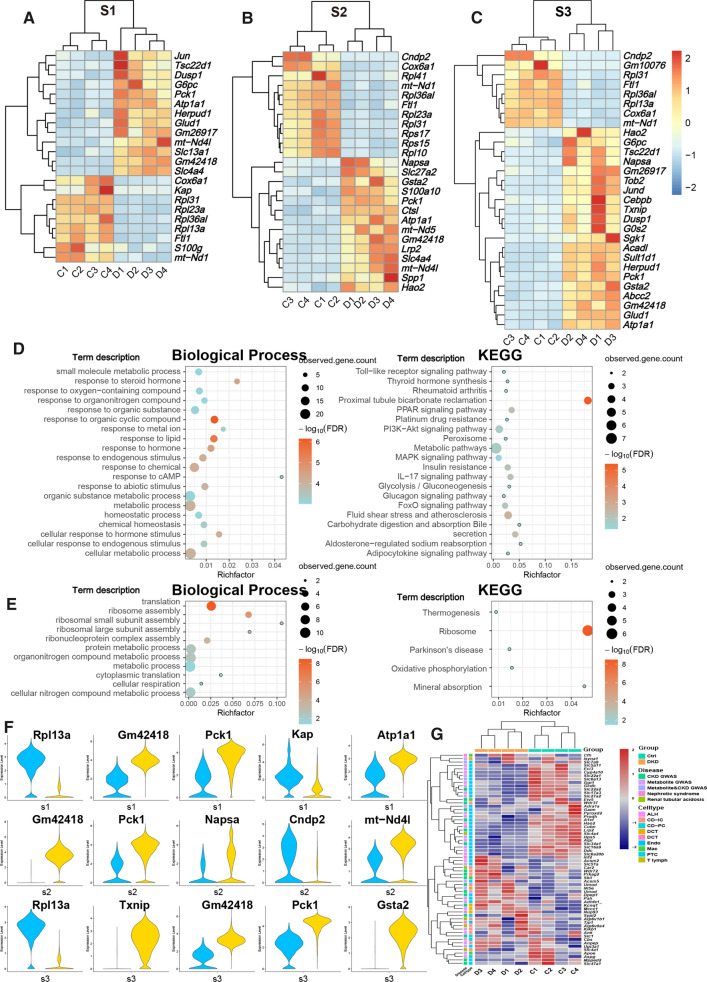
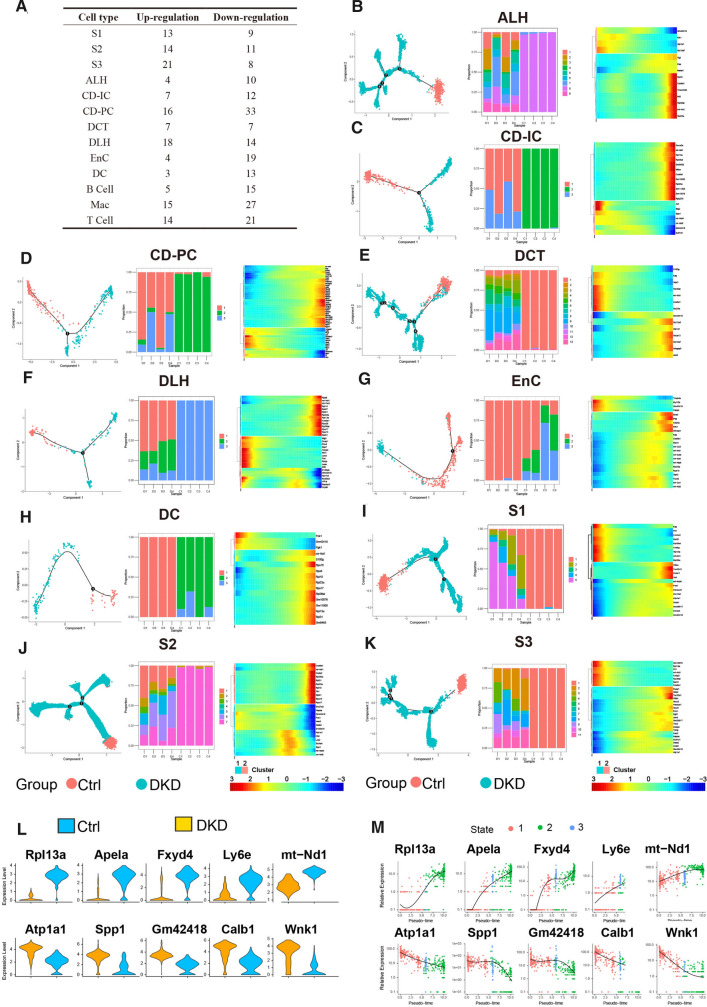
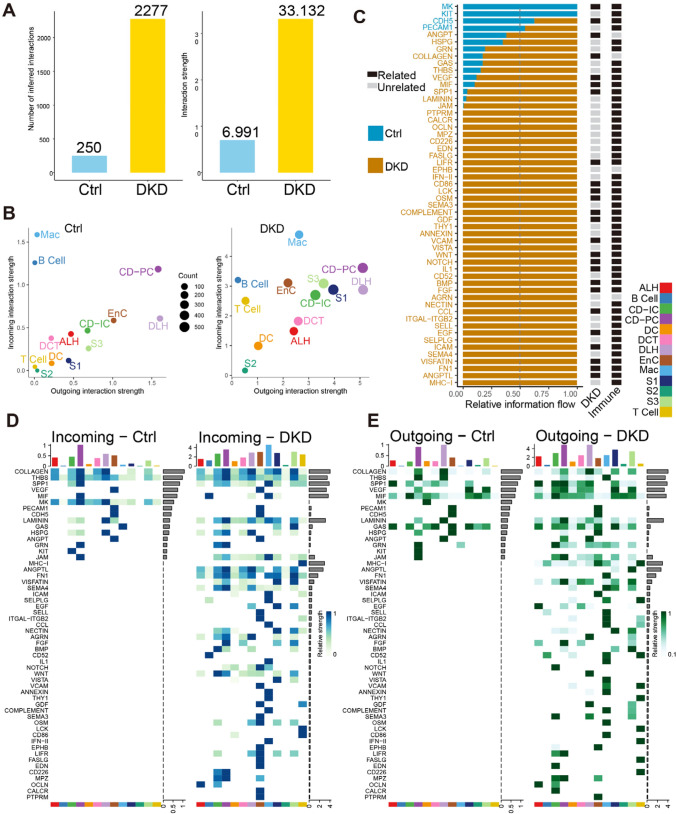
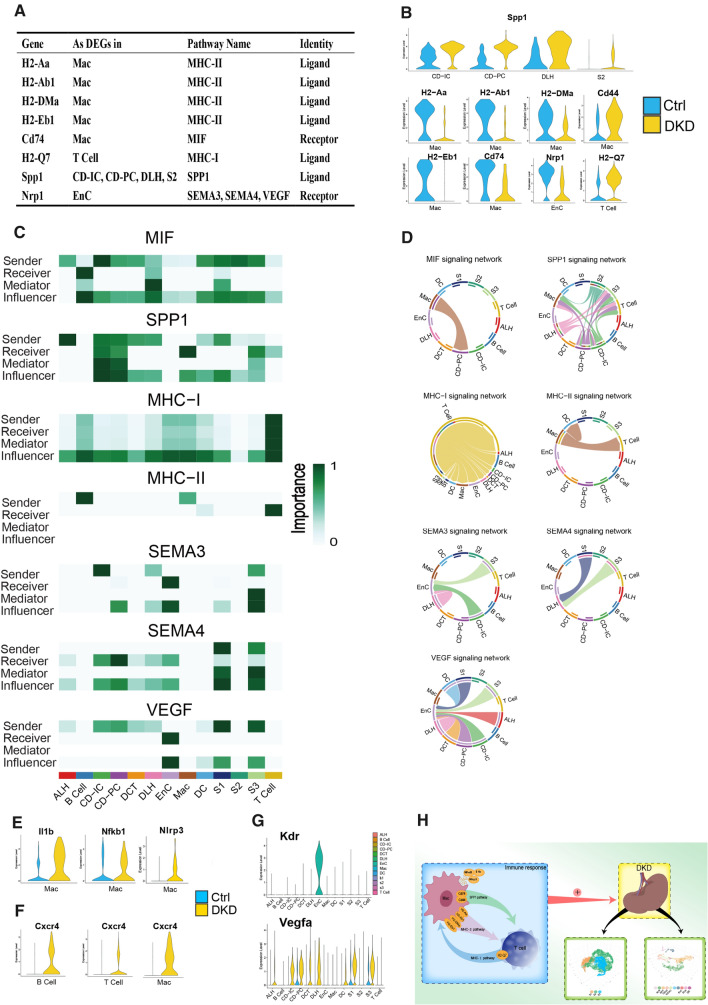
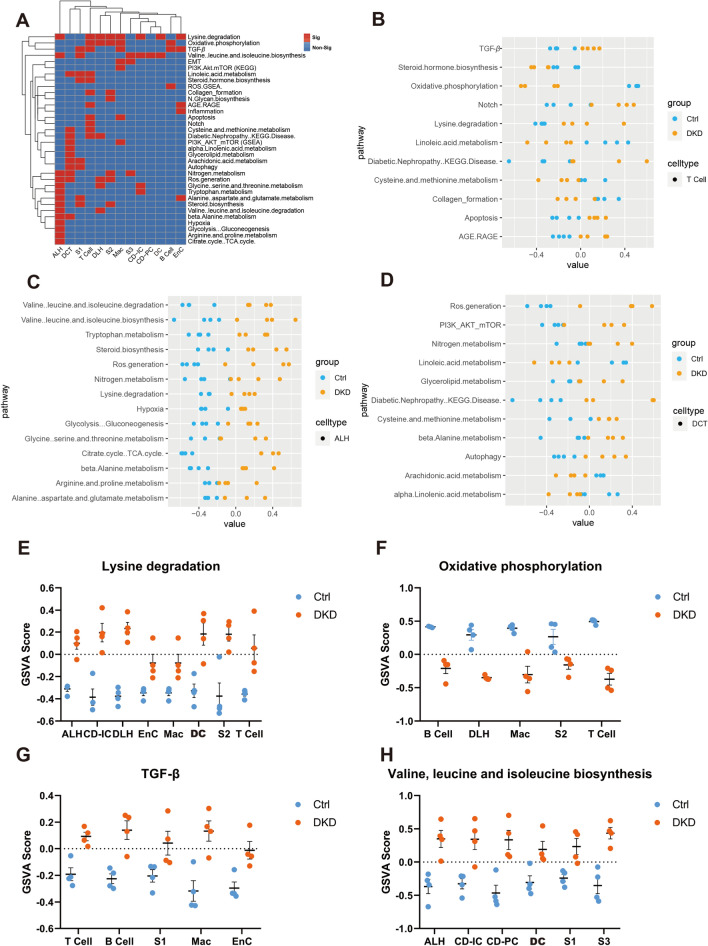
Diabetic kidney disease is the leading cause of impaired kidney function, albuminuria, and renal replacement therapy (dialysis or transplantation), thus placing a large burden on health-care systems. This urgent event requires us to reveal the molecular mechanism of this disease to develop more efficacious treatment. Herein, we reported single-cell RNA sequencing analyses in kidneys of db/db mouse, an animal model for type 2 diabetes and diabetic kidney disease. We first analyzed the hub genes expressed differentially in the single cell resolution transcriptome map of the kidneys. Then we figured out the communication among the renal and immune cells in the kidneys. Data from this report may provide novel information for better understanding the cell-specific targets involved in the aetiologia of type 2 diabetic kidney disease and for cell communication and signaling between renal cells and immune cells of this complex disease.

Keywords: Diabetes; Diabetic kidney disease; End-stage renal disease; Proximal epithelial tubular cells; Single-cell RNA sequencing.


Conflict of interest statement

The authors declare no competing interests.

Figures

Fig. 1
Fig. 1
A pie chart of clusters and proportions of renal and immune cells isolated from kidneys of db/db mice. A. Cell clusters and the proportions of each cell cluster are summarized in pie chart. B-D. Uniform Manifold Approximation and Projection (UMAP) map of PTCs (B), renal stromal cells except PTCs (C) and immune cells (D). Identify clusters of cells by a shared nearest neighbor (SNN) modularity optimization based clustering algorithm. UMAP dimensional reduction technique was performed for cell classification and identification. ALH: Ascending loop of Henle; CD-IC: Collecting duct intercalated cell; CD-PC: Collecting duct principal cell; DCT: Distal convoluted tubule; DLH: Descending loop of Hence; EnC: Endothelial cell; Mac: Macrophage; PTCs: Proximal tubule cells; S1, S2 and S3 are segments of proximal tubule
Fig. 2
Fig. 2
Marker genes of 13 renal cell types in kidneys of db/db mice. A-C. The expression of marker genes in S1 (A), S2 (B) and S3 (C) of PTCs was demonstrated in violin plots. D. Stacked violin plots represent top 3 marker genes in 10 cell clusters, including T cell, ALH, DCT, CD-IC, CD-PC, Mac, EnC, B cell, DLH and DC. ALH: Ascending loop of Henle; CD-IC: Collecting duct intercalated cell; CD-PC: Collecting duct principal cell; DCT: Distal convoluted tubule; DLH: Descending loop of Hence; EnC: Endothelial cell; Mac: Macrophage; B- and T-cells; DC: Dendritic cells
Fig. 3
Fig. 3
Genes expressed differentially in PTCs of kidneys between db/db and control mice and their biological pathways. A-C. Genes expressed differentially in PTCs of kidneys between db/db and control mice are summarized. Heatmap depicted DEGs average expression of each sample scaled by rows to display significant difference between two groups PTCs. D. The bubble map of enrichment analysis of up-regulated DEGs in S1-3 segments of PTCs in group of DKD showed significant (false discovery rate < 0.05) GO pathway of biological process and KEGG pathway. E. It was consistent with the content in D except that the object of enrichment analysis was down-regulated genes. F. Top 5 DEGs of each segmented PTCs according to absolute value of fold change. G. Heatmap displayed the expression genes scaled by rows in different groups and cell types
Fig. 4
Fig. 4
The cells of DKD group and Ctrl group showed significant differences in Pseudotime analysis. A. The table recorded the distribution of both up-regulated and down-regulated DEGs in all renal cells. B-K. Trajectory inference obtained by Monocle using RNA velocities method. These graphs contain three forms of results severally. The first being, cells were displayed in trajectory dimensionality reduction colored by group. Second, distributions of renal stromal cells in different states among each sample were shown in a percentage bar chart respectively. Third, the heatmap showed gene expression (evaluated by Z-value) as the transition during time dynamics of pseudotime. L. Top5 up-regulated DEGs and down-regulated DEGs were selected according to the absolute value of fold change generated by the comparison of expression levels between group DKD and group Ctrl in CD-PC. M. Expression of DEGs in Fig. 4E varied during transition with pseudotime states of CD-PC
Fig. 5
Fig. 5
Global differences in cell communication pathways were observed between Ctrl and DKD groups. A. Histogram of the number and the weighted strength of cell interactions calculated by Cellchat in Ctrl (blue) and DKD (yellow). B. The bubble diagram showed the outgoing and incoming interaction strenth comparison of 13 renal cell types in Ctrl and DKD respectively. C. All significant cell communication signaling pathways were ordered based on differences of relative information flow between Ctrl and DKD. Blue represents the Ctrl-riched pathway and yellow represents the DKD-riched pathway. Black and gray represent whether there is direct documentary evidence of immunity and DKD. D-E: Identify signals contribution of outgoing and incoming signaling pathways within Ctrl (D) and DKD (F) groups were depicted by complex heatmap
Fig. 6
Fig. 6
Cell communication in kidneys of db/db mice. A. The table shows the names of cell signaling pathways, source cell types and roles that DEGs participated in cell communication. B. The expression levels of DEGs involved in cell communication in corresponding cells between the two groups. C. Calculative contribution and importance of each ligand-receptor pair to the overall communication, which reflect the total communication role of every cell type in these signaling pathways by heatmap. D. Intercellular signaling pathways of these DEGs were displayed in chord chart. E–G. Violin diagram of genes related to upstream or downstream of DEGs. F. Schematic diagram of T Cell and Mac participating in Cell communication in DKD process
Fig. 7
Fig. 7
GSVA analysis in various types of renal cells. A. Heat map showed whether levels of DKD-related gene sets differ significantly between the two groups in the corresponding cells. Red represents significance (P < 0.05) and blue represents non-significance. B-D. The dot plot showed the GSVA results of T cell, ALH and DCT in DKD-related gene sets of each sample in group DKD and group Ctrl. E–H. GSVA scores plot of Lysine degradation, Oxidative phosphorylation, TGF-β, valine, leucine and isoleucine biosynthesis gene sets were displayed by each sample (P-values are both greater than 0.01 and less than 0.05, so no additional annotation was made in the figures)

Similar articles

Cited by

References

    1. Anders HJ, Huber TB, Isermann B, Schiffer M. CKD in diabetes: diabetic kidney disease versus nondiabetic kidney disease. Nat Rev Nephrol. 2018;14(6):361–377. doi: 10.1038/s41581-018-0001-y. - DOI - PubMed
    1. Bai M, Chen H, Ding D, Song R, Lin J, Zhang Y, Guo Y, Chen S, Ding G, Zhang Y, et al. MicroRNA-214 promotes chronic kidney disease by disrupting mitochondrial oxidative phosphorylation. Kidney Int. 2019;95:1389–1404. doi: 10.1016/j.kint.2018.12.028. - DOI - PubMed
    1. Beale EG, Harvey BJ, Forest C. PCK1 and PCK2 as candidate diabetes and obesity genes. Cell Biochem Biophys. 2007;48:89–95. doi: 10.1007/s12013-007-0025-6. - DOI - PubMed
    1. Bondeva T, Wolf G. Role of neuropilin-1 in diabetic nephropathy. J Clin Med. 2015;4:1293–1311. doi: 10.3390/jcm4061293. - DOI - PMC - PubMed
    1. Boyd-Shiwarski CR, Shiwarski DJ, Roy A, Namboodiri HN, Nkashama LJ, Xie J, McClain KL, Marciszyn A, Kleyman TR, Tan RJ, et al. Potassium-regulated distal tubule WNK bodies are kidney-specific WNK1 dependent. Mol Biol Cell. 2017;229:499–509. - PMC - PubMed