. 2022 Aug 4;185(16):2952-2960.e10.
doi: 10.1016/j.cell.2022.06.023. Epub 2022 Jun 16.

Structural basis of human ACE2 higher binding affinity to currently circulating Omicron SARS-CoV-2 sub-variants BA.2 and BA.1.1

Affiliations

Structural basis of human ACE2 higher binding affinity to currently circulating Omicron SARS-CoV-2 sub-variants BA.2 and BA.1.1

Linjie Li et al. Cell. .

Abstract

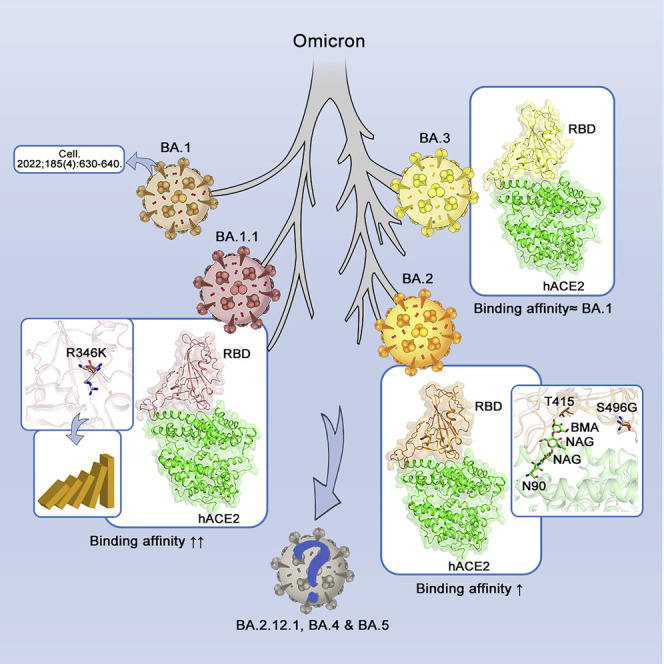
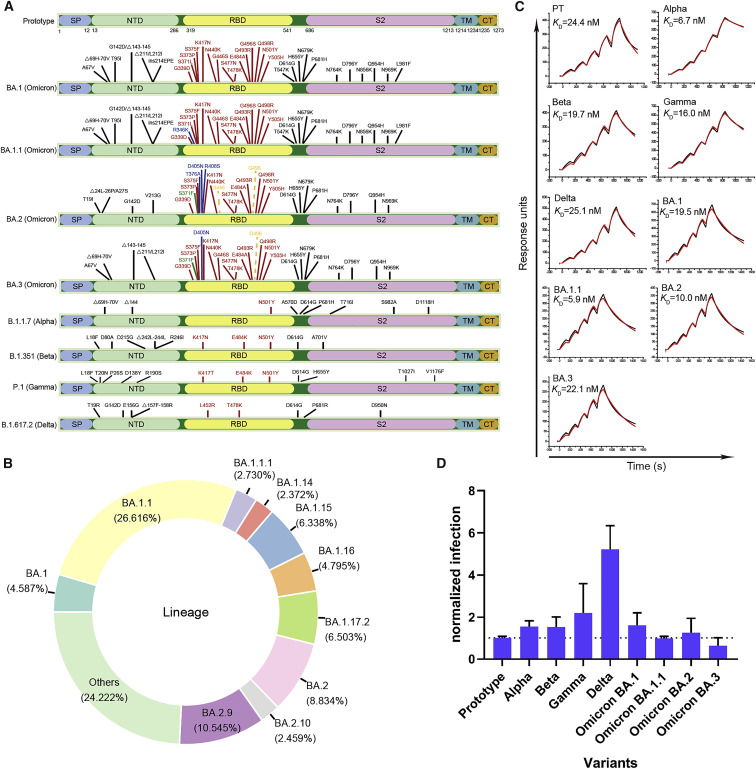
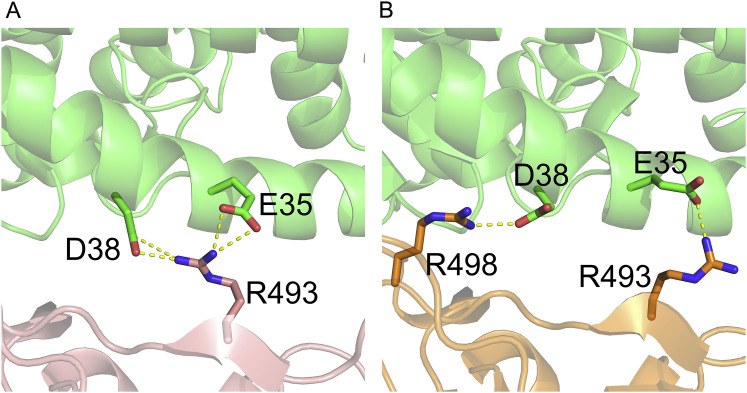
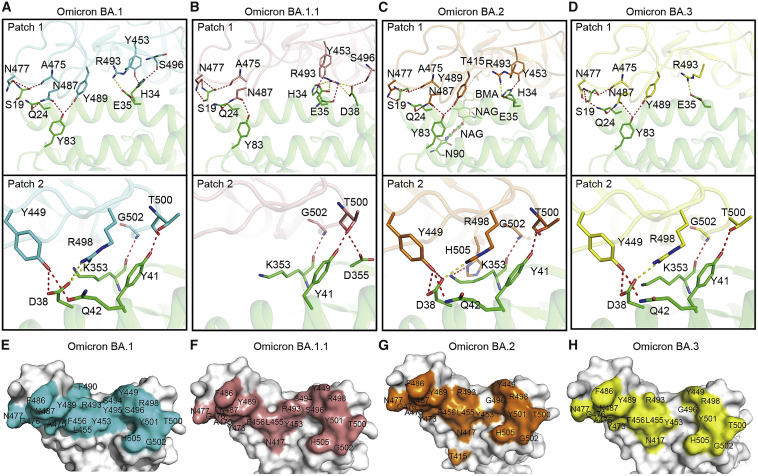
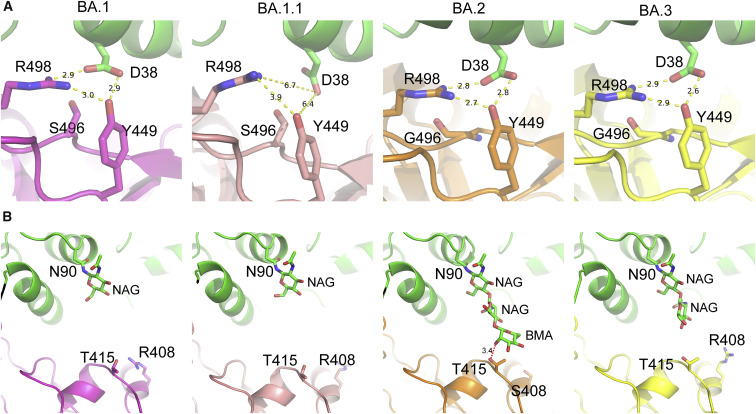
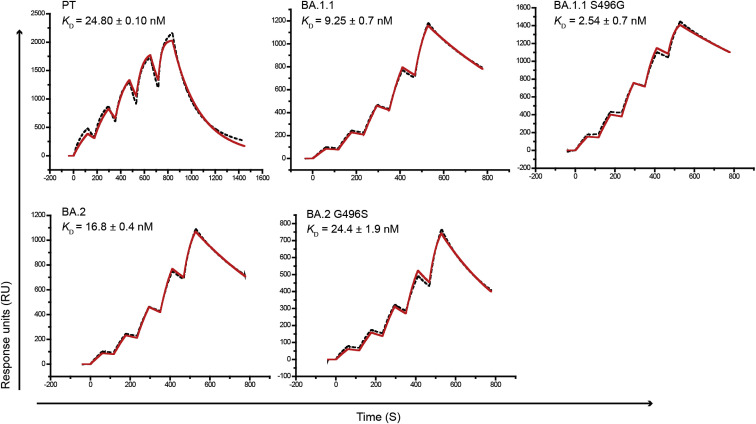
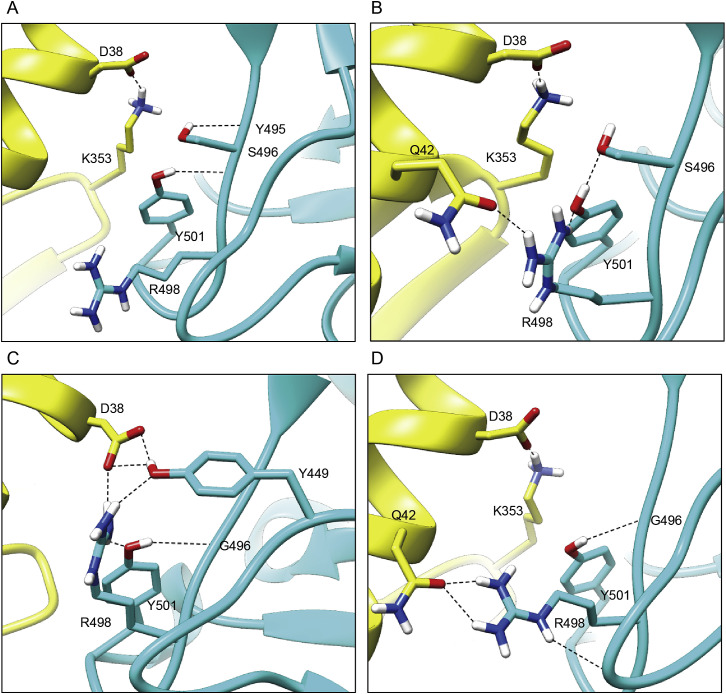
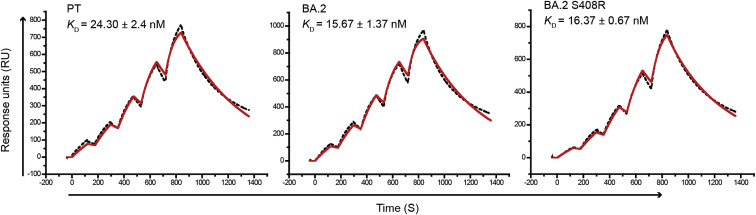
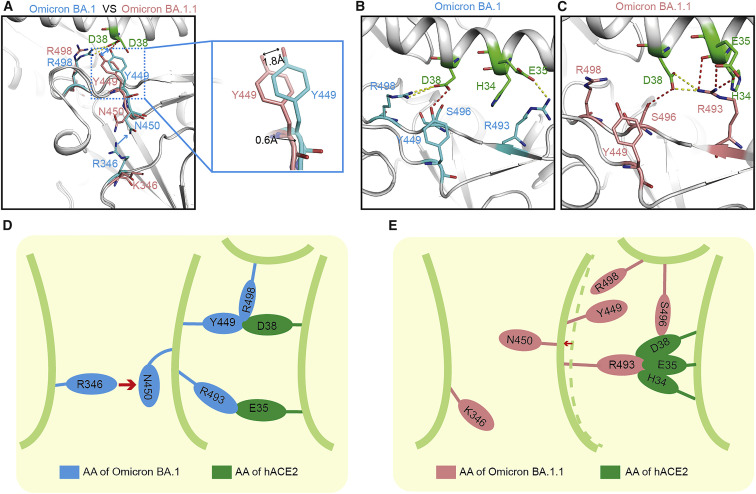
The currently circulating Omicron sub-variants are the SARS-CoV-2 strains with the highest number of known mutations. Herein, we found that human angiotensin-converting enzyme 2 (hACE2) binding affinity to the receptor-binding domains (RBDs) of the four early Omicron sub-variants (BA.1, BA.1.1, BA.2, and BA.3) follows the order BA.1.1 > BA.2 > BA.3 ≈ BA.1. The complex structures of hACE2 with RBDs of BA.1.1, BA.2, and BA.3 reveal that the higher hACE2 binding affinity of BA.2 than BA.1 is related to the absence of the G496S mutation in BA.2. The R346K mutation in BA.1.1 majorly affects the interaction network in the BA.1.1 RBD/hACE2 interface through long-range alterations and contributes to the higher hACE2 affinity of the BA.1.1 RBD than the BA.1 RBD. These results reveal the structural basis for the distinct hACE2 binding patterns among BA.1.1, BA.2, and BA.3 RBDs.

Keywords: Omicron; RBDs; SARS-CoV-2; hACE2.


Conflict of interest statement

Declaration of interests The authors declare no competing interests.

Figures

None
Graphical abstract
Figure 1
Figure 1
Mutation distribution in VOC S proteins and SPR for VOC RBD binding to hACE2 and VOC pseudovirus entry assay (A) Schematic diagram for mutation distribution in the S proteins from the five VOCs, including the four Omicron sub-variants (BA.1, BA.1.1, BA.2, and BA.3). The mutations unique to BA.1.1, BA.2, or BA.3 are indicated in blue. The mutations unique to BA.2 and BA.3 are indicated in green. The mutations present in BA.1 and BA.1.1 but absent in BA.2 and BA.3 are shown with dashed lines. (B) Donut chart for the global composition of Omicron sub-variants (data were collected from GISAID on April 25th, 2022). (C) The SPR curves for the VOC RBDs binding to hACE2. (D) Pseudovirus entry assay for the five VOCs, including the four Omicron sub-variants (BA.1, BA.1.1, BA.2, and BA.3). The error bars indicate the standard deviations (SD) for three or four independent experiments. See also Figure S1.
Figure S1
Figure S1
Flow cytometry assay for VOC RBDs binding to hACE2-expressing BHK-21 cells, related to Figure 1 The BHK-21 transfected with hACE2 fused with eGFP were incubated with the indicated His-tagged RBDs and stained with the anti-His-APC antibody. Non-transfected, non-stained control: the cells were neither transfected with hACE2 nor stained with the RBDs and the anti-His-APC antibody. Transfected, non-stained control: the cells were transfected with hACE2 but not stained with the RBDs and the anti-His-APC antibody.
Figure S2
Figure S2
Salt bridges formed between BA.1.1 RBD/hACE2 and BA.2 RBD/hACE2 interfaces, related to Figure 2 (A) BA.1.1 RBD R493 forms four salt bridges with hACE2 E35 and D38. (B) BA.2 RBD R493 forms a salt bridge with hACE2 E35 and BA.2 RBD R498 forms a salt bridge with hACE2 D38.
Figure 2
Figure 2
The complex structures of SARS-CoV-2 sub-variants BA1.1, BA.2, and BA.3 RBDs bound to hACE2 (A–D) The hydrogen bond (red) and salt bridge (yellow) networks of BA.1 (A), BA1.1 (B), BA.2 (C), and BA.3 (D) RBDs contact with hACE2. The complex structures are shown as a cartoon, and residues involved in hydrogen bond or salt bridge formation are shown as sticks. The RBDs of BA.1, BA1.1, BA.2, and BA.3 are shown as cyan, salmon, orange, and yellow, correspondingly. hACE2 is shown as green. (E–H) The binding surface of hACE2 with the BA.1 (E), BA1.1 (F), BA.2 (G), and BA.3 (H) RBDs. See also Figure S2.
Figure 3
Figure 3
The G496S mutation in RBD and N90-glycan in hACE2 modulate the RBDs/hACE2 interaction (A) The G496S mutation affects the local polar interaction networks at the RBD/hACE2 interfaces. (B) The interaction between hACE2 N90-glycan may be related to the R408S mutations in the BA.2 RBD/hACE2 complex. The four panels from the leftmost one in (A) and (B) are BA.1 RBD/hACE2 (PDB: 7WBP), BA.1.1 RBD/hACE2, BA.2 RBD/hACE2, and BA.3 RBD/hACE2, correspondingly. The numbers on the dash lines are distances (Å) between the two atoms they link. See also Figures S3–S6.
Figure S3
Figure S3
The SPR curves for the PT RBD, BA.1.1 RBD, BA.1.1 with the S496G mutation, BA.2 RBD, and BA.2 with the G496S mutation binding to hACE2, related to Figure 3 The mean and standard deviation of KD values representing three independent experiments are shown.
Figure S4
Figure S4
Representative snapshots clustered from MD trajectories of the (A and B) S496 BA.1 RBD-ACE2 system and the (C and D) G496 BA.1 RBD-ACE2 system, related to Figure 3 RBD domains are colored in cyan, and ACE2 is colored in yellow. H-bonds are displayed as black dotted lines.
Figure S5
Figure S5
Electron densities of the hydrogen bond between BA.2 T415 and hACE2 N90-glycan, related to Figure 3 The local 2Fo-Fc electronic density map at 1.0 σ for hACE2 N90-glycan and BA.2 T415 is shown as mesh lines. The hydrogen bond is shown as the yellow dash line and its length is indicated.
Figure S6
Figure S6
The SPR curves for the PT RBD, BA.2, and BA.2 with the S408R mutation, related to Figure 3 The mean and standard deviation of KD values representing three independent experiments are shown.
Figure 4
Figure 4
A single substitution far away from the binding motif of BA.1.1 RBD changes the interaction network with hACE2 (A–C) Structural comparison between BA.1 RBD/hACE2 complex and BA.1.1 RBD/hACE2 complex. The complex structures are shown as a cartoon and the key amino acids are shown as sticks. The key amino acids in BA.1 RBD and BA.1.1 RBD are colored by cyan and salmon, correspondingly. The key residues in the hACE2 are colored green. (D and E) Pattern diagram of R346K substitution in BA.1.1 RBD changing the interaction network. (D) Schematic of the conformation of the key amino acids in BA.1 RBD. (E) Schematic of the conformation change of the key amino acids after R346K substitution in BA.1.1 RBD.

References

    1. Abraham M.J., Murtolad T., Schulzbc R., Pálla S., Smithbc J.C., Hessa B., Lindahlad E. GROMACS: high performance molecular simulations through multi-level parallelism from laptops to supercomputers. SoftwareX. 2015;1–2:19–25. doi: 10.1016/j.softx.2015.06.001. - DOI
    1. Adams P.D., Afonine P.V., Bunkóczi G., Chen V.B., Davis I.W., Echols N., Headd J.J., Hung L.W., Kapral G.J., Grosse-Kunstleve R.W., et al. Phenix: a comprehensive Python-based system for macromolecular structure solution. Acta Crystallogr. D Biol. Crystallogr. 2010;66:213–221. doi: 10.1107/S0907444909052925. - DOI - PMC - PubMed
    1. Best R.B., Zhu X., Shim J., Lopes P.E., Mittal J., Feig M., Mackerell A.D., Jr. Optimization of the additive CHARMM all-atom protein force field targeting improved sampling of the backbone φ, ψ and side-chain χ(1) and χ(2) dihedral angles. J. Chem. Theory Comput. 2012;8:3257–3273. doi: 10.1021/ct300400x. - DOI - PMC - PubMed
    1. Bruel T., Hadjadj J., Maes P., Planas D., Seve A., Staropoli I., Guivel-Benhassine F., Porrot F., Bolland W.H., Nguyen Y., et al. Serum neutralization of SARS-CoV-2 Omicron sublineages BA.1 and BA.2 in patients receiving monoclonal antibodies. Nat. Med. 2022;28:1297–1302. doi: 10.1038/s41591-022-01792-5. - DOI - PubMed
    1. Bussi G., Donadio D., Parrinello M. Canonical sampling through velocity rescaling. J. Chem. Phys. 2007;126:014101. doi: 10.1063/1.2408420. - DOI - PubMed

Publication types

Supplementary concepts