. 2022 Jul 9;13(1):3998.
doi: 10.1038/s41467-022-31725-2.

Acetyl-CoA-Carboxylase 1-mediated de novo fatty acid synthesis sustains Lgr5+ intestinal stem cell function

Affiliations

Acetyl-CoA-Carboxylase 1-mediated de novo fatty acid synthesis sustains Lgr5+ intestinal stem cell function

Shuting Li et al. Nat Commun. .

Abstract

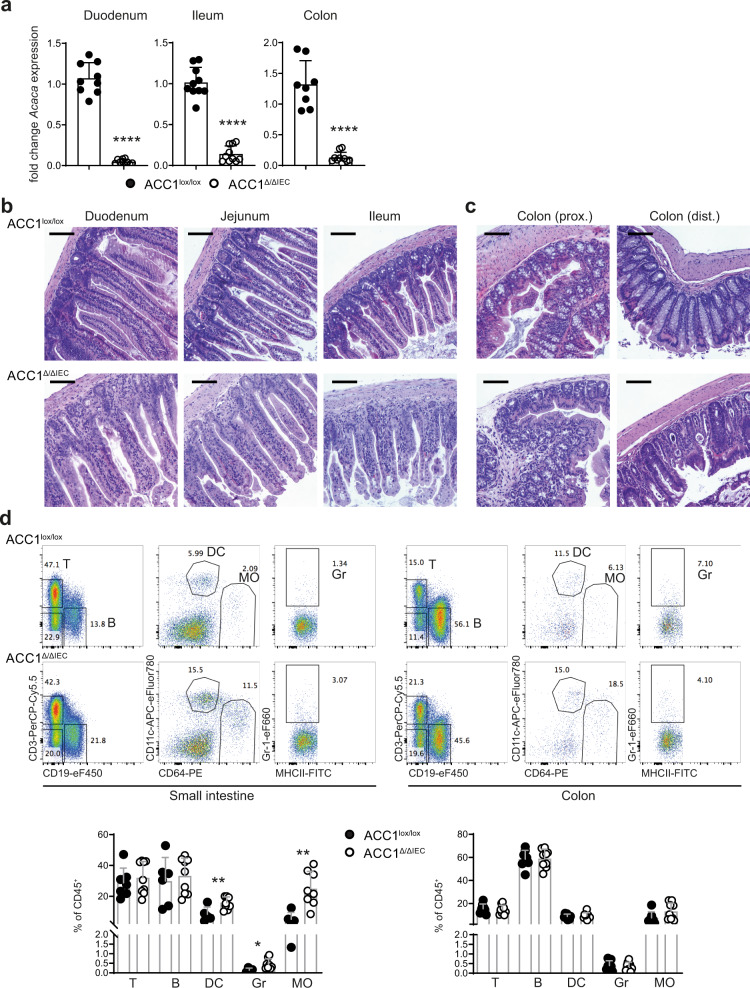
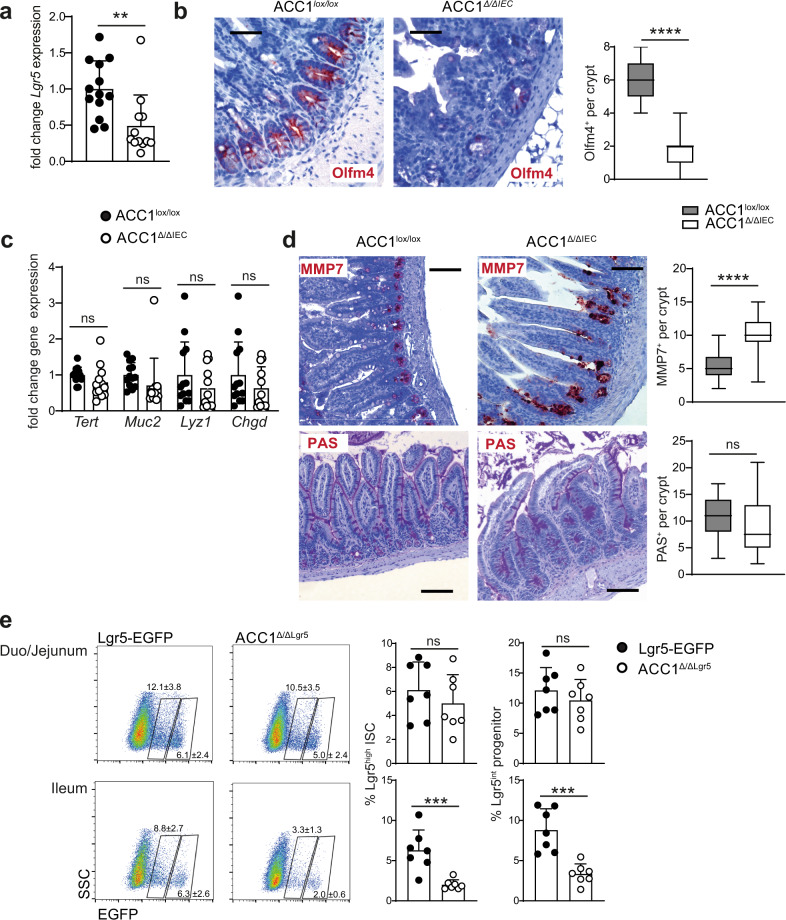
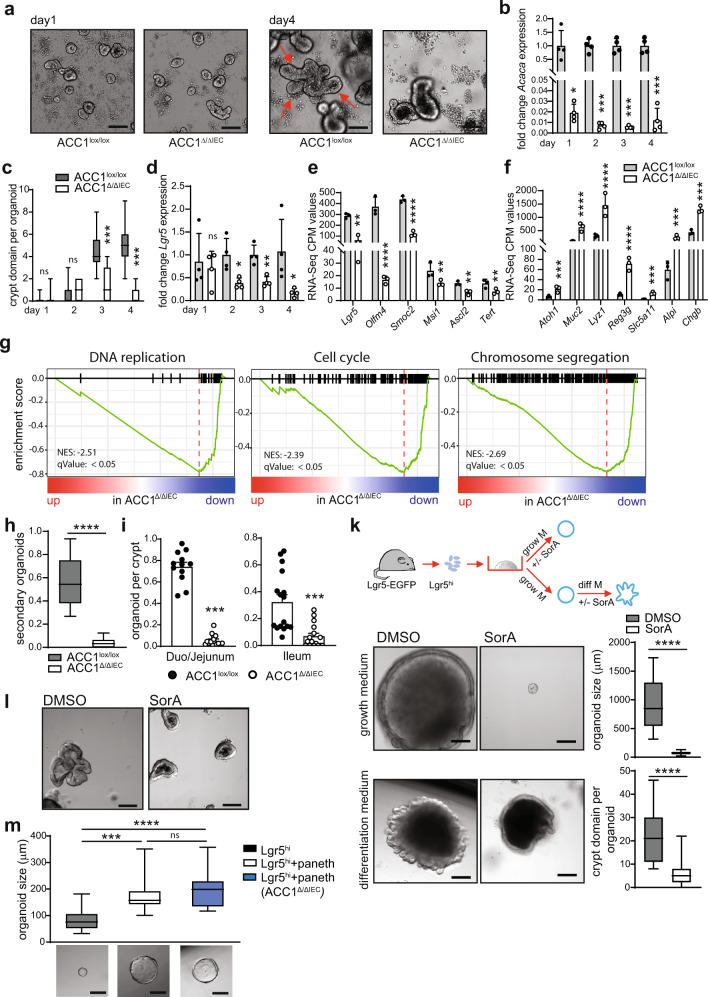
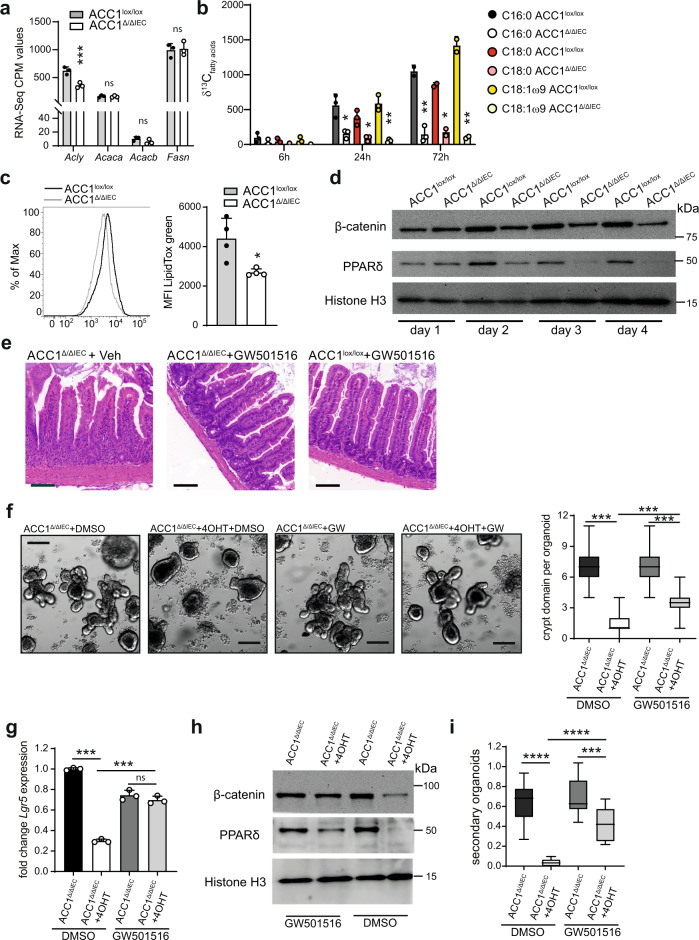
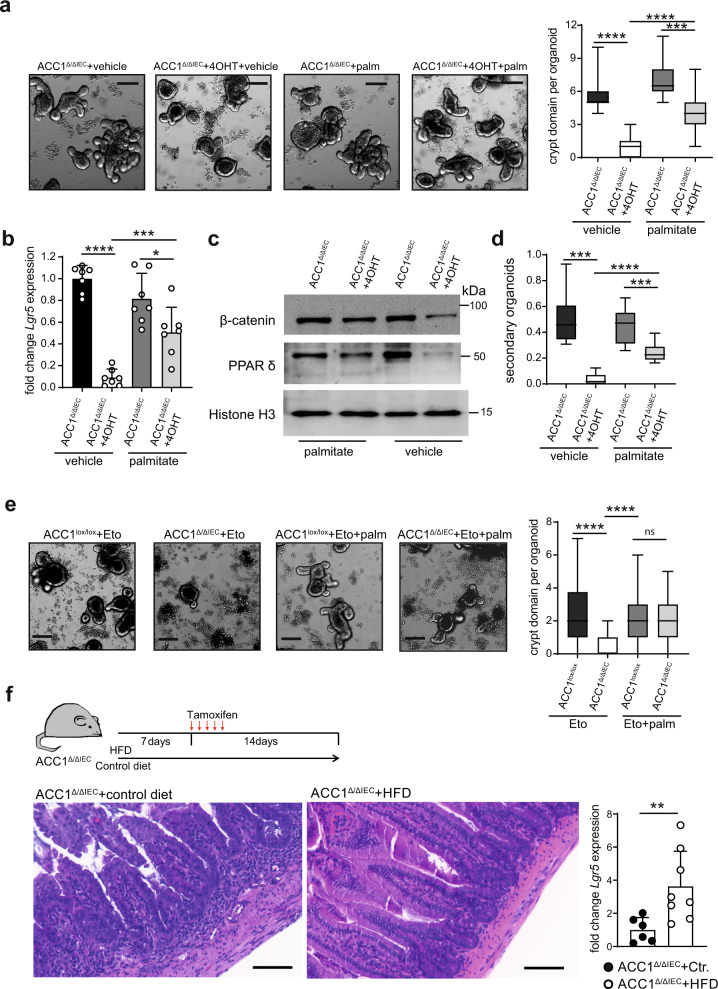
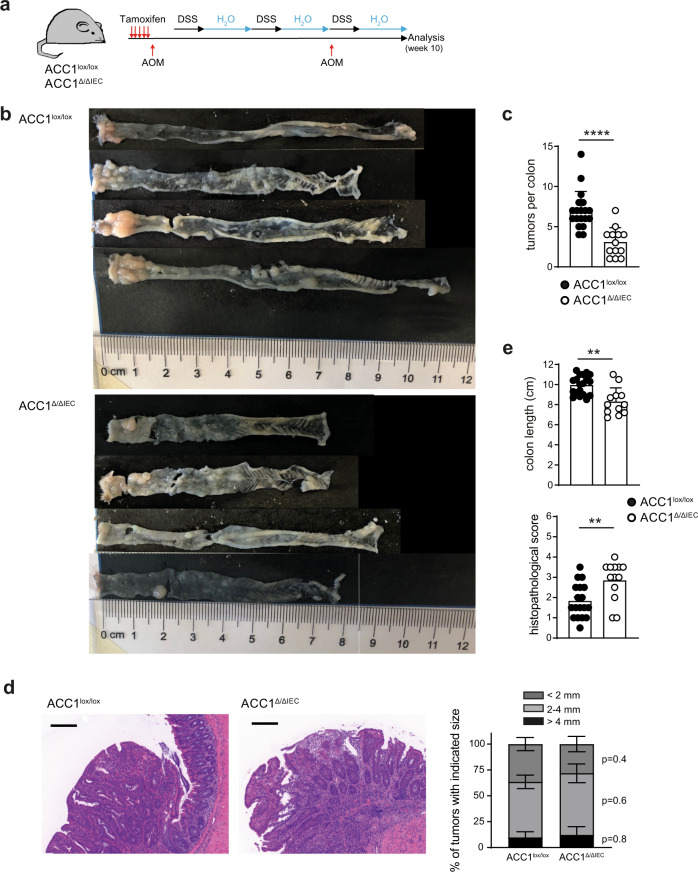
Basic processes of the fatty acid metabolism have an important impact on the function of intestinal epithelial cells (IEC). However, while the role of cellular fatty acid oxidation is well appreciated, it is not clear how de novo fatty acid synthesis (FAS) influences the biology of IECs. We report here that interfering with de novo FAS by deletion of the enzyme Acetyl-CoA-Carboxylase (ACC)1 in IECs results in the loss of epithelial crypt structures and a specific decline in Lgr5+ intestinal epithelial stem cells (ISC). Mechanistically, ACC1-mediated de novo FAS supports the formation of intestinal organoids and the differentiation of complex crypt structures by sustaining the nuclear accumulation of PPARδ/β-catenin in ISCs. The dependency of ISCs on cellular de novo FAS is tuned by the availability of environmental lipids, as an excess delivery of external fatty acids is sufficient to rescue the defect in crypt formation. Finally, inhibition of ACC1 reduces the formation of tumors in colitis-associated colon cancer, together highlighting the importance of cellular lipogenesis for sustaining ISC function and providing a potential perspective to colon cancer therapy.


Conflict of interest statement

The authors declare no competing interests.

Figures

Fig. 1
Fig. 1. Epithelium-specific ACC1 deletion affects crypt architecture in the small intestine and the colon.
ACC1Δ/ΔIEC and ACC1lox/lox control mice were treated with tamoxifen (i.p.) for 5 consecutive days and analyzed on day 9 upon the last tamoxifen injection. a RNA was extracted from duodenum, ileum and colon epithelial cells and qPCR was performed to determine ACC1 deletion efficiency. Data was pooled from 2 independent experiments with a total of n = 9 and 10 mice per group. b Representative H&E stainings of duodenum, jejunum and ileum and c of the proximal (prox.) and distal (dist.) part of colon from ACC1lox/lox control (upper panel) or ACC1Δ/ΔIEC mice (lower panel) from >3 independent experiments with n ≥ 3 mice per group are shown. Scale bars represent 100 µm. d Leukocytes were isolated from the lamina propria of the colon and small intestine and analyzed by flow cytometry. Representative flow cytometry plots from ACC1lox/lox control and ACC1Δ/ΔIEC mice are shown (upper panel). Graphs show frequency (%) of live CD45+ T cells (T), B cells (B), dendritic cells (DC), neutrophilic granulocytes (Gr) and macrophages (MO), Data was pooled from 2 independent experiments with a total of n = 8 and 9 mice per group. Statistical significance was analyzed using unpaired two-tailed Student’s t-test (a, d) with *p < 0.05, **p < 0.01, ***p < 0.001. ****p < 0.0001. Exact p values provided as Source Data. Bar graphs represent mean and error bars indicate SD. Source data are provided as a Source Data file.
Fig. 2
Fig. 2. IEC-specific ACC1-inactivation results in a specific loss of Lgr5+ ISCs.
ACC1Δ/ΔIEC and ACC1lox/lox control mice were analyzed on day 9 after a 5 day period of tamoxifen treatment. a Expression of Lgr5 gene in IECs isolated from the small intestine. Data was pooled from 3 independent experiments with a total of n = 12 and 13 mice per group. b Immunohistochemical staining of the small intestine (ileum) with anti-Olfm4 antibody. For quantification >10 crypts were examined per mouse. Data is shown from one representative out of 3 independent experiments with n = 5 mice per group, bar = 50 µm. c Expression of Tert, Muc2, Lyz1 and Chgb in IECs isolated from the small intestine. Data was pooled from 3 independent experiments with a total of n = 12 and 13 mice per group. d Immunohistochemical staining of small intestinal paneth cells in the ileum of ACC1Δ/ΔIEC and ACC1lox/lox control mice with anti-MMP-7 antibody (upper panel) and PAS staining of neutral and acidic mucins (in pink), representing goblet cells (lower panel), bar = 200 µm. For quantification >10 crypts were examined per mouse. Data was pooled from 2 independent experiments with a total of n = 3 and 4 mice per group. e Frequency of DAPI-Epcam+Lgr5high ISCs and DAPI-Epcam+Lgr5int progenitor cells within total DAPI-Epcam+ epithelial cells isolated from the duodenum/jejunum or the ileum of Lgr5-EGFP-IRES-creERT2 (Lgr5-EGFP) control and ACC1∆/∆Lgr5 mice one day upon the last tamoxifen injection. Data pooled from 2 independent experiments with a total of n = 7 mice per group. Statistical significance was analyzed using unpaired two-tailed Student’s t-test (ae) with *p < 0.05, **p < 0.01, ***p < 0.001. ****p < 0.0001. Exact p values provided as Source Data. Bar graphs represent mean and error bars indicate SD. Boxes in boxplots denote 25th to 75th percentiles with whiskers representing min-max, and the central line the median. Source data are provided as a Source Data file.
Fig. 3
Fig. 3. ACC1 deletion restricts growth and differentiation of intestinal organoids.
ad Organoid culture of crypts isolated from ACC1∆/∆IEC and ACC1lox/lox mice. 4-OHT was added for 24 h after plating to induce ACC1 deletion in organoids from ACC1∆/∆IEC mice. a Organoids were imaged at the indicated time points. Representative pictures are shown from one out of 4 independent experiments with similar results. Bar = 200 µm. Red arrows indicate crypt domains. b, d RNA was extracted from organoids at indicated time points and expression of genes was analyzed by qPCR. Data was pooled from 4 individual experiments. c Number of crypt domain formation in organoids at indicated time points. For quantification, more than 40 organoids per group were analyzed at each time point. Data shown for one representative out of 4 individual experiments. e, f Transcription levels of ISC signature genes and genes associated with secretory or absorptive IEC lineages. CPM values were derived from RNA-seq of organoids from ACC1∆/∆IEC and ACC1lox/lox mice at day 4 after 4-OHT treatment. RNA-seq was performed in triplicates from 3 independent experiments. g GSEA of RNA-seq for DNA replication (GO: 0006260), cell cycle (mmu04110) and chromosome segregation (GO: 0007059). h Number of secondary organoids per dissociated crypt-derived primary organoids. Data pooled from N = 3 independent experiments. i Number of organoids derived from ex vivo isolated crypts. Crypts were isolated from the upper (duo/jejunum) and lower part (ileum) of the small intestine and cultured in vitro. Data pooled from 3 independent experiments with n ≥ 3 mice per group. k Experimental set up. SorA (200 nM) or DMSO was added during organoid culture either in growth medium (upper panel) or differentiation medium (lower panel). Representative pictures of organoids are shown from two independent experiments. Bars represent 200 µm. Quantification was done by measuring the diameter of the spheroids or counting crypt domain formation. Data was pooled from 2 independent experiments, >30 organoids were analyzed for each group. l Human-derived intestinal organoids were cultured for 7 days in the presence or absence of Soraphen A (1 µM). Representative pictures shown for one out of 3 independent experiments with similar results using organoids derived from colonic resections from 3 different adult male or female patients. Bar = 200 µm. m 500 Lgr5-EGFPhigh cells were sorted from the small intestine of Lgr5-EGFP-IRES-CreERT2 mice and cultured either alone, or in the presence of 500 CD24highSSChigh paneth cells sorted from ACC1∆/∆IEC mice. Representative images of organoids are shown from two independent experiments, bar = 200 µm. For quantification, diameter of organoids was measured. Data was pooled from 2 independent experiments, ≥13 organoids were analyzed for each group. Statistical significance was analyzed using unpaired two-tailed Student’s t-test (h, i, k), Benjamini–Hochberg procedure (e, f) or One-way ANOVA with Tukey’s multiple comparison test (b, c, d, m) with *p < 0.05, **p < 0.01, ***p < 0.001. ****p < 0.0001. Exact p values provided as Source Data. Bar graphs represent mean and error bars indicate SD. Boxes in boxplots denote 25th to 75th percentiles with whiskers representing min-max, and the central line the median. Source data are provided as a Source Data file.
Fig. 4
Fig. 4. ACC1 deletion interferes with PPARδ/β-catenin activation in intestinal organoids.
a Transcription levels of genes associated with intracellular de novo fatty acid synthesis. CPM values were derived from RNA-seq of organoids from ACC1∆/∆IEC and ACC1lox/lox mice at day 4 after 4-OHT treatment. RNA-seq was performed in triplicates from 3 independent experiments. b 13C labeled glucose was added to organoids derived from ACC1∆/∆IEC and ACC1lox/lox mice directly after 4-OHT treatment. Organoids were harvested at indicated time points and incorporation (δ) of 13C into de novo synthesized fatty acids was measured by mass-spec. Data pooled from N = 3 independent experiments. c Accumulation of neutral lipids in organoids. LipidTox green was added 30 min prior to analysis of mean fluorescence intensity (MFI) by flow cytometry. Data is representative for 4 independent experiments. d Western blot analysis of nuclear PPARδ and β-catenin protein was performed at indicated time points in organoids derived from ACC1lox/lox and ACC1∆/∆IEC mice. Anti-histone H3 was used as loading control. Representative data is shown from one out of 2 independent experiments with similar results. e ACC1Δ/ΔIEC and ACC1lox/lox control mice were injected with tamoxifen and treated daily (i.p.) with PPARδ agonist GW501516 or vehicle (veh) until analysis on day 14. H&E stainings of ileum sections are representative of 2 independent experiments with n = 3–5 mice per group. Scale bar represents 100 µm. fi Organoids from ACC1∆/∆IEC mice were cultured in the absence or presence of 4-OHT for 24 h to induce ACC1 deletion. PPARδ agonist GW501516 or vehicle control (DMSO) were added for the whole culture period of 5 days. f Representative pictures of organoids and quantification of crypt domains. More than 30 organoids per group were analyzed. GW = GW501516. Bar = 200 µm. g qPCR analysis of Lgr5 expression. h Western blot analysis of nuclear PPARδ and β-catenin protein. GW = GW501516. Representative data is shown from one out of 2 independent experiments with similar results. i Number of secondary organoids per dissociated crypt-derived primary organoids. Primary organoids from ACC1∆/∆IEC mice were cultured +/− 4-OHT for 24 h. GW501516 or DMSO were added directly after plating. Primary organoids were subcloned on day 4. Data was pooled (N = 3) g, i or is representative (f) for 3 independent experiments with similar results. Statistical significance was analyzed using Bonferroni-Dunn method (b), unpaired two-tailed Student’s t-test (c, Benjamini–Hochberg procedure (a) or One-way ANOVA with Tukey’s multiple comparison test (f, g, i) with *p < 0.05, **p < 0.01, ***p < 0.001. ****p < 0.0001. Exact p values provided as Source Data. Bar graphs represent mean and error bars indicate SD. Boxes in boxplots denote 25th to 75th percentiles with whiskers representing min-max, and the central line the median. Source data are provided as a Source Data file.
Fig. 5
Fig. 5. External lipid delivery compensates for the lack of ACC1-mediated de novo FAS.
ad Crypts were isolated from ACC1∆/∆IEC mice and grown in organoid cultures in the absence or presence of 4-OHT for 24 h to induce ACC1 deletion. Palmitate was added into cultures with 100 µM on day 3 and analyzed 48 h later. a Organoids were imaged and the number of crypt domains was quantified. Crypt domain formation was calculated from >30 organoids per group. (Bar = 200 µm). b qPCR analysis of Lgr5 expression. c Western blot analysis of nuclear PPARδ and β-catenin protein. d Secondary culture of organoids from palmitate-treated primary culture. e Organoid cultures of crypts isolated from ACC1∆/∆IEC and ACC1lox/lox mice were treated with Etomoxir (Eto, 10 µM) and palmitate (palm, 100 µM) or vehicle directly after 4-OHT treatment. Crypt domain formation was calculated at day 4 from >30 organoids per group. Data was pooled (N = 3) (a, b, d, e) or is representative (c) for 3 independent experiments with similar results. f ACC1∆/∆IEC mice were injected with tamoxifen and fed with a high fat (HFD) or control diet as indicated in the schematic overview. H&E stainings of ileum sections and expression of Lgr5 gene in IECs isolated from the small intestine. Data shown are representative of 3 independent experiments with n = 3–5 mice per group. Scale bar represents 100 µm. Statistical significance was analyzed using unpaired two-tailed Student’s t-test (f) or One-way ANOVA with Tukey’s multiple comparison test (a, b, d, e) with *p < 0.05, **p < 0.01, ***p < 0.001. ****p < 0.0001. Exact p values provided as Source Data. Bar graphs represent mean and error bars indicate SD. Boxes in boxplots denote 25th to 75th percentiles with whiskers representing min-max, and the central line the median. Source data are provided as a Source Data file.
Fig. 6
Fig. 6. Epithelial inhibition of ACC1-mediated de novo FAS reduces inflammation-associated tumor formation.
a Experimental setting. Deletion of ACC1 was achieved through 5 consecutive days of tamoxifen injection (i.p). Mice were subsequently subjected to 3 cycles of DSS (2% w/v in drinking water) and 2 injections of AOM (10 mg/kg, i.p) before the 1st and 3rd DSS cycle. Analysis was performed on day 16 after the last DSS cycle, as depicted. b Pictures of the colons of ACC1lox/lox and ACC1∆/∆IEC mice are shown for one representative out of 3 independent experiments. c Numbers of macroscopically counted colonic tumors. d Representative H&E images of colonic tumors. Bar graph shows the distribution of colonic tumors identified in individual mice classified according to their size. Bar = 200 µm. e Measurement of colon length and the histopathological score. Data was pooled from 3 experiments with n = 19 (ACC1∆/∆IEC) and n = 13 (ACC1lox/lox) mice (c, d) and n = 18 (ACC1∆/∆IEC) and n = 13 (ACC1lox/lox) mice (e). Statistical analysis was performed using unpaired two-tailed Student’s t-test with *p < 0.05, **p < 0.01, ***p < 0.001. ****p < 0.0001. Exact p values provided as Source Data. Bar graphs represent mean and error bars indicate SD (c, e) or SEM (d). Source data are provided as a Source Data file.

References

    1. Kaiko GE, et al. The Colonic Crypt Protects Stem Cells from Microbiota-Derived Metabolites. Cell. 2016;165:1708–1720. doi: 10.1016/j.cell.2016.05.018. - DOI - PMC - PubMed
    1. Kelly CJ, et al. Crosstalk between Microbiota-Derived Short-Chain Fatty Acids and Intestinal Epithelial HIF Augments Tissue Barrier Function. Cell Host Microbe. 2015;17:662–671. doi: 10.1016/j.chom.2015.03.005. - DOI - PMC - PubMed
    1. Berger CN, et al. Citrobacter rodentium Subverts ATP Flux and Cholesterol Homeostasis in Intestinal Epithelial Cells In Vivo. Cell Metab. 2017;26:738–752 e736. doi: 10.1016/j.cmet.2017.09.003. - DOI - PMC - PubMed
    1. Barker N, et al. Identification of stem cells in small intestine and colon by marker gene Lgr5. Nature. 2007;449:1003–1007. doi: 10.1038/nature06196. - DOI - PubMed
    1. Sato T, et al. Paneth cells constitute the niche for Lgr5 stem cells in intestinal crypts. Nature. 2011;469:415–418. doi: 10.1038/nature09637. - DOI - PMC - PubMed

Publication types

MeSH terms

LinkOut - more resources