

Identification and demonstration of roGFP2 as an environmental sensor for cryogenic correlative light and electron microscopy
- PMID: 35811036
- PMCID: PMC9452478
- DOI: 10.1016/j.jsb.2022.107881
Identification and demonstration of roGFP2 as an environmental sensor for cryogenic correlative light and electron microscopy
Abstract
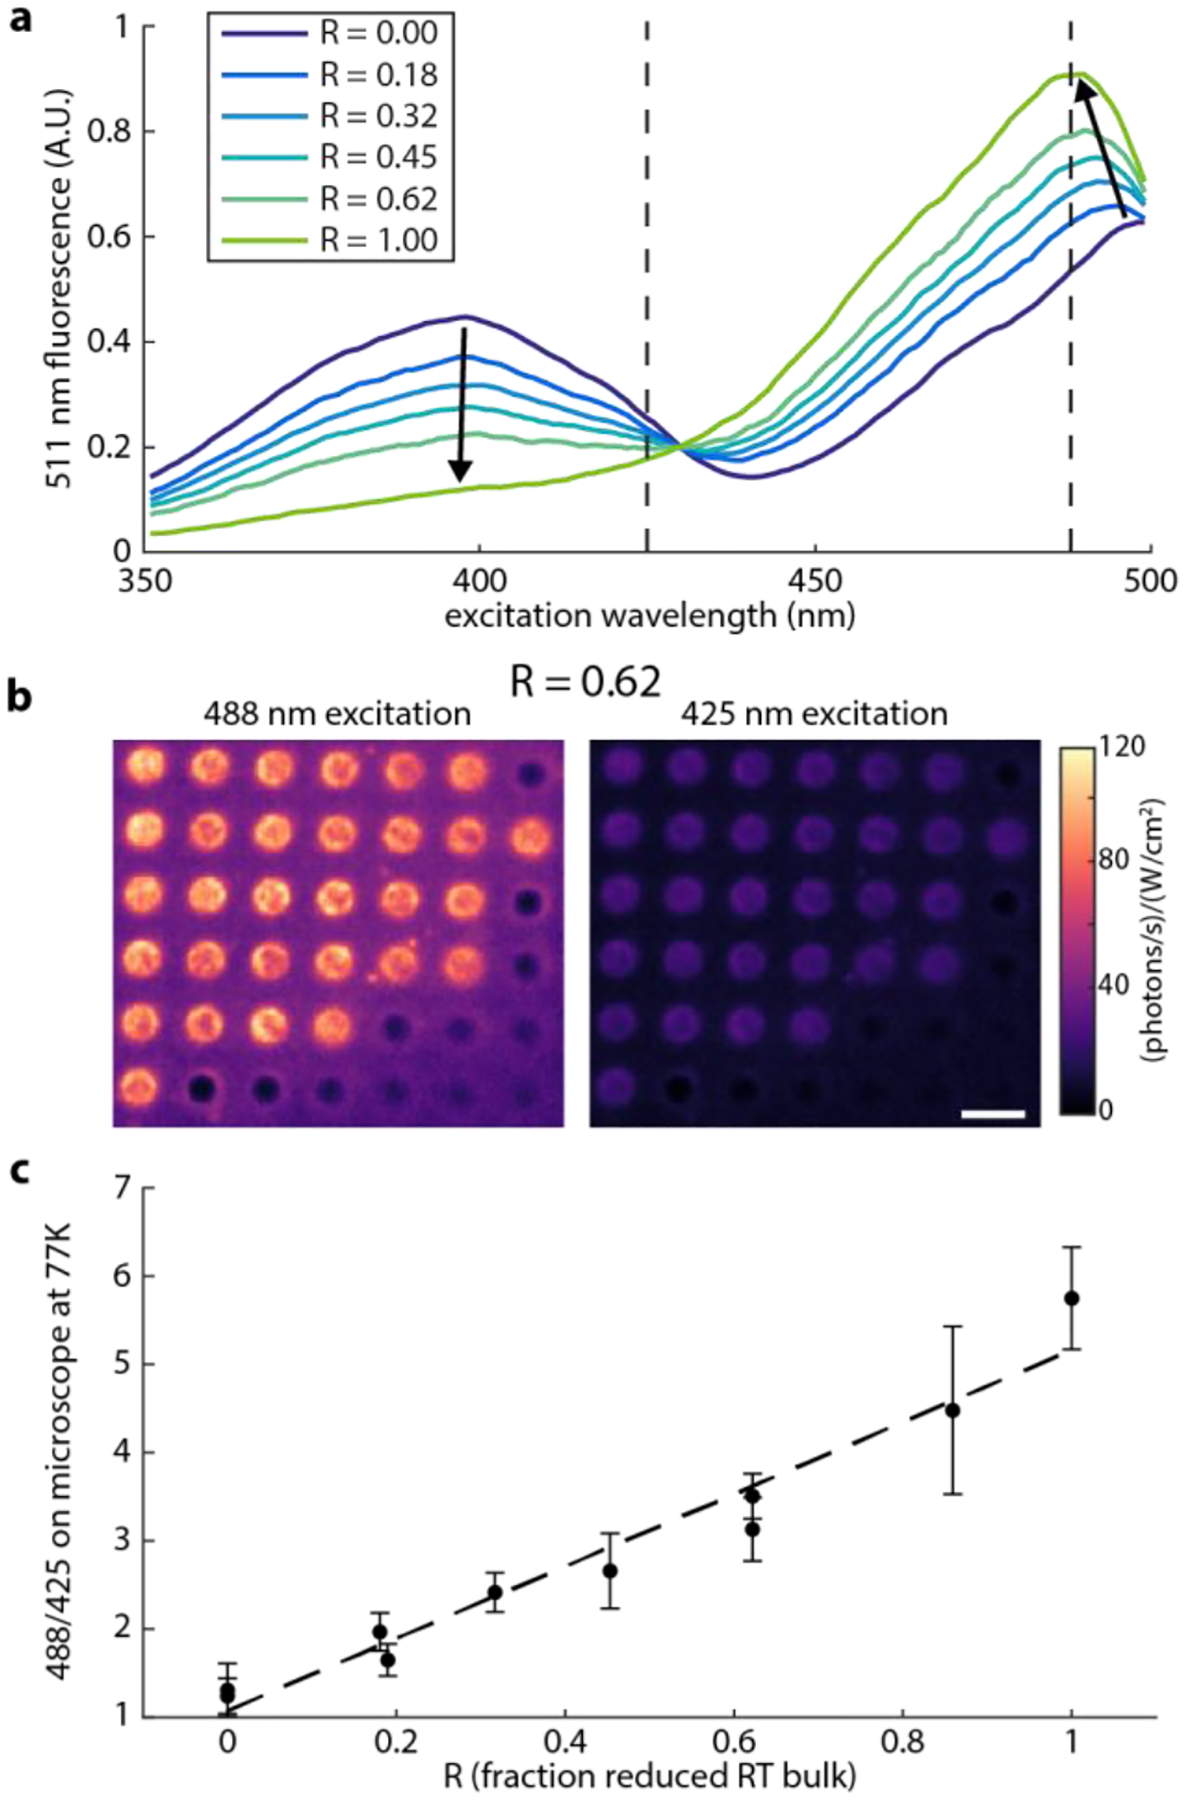
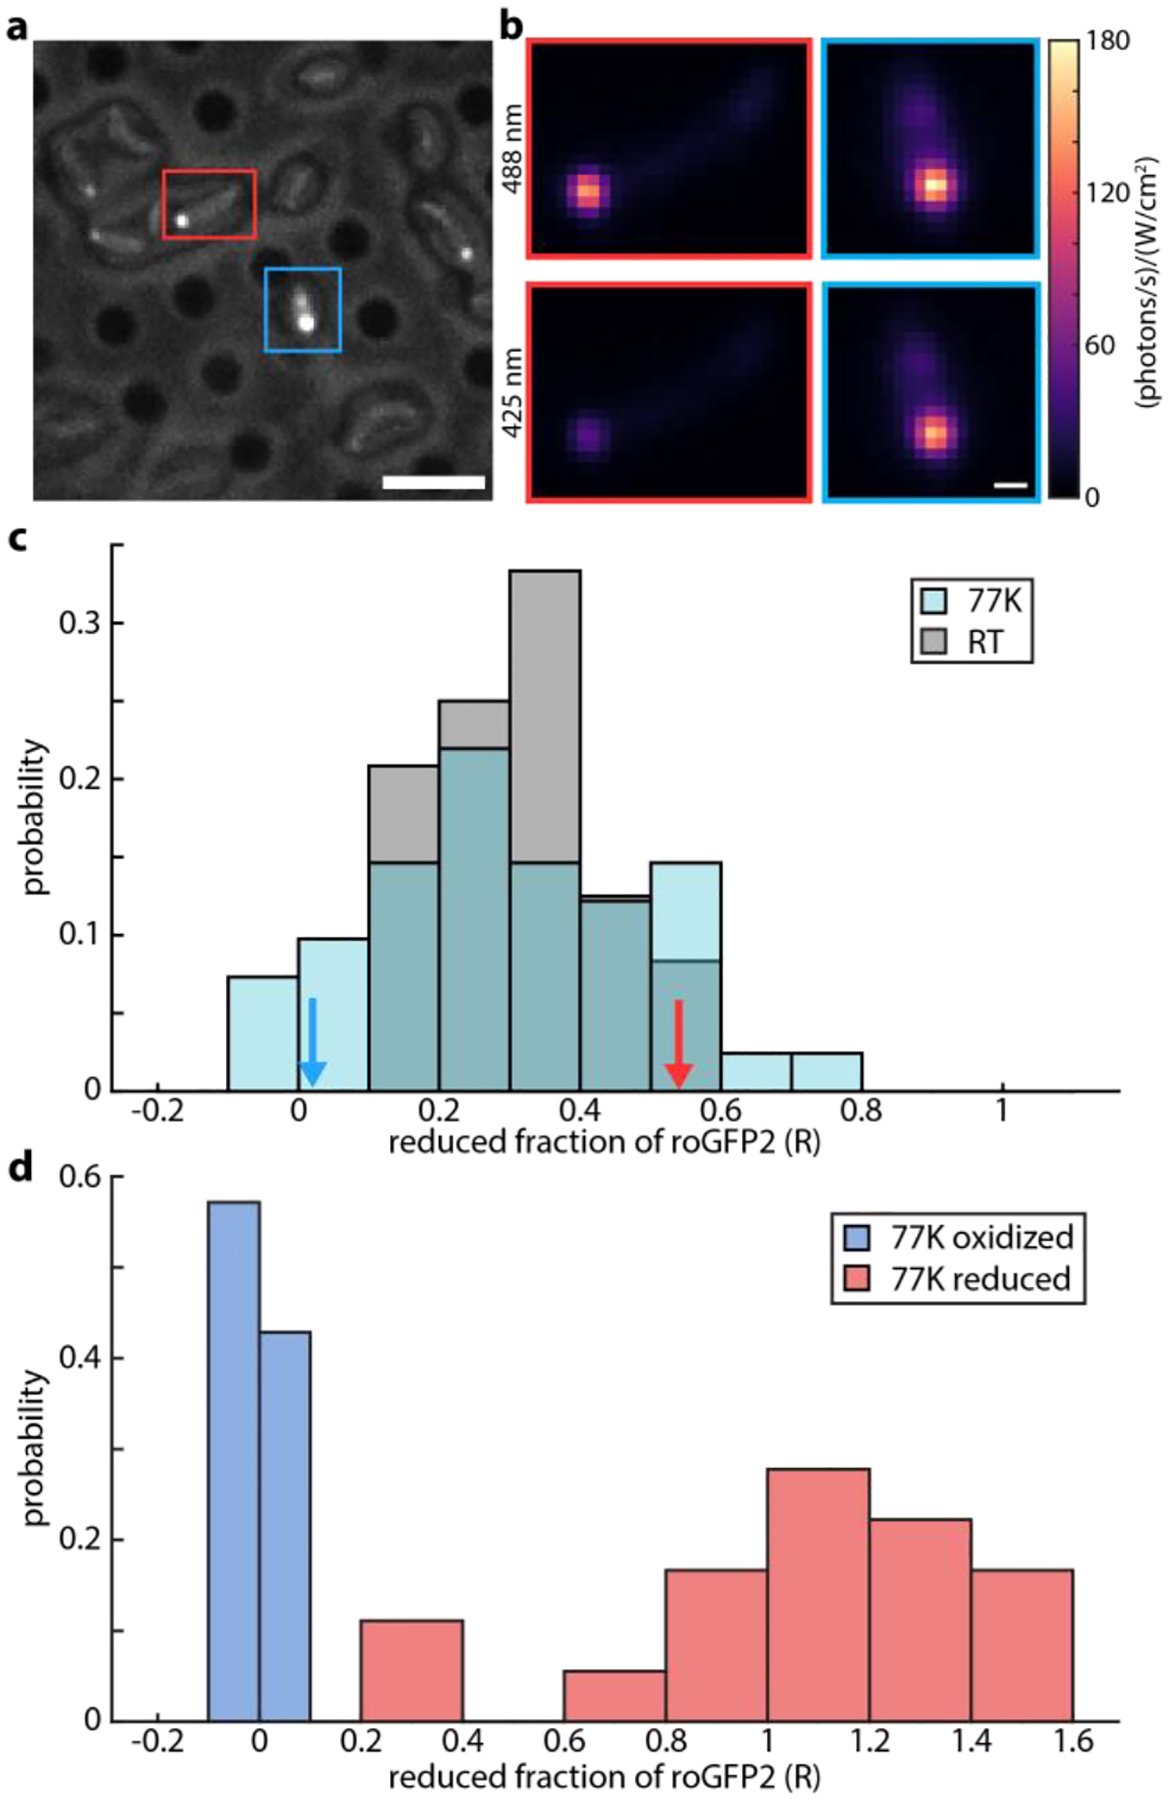
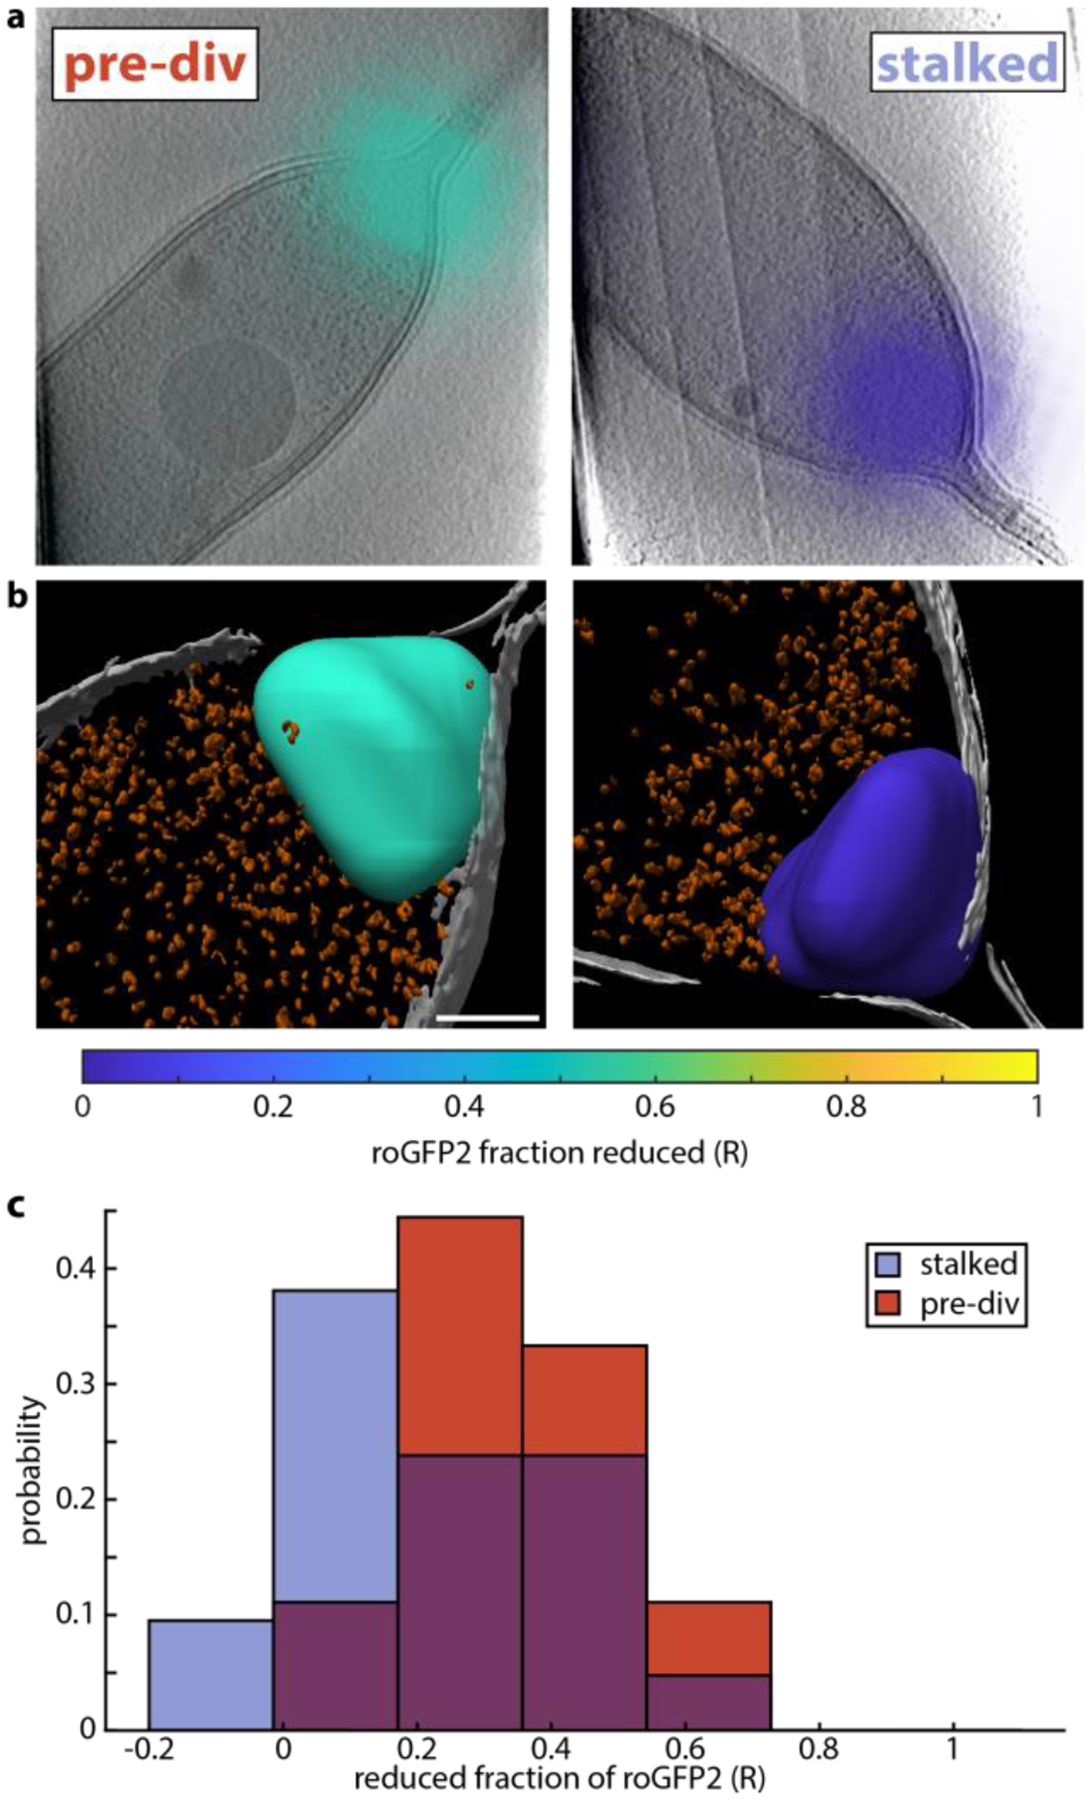
Cryogenic correlative light and electron microscopy (cryo-CLEM) seeks to leverage orthogonal information present in two powerful imaging modalities. While recent advances in cryogenic electron microscopy (cryo-EM) allow for the visualization and identification of structures within cells at the nanometer scale, information regarding the cellular environment, such as pH, membrane potential, ionic strength, etc., which influences the observed structures remains absent. Fluorescence microscopy can potentially be used to reveal this information when specific labels, known as fluorescent biosensors, are used, but there has been minimal use of such biosensors in cryo-CLEM to date. Here we demonstrate the applicability of one such biosensor, the fluorescent protein roGFP2, for cryo-CLEM experiments. At room temperature, the ratio of roGFP2 emission brightness when excited at 425 nm or 488 nm is known to report on the local redox potential. When samples containing roGFP2 are rapidly cooled to 77 K in a manner compatible with cryo-EM, the ratio of excitation peaks remains a faithful indicator of the redox potential at the time of freezing. Using purified protein in different oxidizing/reducing environments, we generate a calibration curve which can be used to analyze in situ measurements. As a proof-of-principle demonstration, we investigate the oxidation/reduction state within vitrified Caulobacter crescentus cells. The polar organizing protein Z (PopZ) localizes to the polar regions of C. crescentus where it is known to form a distinct microdomain. By expressing an inducible roGFP2-PopZ fusion we visualize individual microdomains in the context of their redox environment.
Keywords: Bacteria; Biosensor; CLEM; Cryogenic electron tomography; Fluorescence microscopy; Oxidation/reduction.
Copyright © 2022 Elsevier Inc. All rights reserved.
Conflict of interest statement
Declaration of Competing Interest The authors declare that they have no known competing financial interests or personal relationships that could have appeared to influence the work reported in this paper.
Figures
Similar articles
-
High-vacuum optical platform for cryo-CLEM (HOPE): A new solution for non-integrated multiscale correlative light and electron microscopy.J Struct Biol. 2018 Jan;201(1):63-75. doi: 10.1016/j.jsb.2017.11.002. Epub 2017 Nov 4. J Struct Biol. 2018. PMID: 29113848
-
Identification of PAmKate as a Red Photoactivatable Fluorescent Protein for Cryogenic Super-Resolution Imaging.J Am Chem Soc. 2018 Oct 3;140(39):12310-12313. doi: 10.1021/jacs.8b05960. Epub 2018 Sep 20. J Am Chem Soc. 2018. PMID: 30222332 Free PMC article.
-
Correlative super-resolution fluorescence and electron cryo-microscopy based on cryo-SOFI.Methods Cell Biol. 2021;162:253-271. doi: 10.1016/bs.mcb.2020.10.021. Epub 2020 Dec 19. Methods Cell Biol. 2021. PMID: 33707015
-
Towards correlative super-resolution fluorescence and electron cryo-microscopy.Biol Cell. 2016 Sep;108(9):245-58. doi: 10.1111/boc.201600008. Epub 2016 Jun 22. Biol Cell. 2016. PMID: 27225383 Free PMC article. Review.
-
Recent advances in correlative cryo-light and electron microscopy.Curr Opin Struct Biol. 2024 Dec;89:102934. doi: 10.1016/j.sbi.2024.102934. Epub 2024 Oct 3. Curr Opin Struct Biol. 2024. PMID: 39366119 Review.
Cited by
-
Characterization of mApple as a Red Fluorescent Protein for Cryogenic Single-Molecule Imaging with Turn-Off and Turn-On Active Control Mechanisms.J Phys Chem B. 2023 Mar 30;127(12):2690-2700. doi: 10.1021/acs.jpcb.2c08995. Epub 2023 Mar 21. J Phys Chem B. 2023. PMID: 36943356 Free PMC article.
-
Time-resolved cryogenic electron tomography for the study of transient cellular processes.Mol Biol Cell. 2024 Jul 1;35(7):mr4. doi: 10.1091/mbc.E24-01-0042. Epub 2024 May 8. Mol Biol Cell. 2024. PMID: 38717434 Free PMC article.
References
-
- Hoffman DP; Shtengel G; Xu CS; Campbell KR; Freeman M; Wang L; Milkie DE; Pasolli HA; Iyer N; Bogovic JA; Stabley DR; Shirinifard A; Pang S; Peale D; Schaefer K; Pomp W; Chang C-L; Lippincott-Schwartz J; Kirchhausen T; Solecki DJ; Betzig E; Hess HF, Correlative three-dimensional super-resolution and block-face electron microscopy of whole vitreously frozen cells. Science 2020, 367 (6475), eaaz5357. - PMC - PubMed
-
- Bykov YS; Cortese M; Briggs JAG; Bartenschlager R, Correlative light and electron microscopy methods for the study of virus–cell interactions. FEBS Letters 2016, 590 (13), 1877–1895. - PubMed
-
- Dahlberg PD; Saurabh S; Sartor AM; Wang JR; Mitchell PG; Chiu W; Shapiro L; Moerner WE, Cryogenic single-molecule fluorescence annotations for electron tomography reveal in situ organization of key in Caulobacter. Proceedings of the National Academy of Sciences of the United States of America 2020, 117 (25), 13937–13944. - PMC - PubMed
Publication types
MeSH terms
Grants and funding
LinkOut - more resources
Full Text Sources
Research Materials
