. 2022 Aug;9(24):e2201621.
doi: 10.1002/advs.202201621. Epub 2022 Jul 10.

A Neuroimaging Signature of Cognitive Aging from Whole-Brain Functional Connectivity

Affiliations

A Neuroimaging Signature of Cognitive Aging from Whole-Brain Functional Connectivity

Rongtao Jiang et al. Adv Sci (Weinh). 2022 Aug.

Abstract

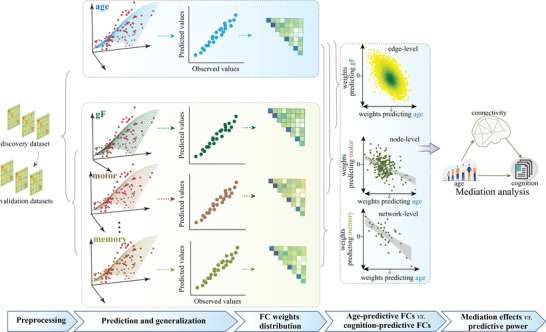
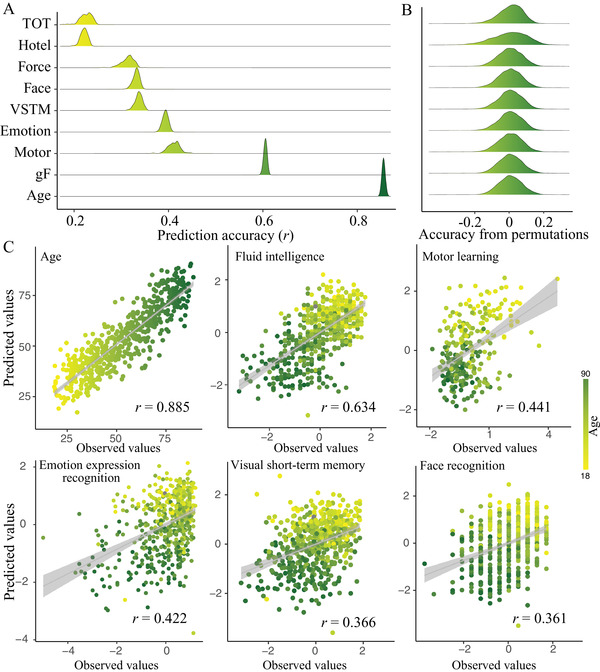
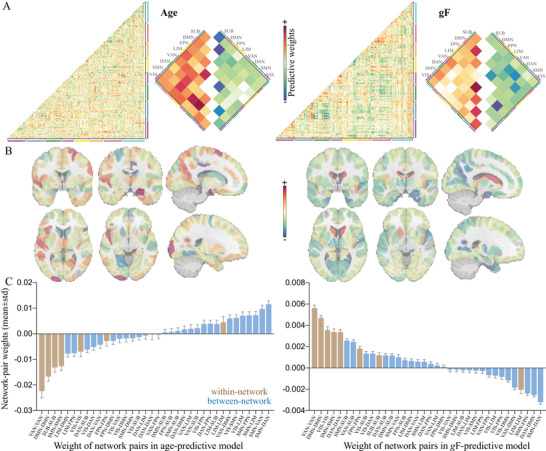
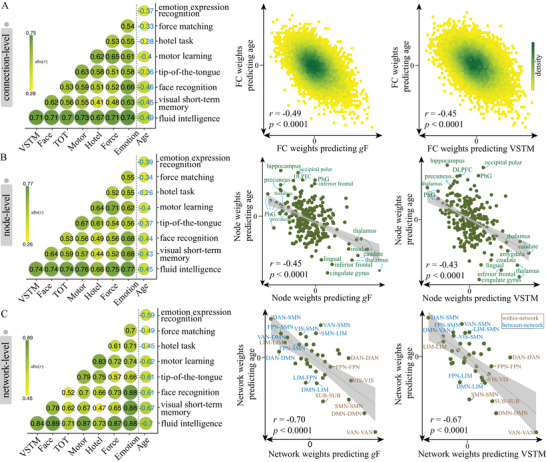
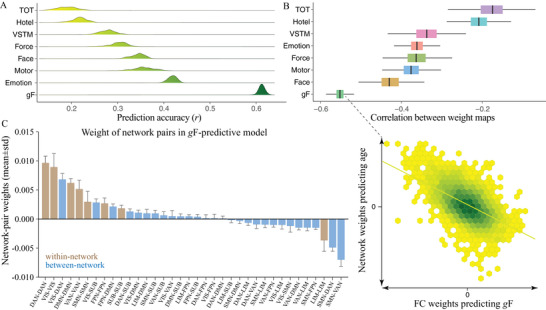
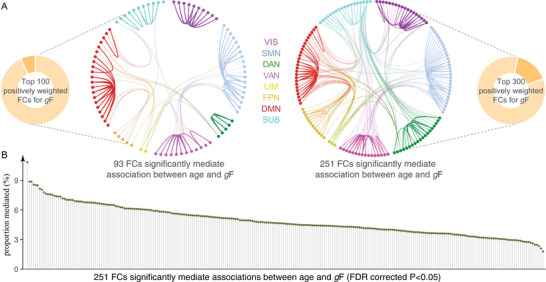
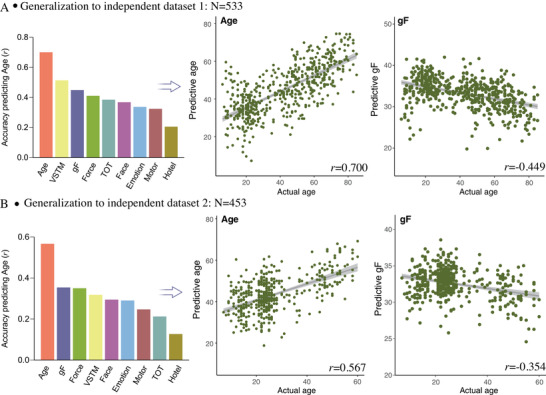
Cognitive decline is amongst one of the most commonly reported complaints during normal aging. Despite evidence that age and cognition are linked with similar neural correlates, no previous studies have directly ascertained how these two constructs overlap in the brain in terms of neuroimaging-based prediction. Based on a long lifespan healthy cohort (CamCAN, aged 19-89 years, n = 567), it is shown that both cognitive function (domains spanning executive function, emotion processing, motor function, and memory) and human age can be reliably predicted from unique patterns of functional connectivity, with models generalizable in two external datasets (n = 533 and n = 453). Results show that cognitive decline and normal aging both manifest decrease within-network connections (especially default mode and ventral attention networks) and increase between-network connections (somatomotor network). Whereas dorsal attention network is an exception, which is highly predictive on cognitive ability but is weakly correlated with aging. Further, the positively weighted connections in predicting fluid intelligence significantly mediate its association with age. Together, these findings offer insights into why normal aging is often associated with cognitive decline in terms of brain network organization, indicating a process of neural dedifferentiation and compensational theory.

Keywords: biomarker; brain age; cognition aging; individualized prediction; predictive neuroimaging.


Conflict of interest statement

The authors declare no conflict of interest.

Figures

Figure 1
Figure 1
Flowchart of the main analyses. To examine whether normal aging and cognitive function have common neural representations, we developed separate predictive models for brain age and eight cognitive metrics based on whole‐brain connectome features in a cross‐sectional adult lifespan sample (aged 19–89 years), and compared their weight maps at connection, node, and network level.
Figure 2
Figure 2
Connectome‐based prediction results for age and eight cognitive metrics spanning domains of executive function, emotional processing, motor function, and memory. A) Distribution of prediction accuracies across 200 repetitions of cross‐validation. B) Distribution of accuracies based on permutation testing across 5000 iterations. C) Scatter plot shows prediction of age and five representative cognitive metrics. Although the prediction framework was repeated 200 times, we just show results from one iteration for visualization. gF, fluid intelligence; TOT, tip‐of‐tongue; VSTM, visual short‐term memory.
Figure 3
Figure 3
Distributions of weight maps in predicting age and fluid intelligence. A) Distributions of raw predictive weights averaged across 2000 cross‐validation rounds. The cell plots show the network‐level representation of the predictive weights. For each pair of networks (between‐network and within‐network), we averaged predictive weights of all connections belonging to that network pair. Positive weights and negative weights were separately summarized for each network pair to demonstrate their relative contribution. B) Distributions of weight maps at the node level. The node‐level representation was achieved by summarizing weight values of all connections incident to each of the 246 atlas‐defined functional macroscale regions. C) Mean weights distribution of within‐network and between‐network connections in age‐ and gF‐predictive models. Error bars indicate standard deviation. DAN, dorsal attention network; DMN, default mode network; FPN, frontoparietal network; gF, fluid intelligence; LIM, limbic network; SMN, somatomotor network; SUB, subcortical network; VAN, ventral attention network; VIS, visual network; VSTM, visual short‐term memory.
Figure 4
Figure 4
Overlap of predictive models between brain age and cognitive function during normal aging. To evaluate the extent to which predictive models were similar to or distinct from each other, we calculated the Pearson's correlation between the averaged weight maps from the age‐predictive model and each of the eight cognition‐predictive models at the A) connection (n = 30 135), B) node (n = 246), and C) network (n = 36) level. Scatter plots in each row are representations of the correlation between age‐predicted model and gF‐predictive/VSTM‐predictive model. Permutation test showed that all correlations were significant at p < 0.0001 across 10 000 iterations. DAN, dorsal attention network; DMN, default mode network; FPN, frontoparietal network; gF, fluid intelligence; LIM, limbic network; SMN, somatomotor network; SUB, subcortical network; VAN, ventral attention network; VIS, visual network; VSTM, visual short‐term memory.
Figure 5
Figure 5
Prediction results of cognitive measures when controlling for the effect of age. A) Distribution of prediction accuracies across 200 repetitions of cross‐validation. B) Correlations of weight maps between age and each of the eight cognitive measures. Of all cognitive measures, fluid intelligence showed the highest similarity in weight maps with age. C) Mean weights distribution of within‐network and between‐network connections in gF‐predictive models. Error bars indicate standard deviation. DAN, dorsal attention network; DMN, default mode network; FPN, frontoparietal network; gF, fluid intelligence; LIM, limbic network; SMN, somatomotor network; SUB, subcortical network; VAN, ventral attention network; VIS, visual network.
Figure 6
Figure 6
The gF‐predictive edges mediated the relationship between age and fluid intelligence. A) The indirect effect of age on fluid intelligence can be mediated by almost all gF‐predictive edges having the top 100 or top 300 positive weights. B) The proportion of mediated effect size ranged from 1.80% to 10.85%.
Figure 7
Figure 7
Generalization of predictive models in two external validation datasets. Predictive models were trained based on the full set of Cam‐CAN subjects for age and each of the eight cognitive metrics separately, and then directly applied to connectome features from each of the two independent datasets. Because the validation datasets did not include the corresponding cognitive measures as the Cam‐CAN, we calculated the correlation between model‐predicted cognitive scores and actual age. Accuracy is shown as the correlation between model‐predictive scores and actual age after controlling for mean framewise displacement. A) External dataset 1 includes 533 healthy subjects aged 6–85 years from NKI database. B) External dataset 2 includes 453 healthy subjects aged 7–60 years from Shanxi, China.

Similar articles

Cited by

References

    1. Elliott M. L., Ageing Res. Rev. 2020, 61, 101075. - PubMed
    1. Murman D. L., Semin. Hear. 2015, 36, 111. - PMC - PubMed
    1. Koen J. D., Rugg M. D., Trends Cogn. Sci. 2019, 23, 547. - PMC - PubMed
    1. Cole J. H., Ritchie S. J., Bastin M. E., Valdés Hernández M. C., Muñoz Maniega S., Royle N., Corley J., Pattie A., Harris S. E., Zhang Q., Wray N. R., Redmond P., Marioni R. E., Starr J. M., Cox S. R., Wardlaw J. M., Sharp D. J., Deary I. J., Mol. Psychiatry 2018, 23, 1385. - PMC - PubMed
    1. Cole J. H., Franke K., Trends Neurosci. 2017, 40, 681. - PubMed

Publication types

LinkOut - more resources