. 2022 Jul 11;7(1):222.
doi: 10.1038/s41392-022-01028-5.

Dihydroartemisinin regulates immune cell heterogeneity by triggering a cascade reaction of CDK and MAPK phosphorylation

Affiliations

Dihydroartemisinin regulates immune cell heterogeneity by triggering a cascade reaction of CDK and MAPK phosphorylation

Qilong Li et al. Signal Transduct Target Ther. .

Abstract

Artemisinin (ART) and dihydroartemisinin (DHA), apart from their profound anti-malaria effect, can also beneficially modulate the host immune system; however, the underlying molecular mechanisms remain unclear. Here, we report that DHA selectively induced T-cell activation, with an increased proportion of Ki67+CD4+ T cells, CD25+CD4+ T cells, interferon (IFN)-γ-producing CD8+ T cells, Brdu+ CD8+ T cells and neutrophils, which was found to enhance cellular immunity to experimental malaria and overcome immunosuppression in mice. We further revealed that DHA upregulated the expression of cell proliferation-associated proteins by promoting the phosphorylation of mitogen-activated protein kinase (MAPK), cyclin-dependent kinases (CDKs), and activator protein 1 in the spleen. This study is the first to provide robust evidence that DHA selectively induced the expansion of subsets of splenic T cells through phosphorylated CDKs and MAPK to enhance cellular immune responses under non-pathological or pathological conditions. The data significantly deepened our knowledge in the mechanism underlying DHA-mediated immunomodulation.


Conflict of interest statement

The authors declare no competing interests.

Figures
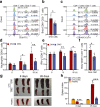
Fig. 1
Fig. 1
DHA promoted splenic cell proliferation and immune cell rearrangement in healthy and cyclophosphamide-induced immunosuppressed mice. a Representative flow cytometry histograms and percentages of positive cells from different DHA and CMC groups at different days after staining for cell surface CD45+CD3+CD8+. b Bar graphs represent significant increase in percentages of Brdu+ proliferative CD8 T cells in DHA-treated group compared to CMC-treated group on day 8 post treatment (n = 7). c Representative flow cytometry histograms and percentages of positive cells from different DHA and CMC groups at different days after staining for cell surface CD45+CD3+CD4+. d, e Bar graphs represent significant increases in percentages of Gr-1+ neutrophils (CD11b+ Gr-1+) or IFN-γ+ CD8 T cells of total CD45+ immune cells in DHA- and CMC-treated mice. f Bar graphs represent significant increases in percentages of Brdu+ CD25+ proliferative CD4 T cells in DHA-treated mice (n = 7). g, h Representative spleen images and quantitative analysis of spleen index of mice in cyclophosphamide-induced immunosuppressive mice and the healthy control mice. DHA=dihydroartemisinin group, CMC=CMC (carboxymethyl cellulose) solvent solution control. The results are representative of three independent experiments with a minimum of seven mice per group per experiment. *p < 0.05; **p < 0.01; ***p < 0.001
Fig. 2
Fig. 2
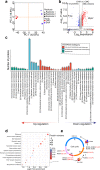
Quantitative proteomics revealed cell cycle progression through activation of cell cycle related proteins promoted by DHA. a The principal component analysis (PCA) at the proteomics level for a total of six spleen samples of the DHA- and CMC- gavage mice. b Differentially expressed proteins were displayed by volcano plots. The vertical lines correspond to 1.5-fold up and down, respectively, and the horizontal line represents the P-value cut-off of 0.05. Upregulation of protein expression in DHA group is shown in red, while downregulation is shown in blue. c KOG classifications of differentially expressed proteins (DEPs). The ordinate denotes the number of proteins in each KOG category. d A bubble chart showing the KEGG pathways. The bubble size represents the number of DEPs, and the bubble color represents the p value. e The pathway map showed the different key proteins involved in the cell cycle signaling pathways. DHA=dihydroartemisinin group, CMC=CMC (carboxymethyl cellulose) solvent solution control group
Fig. 3
Fig. 3
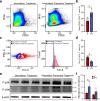
Assessment of Ki67 expression with flow cytometry. ad Numbers indicate MFI of Ki67 expression at different subgroup in different groups. The expression of ki67 on the different subsets was calculated as MFI = positive staining (MFI)-isotype control (MFI). e Representative histograms showing differential expression of ki67 between DHA and CMC group in different CD3+CD4+ T cell subsets. f Representative histograms showing differential expression of ki67 between DHA and CMC group in different CD3+CD4+ T cell subsets (n = 6). Plot shows the increased expression of ki67 in the naïve CD4+ T cells (n = 6). A subset of effector memory T cells re-expresses CD45RA (termed TEMRA). DHA=dihydroartemisinin group, CMC=CMC (carboxymethyl cellulose) solvent solution control group; MFI=mean fluorescence intensities. *p < 0.05; **p < 0.01; ***p < 0.001
Fig. 4
Fig. 4
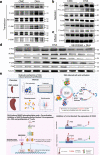
DHA-induced phosphorylation of MAPKs. a Analysis of the kinase activity between DHA to CMC group, where red indicates no inhibition (high kinase activity), blue indicates kinase inhibition (low kinase activity). b, c The motif enrichment heatmap of up-stream and down-stream amino acids of all identified modification sites. Red indicates that the amino acid is significantly enriched near the modification site and green significantly reduced near the modification site. d, e Heatmaps for visualizing are composed of the significant differentially modified sites between DHA and CMC group. f Western blot probed with a monoclonal anti-phosphotyrosine antibody to reveal the differences in protein phosphorylation between DHA-treated and untreated samples. DHA=dihydroartemisinin group, CMC=CMC (carboxymethyl cellulose) solvent solution control group
Fig. 5
Fig. 5
DHA regulated cell-cycle via the p38/JNK MAPK pathways. ac Representative images of Western blot (WB) of phosphorylated MAPK proteins, AP-1 proteins, and CDK2. All experiments were performed in triplicate. Molecular weight (kDa) was labeled at the right. d The expression and phosphorylation of p38 and JNK from DHA-treated alone, the group with inhibitor and the control group were examined with specific antibodies. The expression of CDK2, MCM2, and c-Fos from both DHA-treated alone, the group with inhibitor and the control group were examined with specific antibodies. The effect of DHA was significantly inhibited by SB203580, a specific inhibitor of mitogen-activated protein kinase (p38), which downregulated the expression of c-Fos, MCM2, and CDK2. e Proposed mechanism of DHA-mediated regulation on p38 MAPK pathway and c-Fos complex. DHA induced an enlargement of the spleen and selectively promoted the proliferation of subgroups of splenic T cells. Importantly, DHA upregulated the expression of cell proliferation-associated proteins including CDK1, CDK2, Ssb, PCNA, MCMs, by promoting the phosphorylation of mitogen-activated protein kinase (MAPK) and the activation of c-Fos in the spleen. Inhibition of p38 MAPK and c-Fos blocked T cell proliferation. This figure was created using BioRender (https://biorender.com/). Agreement number is WJ23R5400C. DHA=dihydroartemisinin group, CMC=CMC (carboxymethyl cellulose) solvent solution control group. N = 3 (with biological triplicates) in the WB quantitation. p-p38, phosphorylated-p38 MAPK; p38, total p38 MAPK; SB203580 is a specific inhibitor of mitogen-activated protein kinase (p38); T-5224 is a specific inhibitor of C-Fos
Fig. 6
Fig. 6
Intermittent preventive treatments with DHA-induced T cell activation. a Representative images of BrdU incorporation in CD25+ CD4+ T cells are shown. b More CD4+CD25+ T-lymphocyte proliferation was observed in the IPT group derived from the BrdU incorporation assays. c Histograms show representative flow cytometric stainings (left) and mean fluorescence intensities (right) of Tim-3, and d Bar graph shows differences in percentage of Tim-3+ (CD4-gated) T cells in the IT and IPT group. e Representative images of triplicate Western blot (WB) of phosphorylated- P38 and JNK, which were prominent in the IPT group than that in the IT group. Molecular weight (kDa) was labeled at the right. f Bar graph shows differences in normalized abundance of the two proteins between IT and IPT group. IT=Intermittent treatment, IPT=Intermittent preventive treatment. N = 3 (with biological triplicates) in WB quantitation. *p < 0.05. p-p38=phosphorylated-p38 MAPK

Similar articles

Cited by

References

    1. Lin AJ, Klayman DL, Milhous WK. Antimalarial activity of new water-soluble dihydroartemisinin derivatives. J. Med. Chem. 1987;30:2147–2150. doi: 10.1021/jm00394a037. - DOI - PubMed
    1. Tu Y. The discovery of artemisinin (qinghaosu) and gifts from Chinese medicine. Nat. Med. 2011;17:1217–1220. doi: 10.1038/nm.2471. - DOI - PubMed
    1. Zhang T, et al. Dihydroartemisinin regulates the immune system by promotion of CD8+ T lymphocytes and suppression of B cell responses. Sci. China Life Sci. 2020;63:737–749. doi: 10.1007/s11427-019-9550-4. - DOI - PubMed
    1. Bai B, et al. Therapeutic effects of dihydroartemisinin in multiple stages of colitis-associated colorectal cancer. Theranostics. 2021;11:6225–6239. doi: 10.7150/thno.55939. - DOI - PMC - PubMed
    1. Chen Y, et al. Dihydroartemisinin ameliorates psoriatic skin inflammation and its relapse by diminishing CD8+ T-cell memory in wild-type and humanized mice. Theranostics. 2020;10:10466–10482. doi: 10.7150/thno.45211. - DOI - PMC - PubMed

Publication types